Success Rate Analysis Page
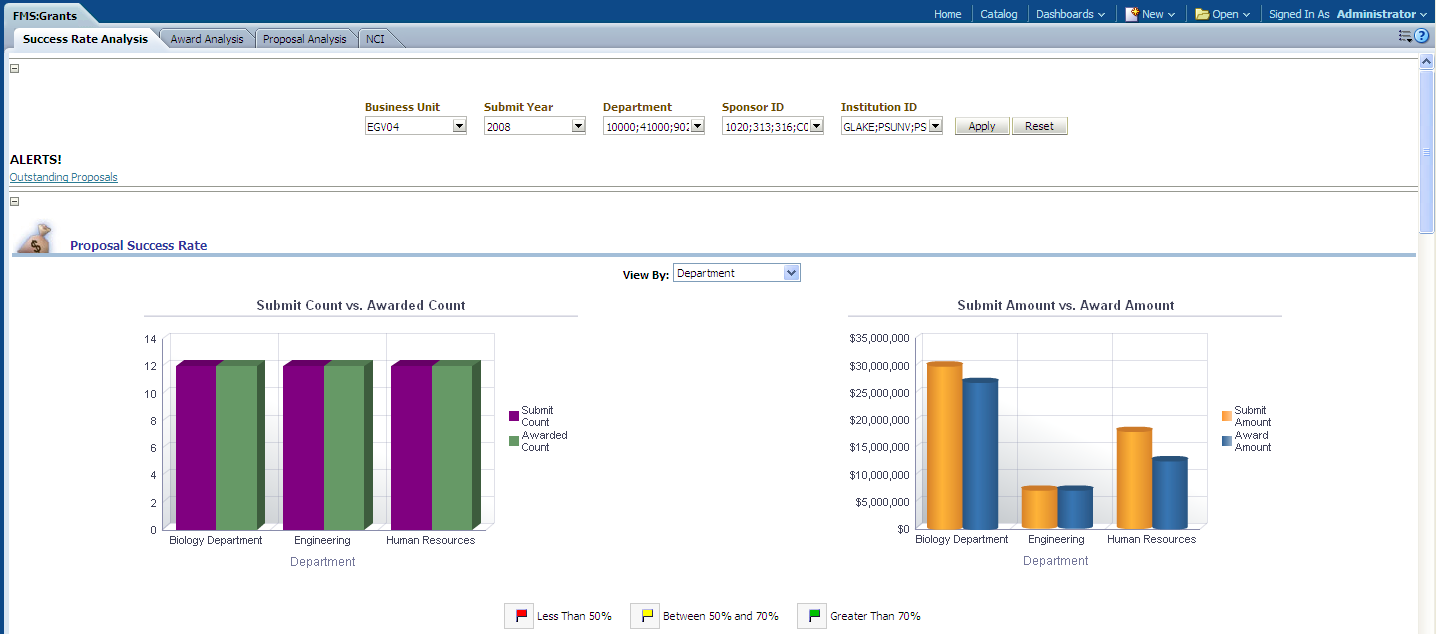
Use the Success Rate Analysis page to provides you with an overview of proposal success rate, outstanding proposals, and success rate trends
Image: Success Rate Analysis page
This example illustrates the fields and controls on the Success Rate Analysis page. You can find definitions for the fields and controls later on this page.
|
Usage |
Reports |
|---|---|
|
Provides you with an overview of proposal success rate, outstanding proposals, and success rate trends. |
This page is comprised of the following reports:
|
|
Dashboard Prompt |
Alerts |
|---|---|
|
Use the Success Rate Analysis page prompt to filter page results by:
|
Displays a link to any proposal that is currently outstanding. |
Proposal Success Rate Report
Use the Proposal Success Rate report, which enables you to analyze awarded proposals and amounts against total proposals submitted and amounts requested.
Image: Proposal Success Rate report, part 1
This example illustrates the fields and controls on the Proposal Success Rate report, part 1. You can find definitions for the fields and controls later on this page.
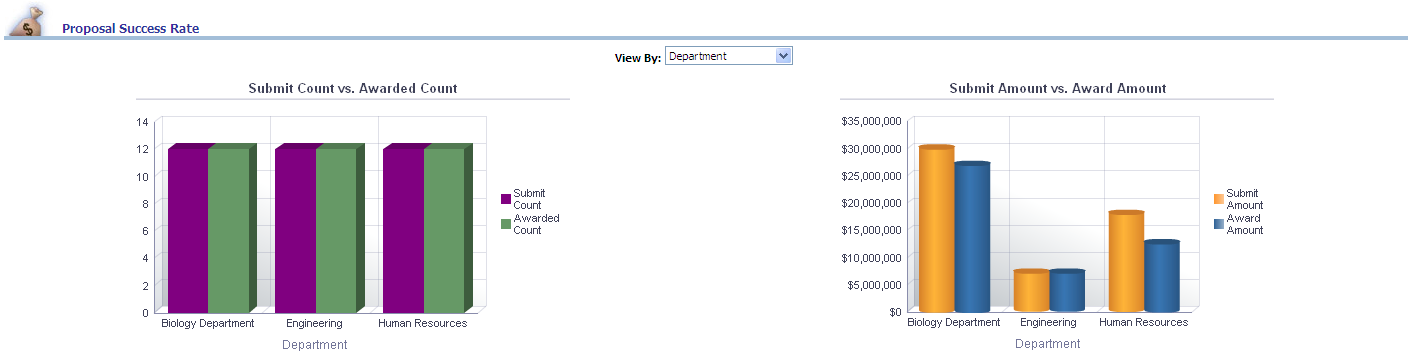
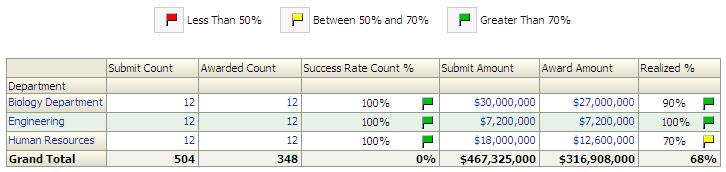
Image: Proposal Success Rate report, part 2
This example illustrates the fields and controls on the Proposal Success Rate report, part 2. You can find definitions for the fields and controls later on this page.
|
X,Y Axis Data Submit Count vs. Awarded Count |
X,Y Axis Data Submit Amount vs. Award Amount |
View By Filter |
|---|---|---|
|
The Submit Count vs. Awarded Count graph displays department data on the x-axis and submit count and award count data on the y-axis. The x-axis can also plot any of the following dimensions, depending on your View By filter selection:
|
The Submit Amount vs. Award Amount graph displays department data on the x-axis and submit amount and award amount data on the y-axis. The x-axis can also plot any of the following dimensions, depending on your View By filter selection:
|
Use this filter to view the Proposal Success Rate report results by:
|
|
Report Column / Measure Name |
Report Column / Measure Origin |
|---|---|
|
Institution |
Grants Management Institution (D_GM_INST) Dimension |
|
Department |
Department (D_DEPT) Dimension |
|
Principal Investigator |
Grants Management Principal Investigator (D_GM_PI) Dimension |
|
Sponsor |
Sponsor (D_GM_SPONSOR) Dimension |
|
Submit Count |
Proposal Award Summary (F_GM_PRP_AWD) Fact |
|
Awarded Count |
Proposal Award Summary (F_GM_PRP_AWD) Fact |
|
Submit Amount |
Proposal Award Summary (F_GM_PRP_AWD) Fact |
|
Award Amount |
Proposal Award Summary (F_GM_PRP_AWD) Fact |
|
Success Rate Count % |
"Fact GM Proposal Award Summary"."Awarded Count" / "Fact GM Proposal Award Summary"."Submit Count" * 100 |
|
Realized % |
"Fact GM Proposal Award Summary"."Total award amt - Sponsor" / ("Fact GM Proposal Award Summary"."Sponsor Direct Amount" + "Fact GM Proposal Award Summary"."Sponsor F&A Amount") * 100 |
Proposal Success Rate by PI Report
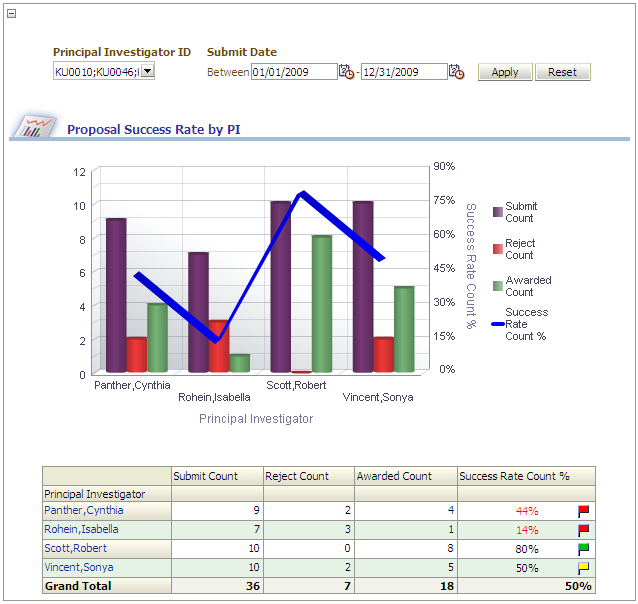
Use the Proposal Success Rate by PI report, which enables you to analyze the performance of principal investigators by measuring proposal submissions against those rejected and awarded.
Image: Proposal Success Rate by PI report
This example illustrates the fields and controls on the Proposal Success Rate by PI report. You can find definitions for the fields and controls later on this page.
|
X,Y Axis Data |
View By Filter |
|---|---|
|
The Proposal Success Rate by PI graph displays Principal Investigator data on the x-axis and Submit Count, Reject Count, and Awarded Count data on the y-axis, with Success Rate Count % data plotted across the x/y-axis. |
Use the Proposal Success Rate dashboard prompt to filter the report results by:
|
|
Report Column / Measure Name |
Report Column / Measure Origin |
|---|---|
|
Principal Investigator |
Grants Management Principal Investigator (D_GM_PI) Dimension |
|
Submit Count |
Proposal Award Summary (F_GM_PRP_AWD) Fact |
|
Reject Count |
Proposal Award Summary (F_GM_PRP_AWD) Fact |
|
Awarded Count |
Proposal Award Summary (F_GM_PRP_AWD) Fact |
|
Success Rate Count % |
"Fact GM Proposal Award Summary"."Awarded Count" / "Fact GM Proposal Award Summary"."Submit Count" * 100 |
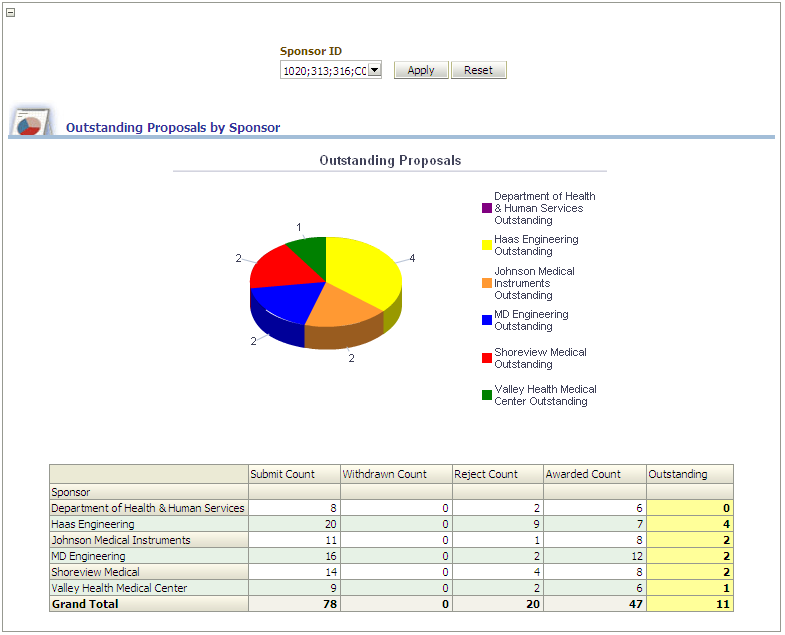
Outstanding Proposals by Sponsor Report
Use the Outstanding Proposals by Sponsor report, which enables you to analyze the status of outstanding proposals by sponsor.
Image: Outstanding Proposals by Sponsor report
This example illustrates the fields and controls on the Outstanding Proposals by Sponsor report. You can find definitions for the fields and controls later on this page.
|
Pie Chart Data |
Sponsor ID Filter |
|---|---|
|
The Outstanding Proposals pie chart displays outstanding proposals data grouped by Sponsor. |
Use this filter to view report results by a specific sponsor. |
|
Report Column / Measure Name |
Report Column / Measure Origin |
|---|---|
|
Sponsor |
Sponsor (D_GM_SPONSOR) Dimension |
|
Submit Count |
Proposal Award Summary (F_GM_PRP_AWD) Fact |
|
Withdrawn Count |
Proposal Award Summary (F_GM_PRP_AWD) Fact |
|
Reject Count |
Proposal Award Summary (F_GM_PRP_AWD) Fact |
|
Awarded Count |
Proposal Award Summary (F_GM_PRP_AWD) Fact |
|
Outstanding (proposals) |
"Fact GM Proposal Award Summary"."Submit Count"-"Fact GM Proposal Award Summary"."Reject Count"-"Fact GM Proposal Award Summary"."Withdrawn Count"-"Fact GM Proposal Award Summary"."Awarded Count" |
Success Rate Trend Report
Use the Success Rate Trend report, which enables you to measure proposal submissions against those awarded by year, sponsor, institution, department, or principal investigator.
Image: Success Rate Trend report, part 1
This example illustrates the fields and controls on the Success Rate Trend report, part 1. You can find definitions for the fields and controls later on this page.
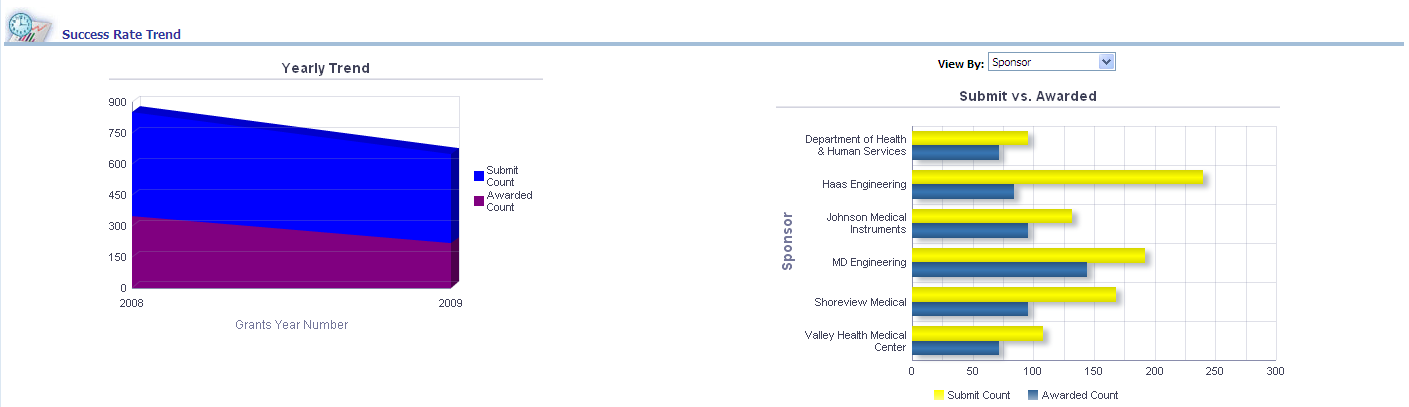
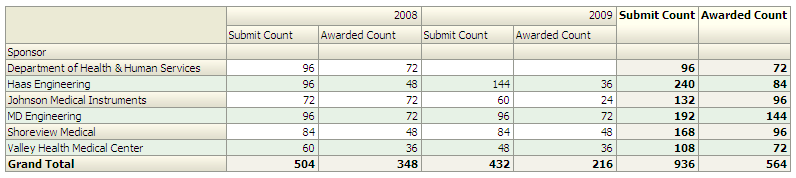
Image: Success Rate Trend report, part 1
This example illustrates the fields and controls on the Success Rate Trend report, part 1. You can find definitions for the fields and controls later on this page.
|
X,Y Axis Data Yearly Trend |
X,Y Axis Data Submit vs. Awarded |
View By Filter |
|---|---|---|
|
The Yearly Trend graph displays grant-year data on the x-axis and Submit Count and Awarded Count data on the y-axis. |
The Submit vs. Awarded graph displays Submit Count and Awarded Count data on the x-axis and Sponsor data on the y-axis. The y-axis can also plot any of the following dimensions, depending on your View By filter selection:
|
Use this filter to view the Submit vs. Awarded graph results by:
|
|
Report Column / Measure Name |
Report Column / Measure Origin |
|---|---|
|
Grant-Year (Fiscal Year) |
Day (D_DAY) Dimension |
|
Institution |
Grants Management Institution (D_GM_INST) Dimension |
|
Department |
Department (D_DEPT) Dimension |
|
Principal Investigator |
Grants Management Principal Investigator (D_GM_PI) Dimension |
|
Sponsor |
Sponsor (D_GM_SPONSOR) Dimension |
|
Submit Count |
Proposal Award Summary (F_GM_PRP_AWD) Fact |
|
Withdrawn Count |
Proposal Award Summary (F_GM_PRP_AWD) Fact |
|
Reject Count |
Proposal Award Summary (F_GM_PRP_AWD) Fact |
|
Awarded Count |
Proposal Award Summary (F_GM_PRP_AWD) Fact |