Using the Recruitment Analysis Dashboard - Recruiting Effectiveness Page
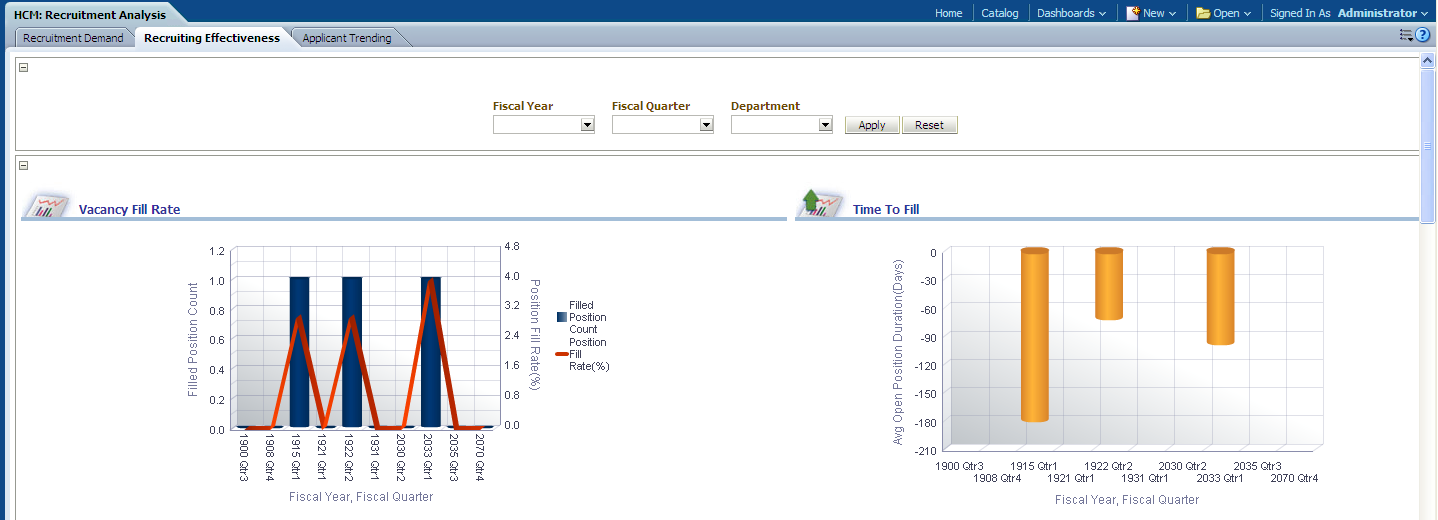
Use the Recruiting Effectiveness page to provide you with an overview of recruiting effectiveness metrics for your organization, including vacancy fill rates, time to fill analysis, and recruiting source effectiveness.
Image: Recruiting Effectiveness page
This example illustrates the fields and controls on the Recruiting Effectiveness page. You can find definitions for the fields and controls later on this page.
|
Usage |
Reports |
Dashboard Prompt |
|---|---|---|
|
Provides you with an overview of recruiting effectiveness metrics for your organization, including vacancy fill rates, time to fill analysis, and recruiting source effectiveness. |
This page is comprised of the following reports:
|
Use the Recruiting Effectiveness page prompt to filter page results by:
|
Vacancy Fill Rate Report
Use the Vacancy Fill Rate report, which enables you to analyze vacancy fill rates for your organization and view details about job openings count, hire count, and job fill rate percentage.
Image: Vacancy Fill Rate report
This example illustrates the fields and controls on the Vacancy Fill Rate report. You can find definitions for the fields and controls later on this page.
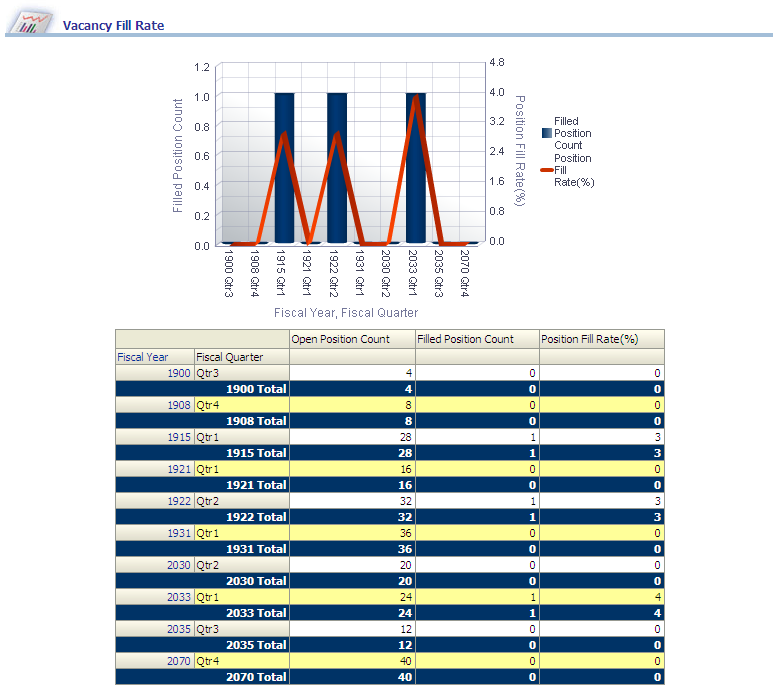
The Vacancy Fill Rate graph displays Fiscal Year, Fiscal Quarter data on the x-axis and Filled Position Count and Position Fill Rate data on the y-axis.
|
Report Column / Measure Name |
Report Column / Measure Origin |
|---|---|
|
Department |
Department (D_DEPT) Dimension |
|
Fiscal Year |
Day (D_DAY) Dimension |
|
Fiscal Quarter |
Day (D_DAY) Dimension |
|
Open Position Count |
Recruitment (F_RCMNT) Fact |
|
Filled Position Count |
Recruitment (F_RCMNT) Fact |
|
Position Fill Rate (%) |
("Fact Recruitment"."Hire Count") /("Fact Job Opening"."Job Openings Count") * 100 |
Time to Fill Report
Use the Time to Fill report, which enables you to analyze the time it takes for various departments in your organization to fill a job opening.
Image: Time to Fill report
This example illustrates the fields and controls on the Time to Fill report. You can find definitions for the fields and controls later on this page.
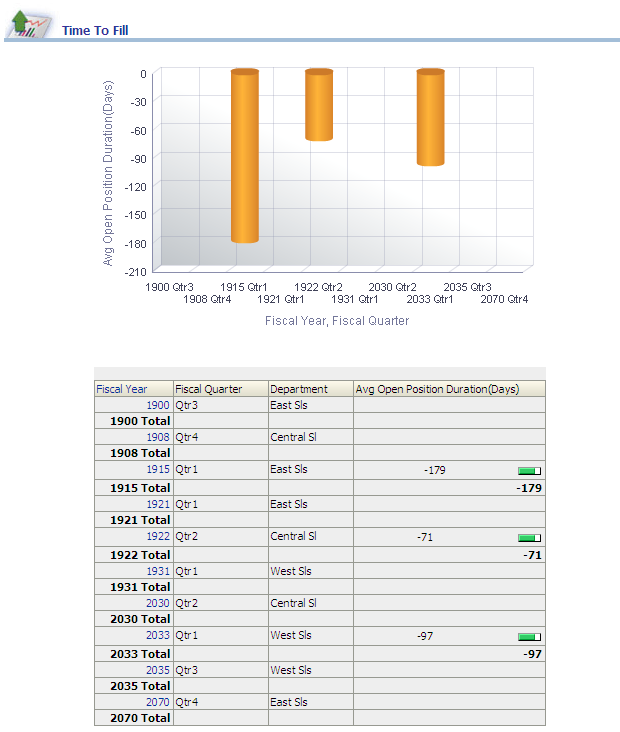
The Time to Fill graph displays Fiscal Year, Fiscal Quarter data on the x-axis and Average Open Position Duration (Days) data on the y-axis.
|
Report Column / Measure Name |
Report Column / Measure Origin |
|---|---|
|
Department |
Department (D_DEPT) Dimension |
|
Fiscal Year |
Day (D_DAY) Dimension |
|
Fiscal Quarter |
Day (D_DAY) Dimension |
|
Average Open Position Duration (Days) |
Recruitment (F_RCMNT) Fact: CASE WHEN Dimension Recruitment Status Reason.Recruitment Area Code = '3' AND Dimension Recruitment Status Reason.Recruitment Status Code IN ('090','100','110','120') THEN ( "Dimension Day Entry Date"."Entry Day Date"-"Dimension Day Status Date"."Status Day Date" ) ELSE NULL END |
Recruiting Source Effectiveness Report
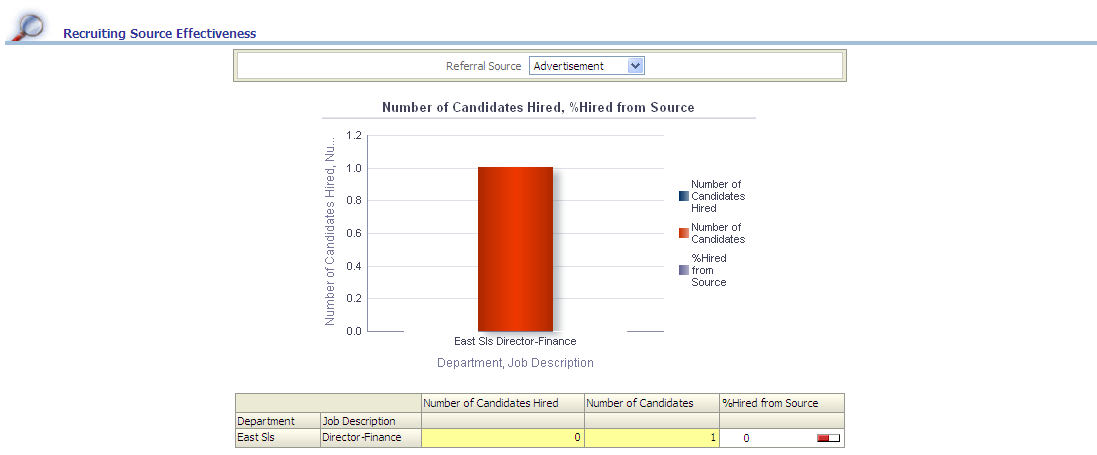
Use the Recruiting Source Effectiveness report, which enables you to analyze the effectiveness of your organization's recruiting sources and view details about the number of candidates hired by department, job, referral source and referral source percentage.
Image: Recruiting Source Effectiveness report
This example illustrates the fields and controls on the Recruiting Source Effectiveness report. You can find definitions for the fields and controls later on this page.
|
X,Y Axis Data |
Referral Source Filter |
|---|---|
|
The Recruiting Source Effectiveness graph displays Department and Job Description data on the x-axis and Number of Candidates, Number of Candidates Hired and % Hired from Source data on the y-axis. |
Use this filter to view report results by the following referral sources:
|
|
Report Column / Measure Name |
Report Column / Measure Origin |
|---|---|
|
Department |
Department (D_DEPT) Dimension |
|
Fiscal Year |
Day (D_DAY) Dimension |
|
Fiscal Quarter |
Day (D_DAY) Dimension |
|
Job Code |
Employee Job Code (D_EMPL_JOB) Dimension |
|
Referral Source Category Description |
Referral Source Category (D_REF_SRC_CAT) Dimension |
|
Number of Candidates |
Recruitment (F_RCMNT) Fact |
|
Number of Candidates Hired |
Recruitment (F_RCMNT) Fact |
|
% Hired from Source |
("Fact Recruitment"."Hire Count"/"Fact Recruitment"."Applicant Headcount")*100 |
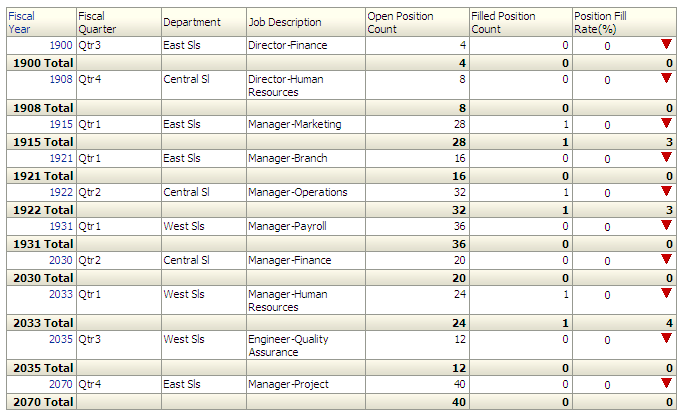
Vacancy Fill Rate Details Report
Use the Vacancy Fill Rate Details report, which enables you to analyze job vacancy fill rates for various departments in your organization and view details about job openings count, hire count, and job fill rate percentage.
Image: Vacancy Fill Rate Details report, part 1
This example illustrates the fields and controls on the Vacancy Fill Rate Details report, part 1. You can find definitions for the fields and controls later on this page.
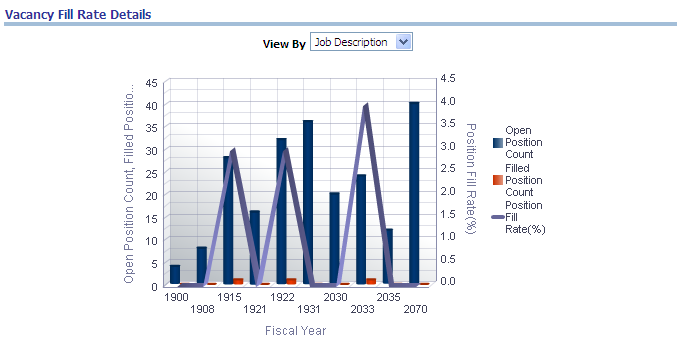
Image: Vacancy Fill Rate Details report, part 2
This example illustrates the fields and controls on the Vacancy Fill Rate Details report, part 2. You can find definitions for the fields and controls later on this page.
|
X,Y Axis Data |
View By Filter |
|---|---|
|
The Vacancy Fill Rate Details graph displays Fiscal Year data on the x-axis and Open Position Count, Filled Position Count and Position Fill Rate data on the y-axis. |
Use this filter to view report results by:
|
|
Report Column / Measure Name |
Report Column / Measure Origin |
|---|---|
|
Fiscal Year |
Day (D_DAY) Dimension |
|
Fiscal Quarter |
Day (D_DAY) Dimension |
|
Department |
Department (D_DEPT) Dimension |
|
Location |
Location (D_LOCATION) Dimension |
|
Job Description |
Employee Job Code (D_EMPL_JOB) Dimension |
|
Job Family Description |
Employee Job Code (D_EMPL_JOB) Dimension |
|
Grade |
Employee Job Code (D_EMPL_JOB) Dimension |
|
Filled Position Count |
Recruitment (F_RCMNT) Fact |
|
Open Position Count |
Recruitment (F_RCMNT) Fact |
|
Position Fill Rate (%) |
("Fact Recruitment"."Hire Count") /("Fact Job Opening"."Job Openings Count") * 100 |
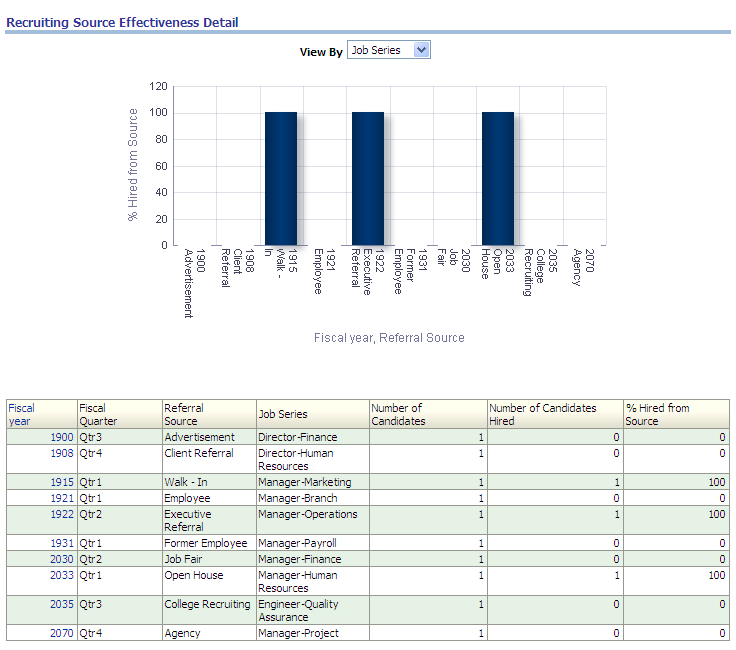
Recruiting Source Effectiveness Detail Report
Use the Recruiting Source Effectiveness Detail report, which enables you to analyze recruiting source effectiveness for your organization.
Image: Recruiting Source Effectiveness Detail report
This example illustrates the fields and controls on the Recruiting Source Effectiveness Detail report. You can find definitions for the fields and controls later on this page.
|
X,Y Axis Data |
View By Filter |
|---|---|
|
The Recruiting Source Effectiveness Detail graph displays Fiscal Year and Referral Source data on the x-axis and Percent Hired from Source data on the y-axis. |
Use this filter to view report results by:
|
|
Report Column / Measure Name |
Report Column / Measure Origin |
|---|---|
|
Fiscal Year |
Day (D_DAY) Dimension |
|
Fiscal Quarter |
Day (D_DAY) Dimension |
|
Job Code |
Employee Job Code (D_EMPL_JOB) Dimension |
|
Referral Source Category Description |
Referral Source Category (D_REF_SRC_CAT) Dimension |
|
Hire Count |
Recruitment (F_RCMNT) Fact |
|
Applicant Head Count |
Recruitment (F_RCMNT) Fact: |
|
% Hired from Source |
Fact Recruitment.Hire Count / Fact Recruitment.Applicant Head Count * 100 |