Using the Recruitment Analysis Dashboard - Recruitment Demand Page
Use the Recruitment Demand page to provide you with an overview of recruiting metrics for your organization, including open positions and hiring demand counts analysis.
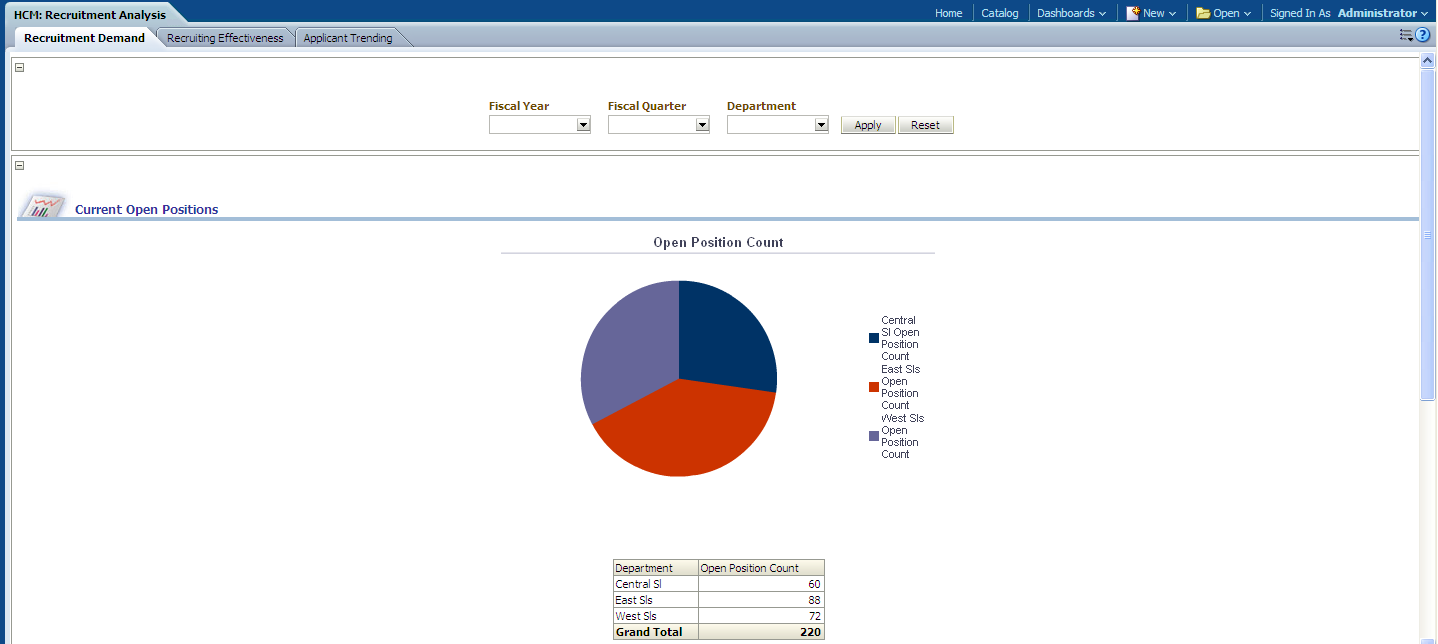
Image: Recruitment Demand page
This example illustrates the fields and controls on the Recruitment Demand page. You can find definitions for the fields and controls later on this page.
|
Usage |
Reports |
Dashboard Prompt |
|---|---|---|
|
Provides you with an overview of recruiting metrics for your organization, including open positions and hiring demand counts analysis. |
This page is comprised of the following reports:
|
Use the Recruitment Demand page prompt to filter page results by:
|
Current Open Positions Report
Use the Current Open Positions report, which enables you to analyze current open positions within your organization by individual department.
Image: Current Open Positions report
This example illustrates the fields and controls on the Current Open Positions report. You can find definitions for the fields and controls later on this page.
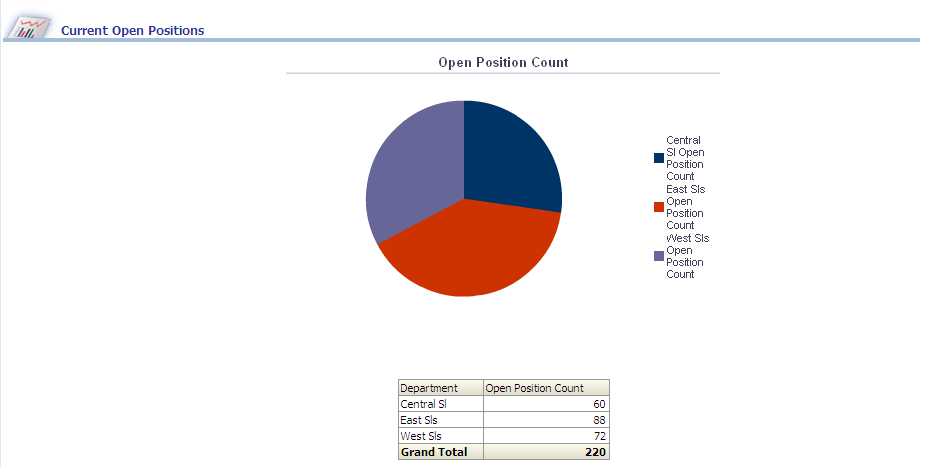
The pie chart displays open position count percentage grouped by department.
|
Report Column / Measure Name |
Report Column / Measure Origin |
|---|---|
|
Fiscal Year |
Day (D_DAY) Dimension |
|
Fiscal Quarter |
Day (D_DAY) Dimension |
|
Department |
Department (D_DEPT) Dimension |
|
Open Position Count |
Recruitment (F_RCMNT) Fact |
Hiring Demand Analysis Report
Use the Hiring Demand Analysis report, which enables you to analyze hiring demands for your organization and view details of open position headcount by fiscal year, fiscal quarter, and department.
Image: Hiring Demand Analysis report
This example illustrates the fields and controls on the Hiring Demand Analysis report. You can find definitions for the fields and controls later on this page.
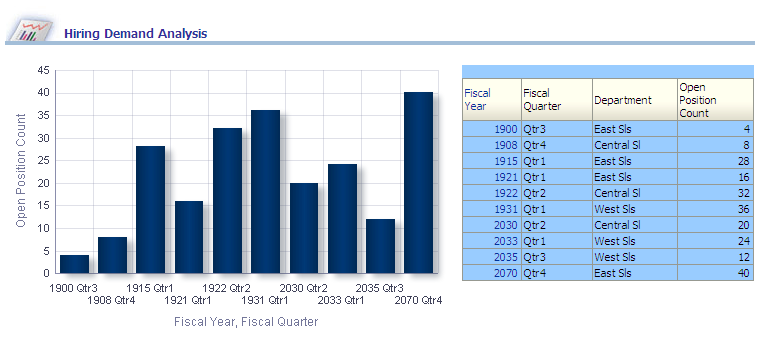
The Hiring Demand Analysis graph displays Fiscal Year, Fiscal Quarter data on the x-axis and Open Position Count data on the y-axis.
|
Report Column / Measure Name |
Report Column / Measure Origin |
|---|---|
|
Fiscal Year |
Day (D_DAY) Dimension |
|
Fiscal Quarter |
Day (D_DAY) Dimension |
|
Department |
Department (D_DEPT) Dimension |
|
Open Position Count |
Recruitment (F_RCMNT) Fact |
Hiring Demand Surge Details Report
Use the Hiring Demand Surge Details report, which enables you to analyze hiring demands for an organization and view details of open position headcount by fiscal year, fiscal quarter, department, region, and job description.
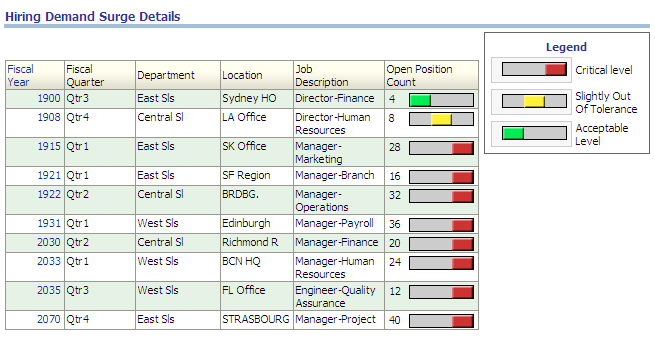
Image: Hiring Demand Surge Details report
This example illustrates the fields and controls on the Hiring Demand Surge Details report. You can find definitions for the fields and controls later on this page.
|
Report Column / Measure Name |
Report Column / Measure Origin |
|---|---|
|
Fiscal Year |
Day (D_DAY) Dimension |
|
Fiscal Quarter |
Day (D_DAY) Dimension |
|
Location |
Location (D_LOCATION) Dimension |
|
Job Code |
Employee Job Code (D_EMPL_JOB) Dimension |
|
Department |
Department (D_DEPT) Dimension |
|
Open Position Count |
Recruitment (F_RCMNT) Fact |