Using the Spend Page
Use the Spend page to provide an overview of spending by commodity, supplier and organization.
Image: Spend page
This example illustrates the fields and controls on the Spend page. You can find definitions for the fields and controls later on this page.

|
Usage |
Reports |
Dashboard Prompt |
|---|---|---|
|
Provides an overview of spending by commodity, supplier and organization. |
This dashboard is comprised of the following reports:
|
Use the Spend dashboard prompt to filter dashboard results by:
|
Commodity Spend Analysis Report
Use the Commodity Spend Analysis report, which provides you with information about the goods and services your organization has purchased, including Total Commodity Spend, Percent of Total, and Invoice Count measures.
Image: Commodity Spend Analysis report
This example illustrates the fields and controls on the Commodity Spend Analysis report. You can find definitions for the fields and controls later on this page.
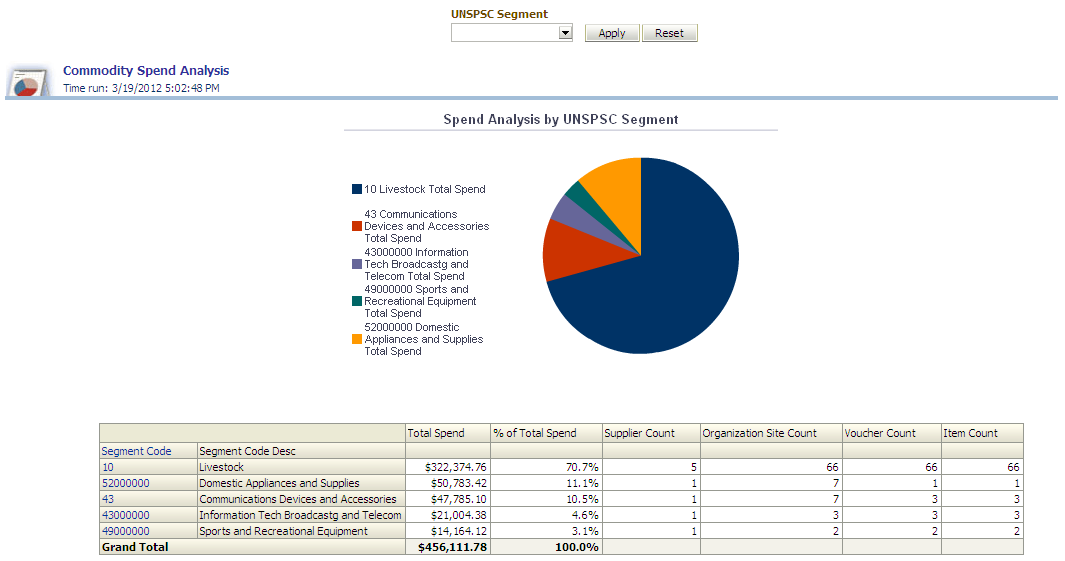
The pie chart displays total commodity spend data grouped by UNSPSC Segment, which can be toggled using the UNSPSC Segment prompt.
You can click on a pie slice to drill down to individual segment-level data.
Supplier Spend Analysis Report
Use the Supplier Spend Analysis report, which provides you with information about the suppliers your organization uses to purchase goods and services, and includes measures such as Total Supplier Spend, Percent of Total, and Buyer Count.
Image: Supplier Spend Analysis report
This example illustrates the fields and controls on the Supplier Spend Analysis report. You can find definitions for the fields and controls later on this page.
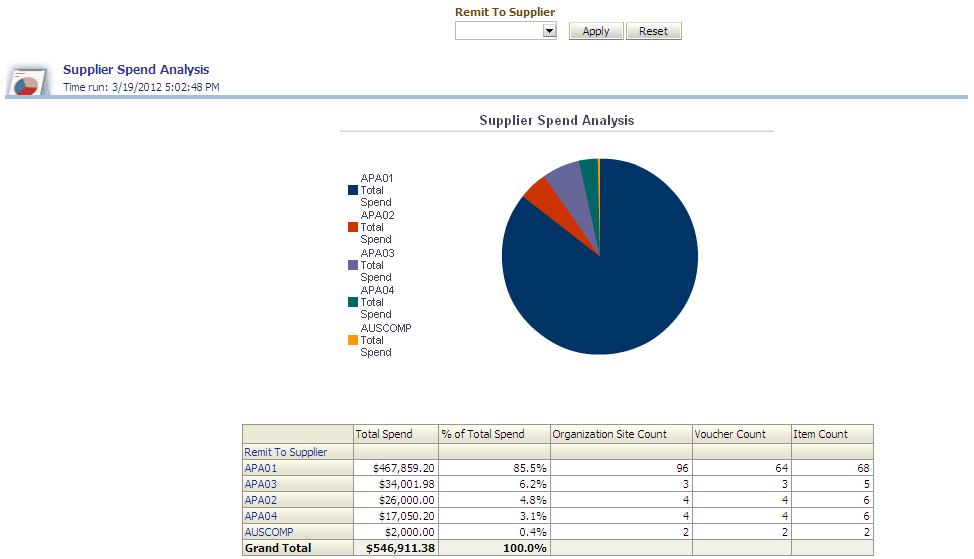
The pie chart displays total supplier spend data grouped by Remit to Supplier, which can be toggled using the Remit to Supplier prompt.
You can click on a pie slice to drill down to individual supplier-level data.
Organization Spend Analysis Report
Use the Organization Spend Analysis report, which provides total expenditure information for goods and services for your organization.
Image: Organization Spend Analysis report
This example illustrates the fields and controls on the Organization Spend Analysis report. You can find definitions for the fields and controls later on this page.
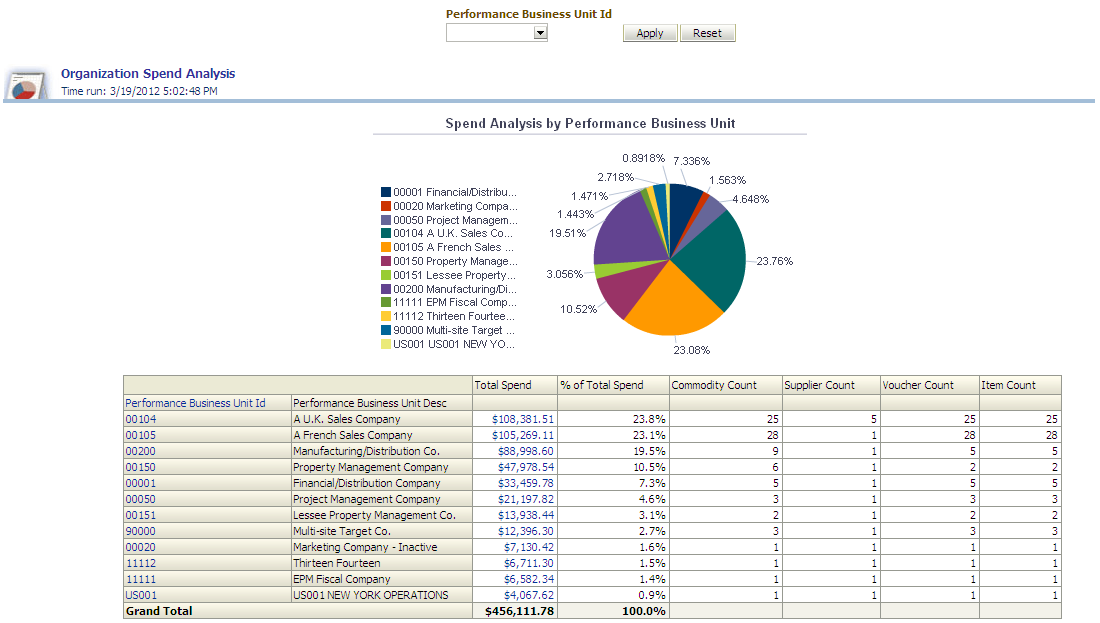
The pie chart displays total organization spend data grouped by Performance Business Unit, which can be toggled using the Performance Business Unit ID prompt.
You can click on a pie slice to drill down to individual business unit level data.