Using the Support Cases Page
Use the Support Cases page to provide analysis of support cases over a period of time using various measures.
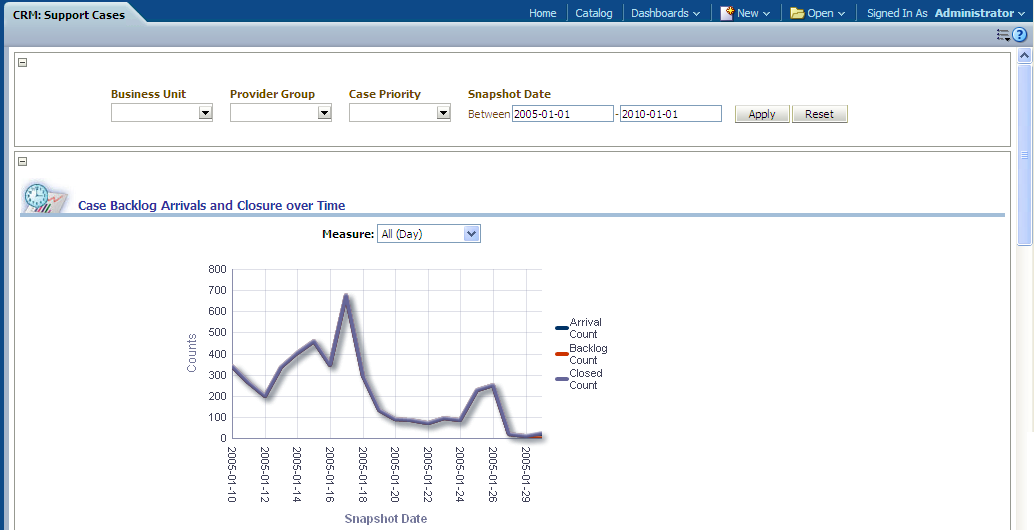
Image: CRM: Support Cases Dashboard
This example illustrates the fields and controls on the CRM: Support Cases Dashboard. You can find definitions for the fields and controls later on this page.
|
Usage |
Reports |
Dashboard Prompt |
|---|---|---|
|
Provides analysis of support cases over a period of time using various measures. |
This page is comprised of the following reports:
|
Use the Support Cases page prompt to filter page results by:
|
Case Backlog Arrivals and Closure over Time Report
Use the Case Backlog Arrivals and Closure over Time Report to to monitor the case arrival, case closure, and case backlog over time, as well as helping managers to identify the Provider Groups with the highest backlog, arrivals and closures and their priority distribution in the given business units.
Image: Case Backlog Arrivals and Closure over Time report
This example illustrates the fields and controls on the Case Backlog Arrivals and Closure over Time report. You can find definitions for the fields and controls later on this page.
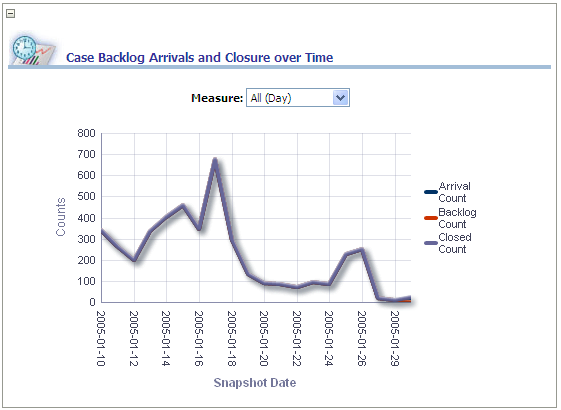
This report allows managers to monitor the case arrival, case closure, and case backlog over time, as well as helping managers to identify the Provider Groups with the highest backlog, arrivals and closures and their priority distribution in the given business units.
|
X,Y Axis Data |
Measure Filter |
|---|---|
|
The Case Backlog Arrivals vs. Case Closures over Time graph displays Snapshot Date on the x-axis and Counts (Arrival Count, Backlog Count, and Closed Count) on the y-axis. The actual counts displayed are determined by the selection in the Measure filter. |
Use this filter to view report results by the following measures:
|
|
Report Column / Measure Name |
Report Column / Measure Origin |
|---|---|
|
Backlog Count |
Case Trend (F_CASE_TR) Fact Number of open cases + Number of cases on hold |
|
Closed Count |
Case Trend (F_CASE_TR) Fact Number of closed cases + Number of cancelled cases |
|
Arrival Count |
Case Trend (F_CASE_TR) Fact |
SLA Met vs. SLA Missed Report
Use the SLA Met vs. SLA Missed report , which allows managers to monitor overall compliance to Service Level Agreements (SLAs).
Image: SLA Met vs. SLA Missed report
This example illustrates the fields and controls on the SLA Met vs. SLA Missed report. You can find definitions for the fields and controls later on this page.
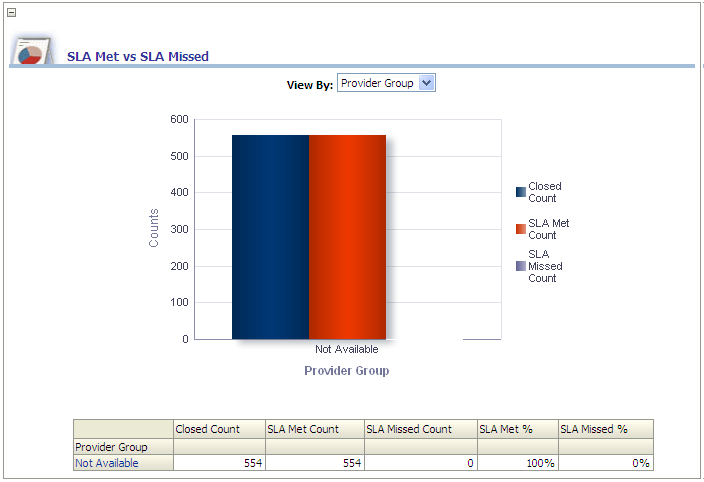
This report allows managers to monitor overall compliance to Service Level Agreements (SLAs). This metric provides insight into how provider groups and agents are measuring up for the SLA restore time goals.
|
X,Y Axis Data |
View By Filter |
|---|---|
|
The SLA Met vs. SLA Missed graph displays Provider Group on the x-axis and Closed Count, SLA Met Count, and SLA Missed Count on the y-axis. The x-axis can also display Priority or Business Unit, depending on your View By filter selection. |
Use this filter to view report results by the following program types:
|
|
Report Column / Measure Name |
Report Column / Measure Origin |
|---|---|
|
Closed Count |
Case Trend (F_CASE_TR) Fact Number of closed cases + Number of cancelled cases |
|
SLA Met |
Case Trend (F_CASE_TR) Fact |
|
SLA Missed |
Case Trend (F_CASE_TR) Fact |
|
SLA Met % |
(SLA Met / Cases Closed) * 100 |
|
SLA Missed % |
(SLA Missed / Cases Closed) * 100 |
|
Provider Group |
Provider Group (D_PROVIDER_GRP) Dimension |
|
Priority |
Case Priority (D_CASE_PRIORITY) Dimension |
|
Business Unit |
Business Unit (D_BUSINESS_UNIT) Dimension |
Average Time to Close Cases Report
Use the Average Time to Close Cases report to display the average number of days taken to close support cases by Provider Group, Agent, Priority and Business Unit
Image: Average Time to Close Cases report
This example illustrates the fields and controls on the Average Time to Close Cases report. You can find definitions for the fields and controls later on this page.
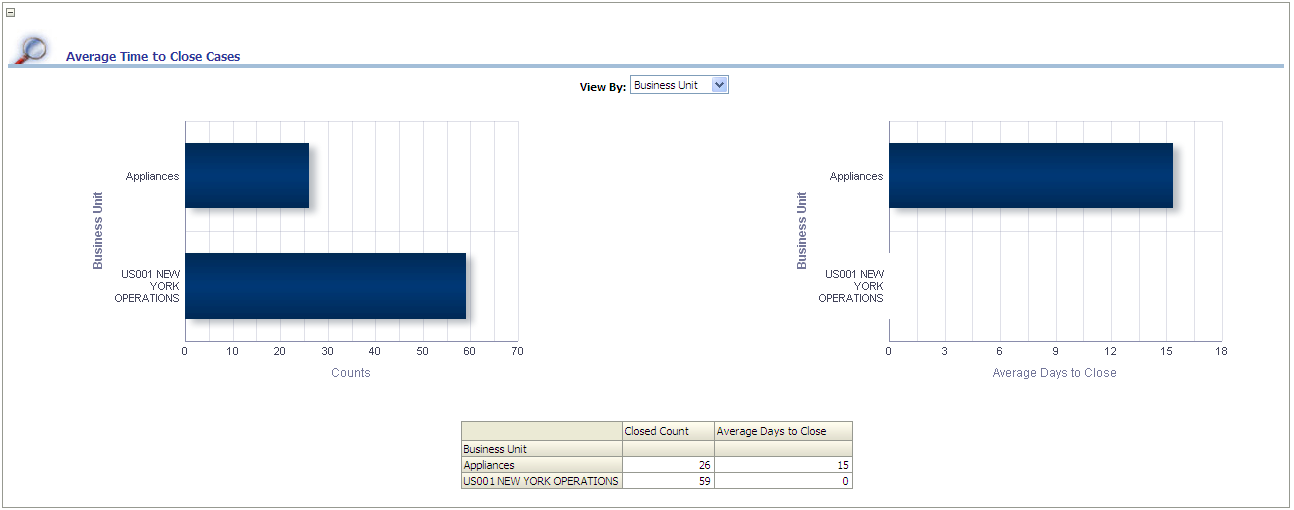
This report displays the average number of days taken to close support cases by Provider Group, Agent, Priority and Business Unit.
|
X,Y Axis Data for Bar Chart 1 |
X,Y Axis Data for Bar Chart 2 |
View By Filter |
|---|---|---|
|
The first graph displays Counts on the x-axis, and Business Unit on the y-axis. The x-axis can also display Priority or Business Unit, depending on your View By filter selection. |
The second graph displays Average Days to Close on the x-axis, and Business Unit on the y-axis. The x-axis can also display Priority or Business Unit, depending on your View By filter selection. |
Use this filter to view report results by the following program types:
|
|
Report Column / Measure Name |
Report Column / Measure Origin |
|---|---|
|
Provider Group |
Provider Group (D_PROVIDER_GRP) Dimension |
|
Priority |
Case Priority (D_CASE_PRIORITY) Dimension |
|
Business Unit |
Business Unit (D_BUSINESS_UNIT) Dimension |
|
Closed Count |
Case Trend (F_CASE_TR) Fact Number of closed cases + Number of cancelled cases |
|
Average Days to Close |
(Total number of days to close N cases) / N (where N is the number of closed cases) |
First Call Resolution Report
Use the First Call Resolution report (Dashboard, CRM: Support Cases, First Call Resolution).
Image: First Call Resolution report
This example illustrates the fields and controls on the First Call Resolution report. You can find definitions for the fields and controls later on this page.
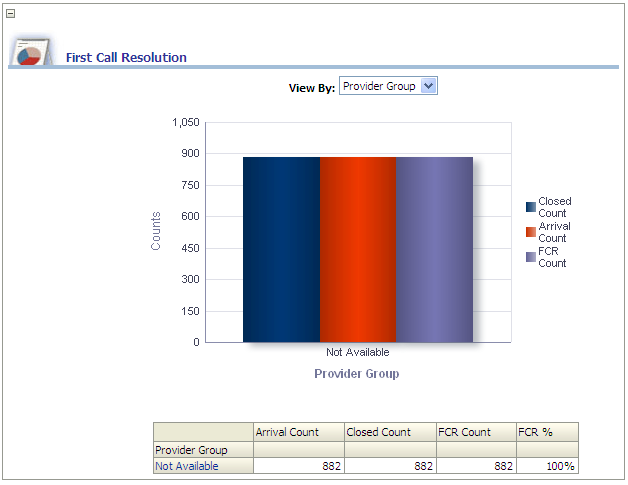
This report allows users to analyze the first call resolution rates for given Business Units, Provider Groups and their Agents, as well as helping managers understand if the first call resolution targets are being met for a given time period and what Provider Groups and Agents have the highest and lowest first call resolution rates.
|
X,Y Axis Data |
View By Filter |
|---|---|
|
The First Call Resolution graph displays Provider Group on the x-axis, and Closed Count, Arrival Count, and FCR Count on the y-axis. The x-axis can also display Priority or Business Unit, depending on your View By filter selection. |
Use this filter to view report results by the following program types:
|
|
Report Column / Measure Name |
Report Column / Measure Origin |
|---|---|
|
Provider Group |
Provider Group (D_PROVIDER_GRP) Dimension |
|
Priority |
Case Priority (D_CASE_PRIORITY) Dimension |
|
Business Unit |
Business Unit (D_BUSINESS_UNIT) Dimension |
|
Closed Count |
Case Trend (F_CASE_TR) Fact Number of closed cases + Number of cancelled cases |
|
Arrival Count |
Case Trend (F_CASE_TR) Fact |
|
FCR Count |
Case Trend (F_CASE_TR) Fact |
|
FCR % |
(FCR Count / (Closed Case count + Cancelled case count)) * 100 |