Using the Workforce Profile Dashboard - Contingent Workforce Analysis Page
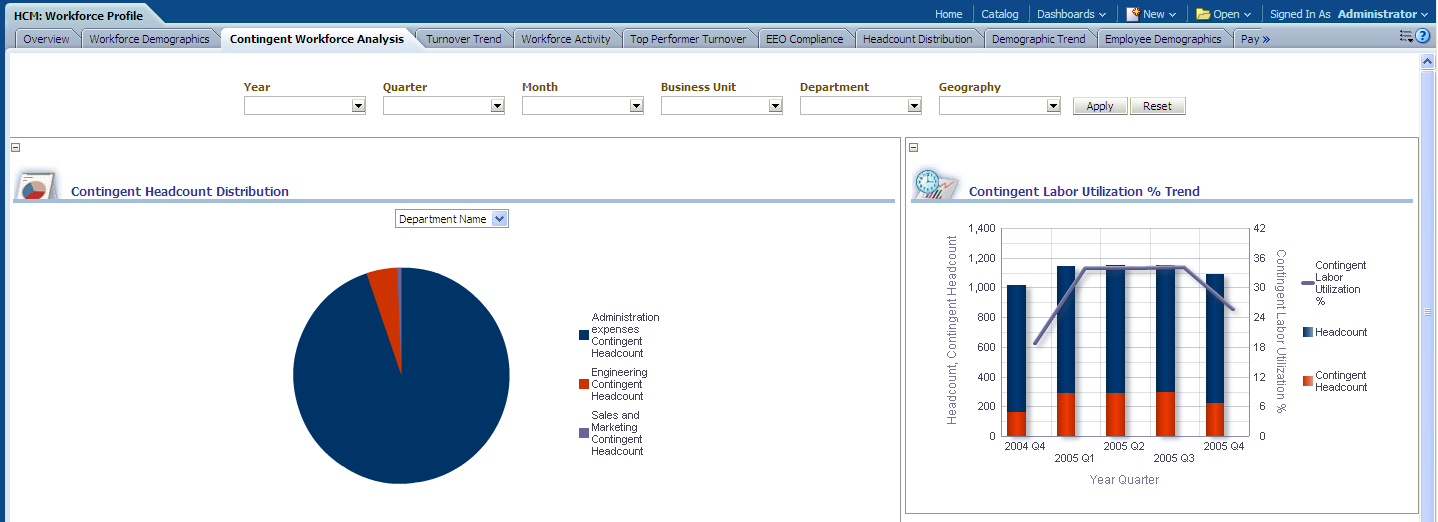
Use the Contingent Workforce Analysis page to provide an overview of contingent headcount distribution and labor utilization for your organization.
Image: Contingent Workforce Analysis page
This example illustrates the fields and controls on the Contingent Workforce Analysis page. You can find definitions for the fields and controls later on this page.
|
Usage |
Reports |
Dashboard Prompt |
|---|---|---|
|
Provides an overview of contingent headcount distribution and labor utilization for your organization. |
This page is comprised of the following reports:
|
Use the Contingent Workforce Analysis page prompt to filter page results by:
|
Contingent Headcount Distribution Report
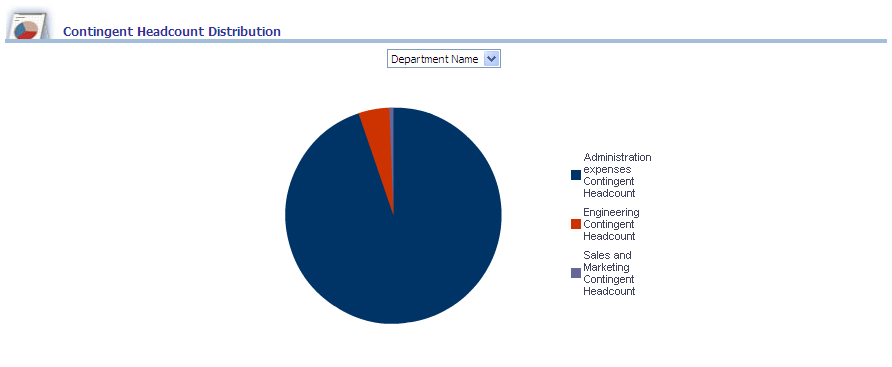
Use the Contingent Headcount Distribution report, which provides an overview of contingent headcount distribution by department, geography and job family.
Image: Contingent Headcount Distribution report
This example illustrates the fields and controls on the Contingent Headcount Distribution report. You can find definitions for the fields and controls later on this page.
|
Pie Chart Data |
View By Filter |
|---|---|
|
The Contingent Headcount Distribution pie chart displays Contingent Headcount data grouped by Department. Contingent headcount data can also be grouped by any of the following dimensions, depending on your View By filter selection:
Note: You can click on a pie slice to drill down to contingent headcount data for a particular dimension (such as geography). |
Use this filter to view report results by:
|
The following table lists the columns and measures used in the Contingent Headcount Distribution report.
|
Report Column / Measure Name |
Report Column / Measure Origin |
|---|---|
|
Department |
Department (D_DEPT) Dimension |
|
Geography |
Geography (D_GEOGRAPHY) Dimension |
|
Job Family Description |
Jobcode (D_JOBCODE) Dimension |
|
Contingent Headcount |
Workforce (F_WORKFORCE) Fact |
|
Headcount |
Workforce (F_WORKFORCE) Fact |
|
Total Headcount |
Workforce (F_WORKFORCE) Fact |
|
Contingent Labor Utilization (percent) |
Workforce (F_WORKFORCE) Fact: |
|
Total Contingent Labor Utilization (percent) |
Workforce (F_WORKFORCE) Fact: Contingent Headcount / Total Headcount |
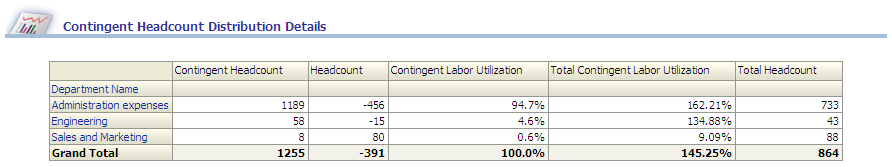
Contingent Headcount Distribution Details Report
Use the Contingent Headcount Distribution Details report, which provides a detailed analysis of contingent headcount distribution.
Image: Contingent Headcount Distribution Details report
This example illustrates the fields and controls on the Contingent Headcount Distribution Details report. You can find definitions for the fields and controls later on this page.
Contingent Labor Utilization % Trend Report
Use the Contingent Labor Utilization % Trend report, which details labor utilization percentages, headcount, and contingent headcount trends by quarter.
Image: Contingent Labor Utilization % Trend report
This example illustrates the fields and controls on the Contingent Labor Utilization % Trend report. You can find definitions for the fields and controls later on this page.
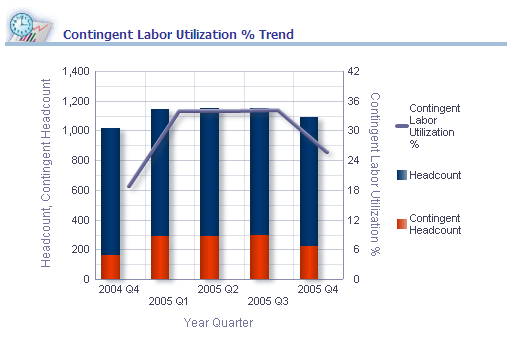
The Contingent Labor Utilization % Trend graph displays Year and Quarter data on the x-axis and Headcount, Contingent Headcount and Contingent Labor Utilization % data on the y-axis.
Note: You can click on graph data to review drill down data for a particular year and quarter.
|
Report Column / Measure Name |
Report Column / Measure Origin |
|---|---|
|
Year |
Day (D_DAY) Dimension |
|
Quarter |
Day (D_DAY) Dimension |
|
Contingent Headcount |
Workforce (F_WORKFORCE) Fact |
|
Headcount |
Workforce (F_WORKFORCE) Fact |
|
Contingent Labor Utilization % |
Workforce (F_WORKFORCE) Fact |