Demographic Trend Page
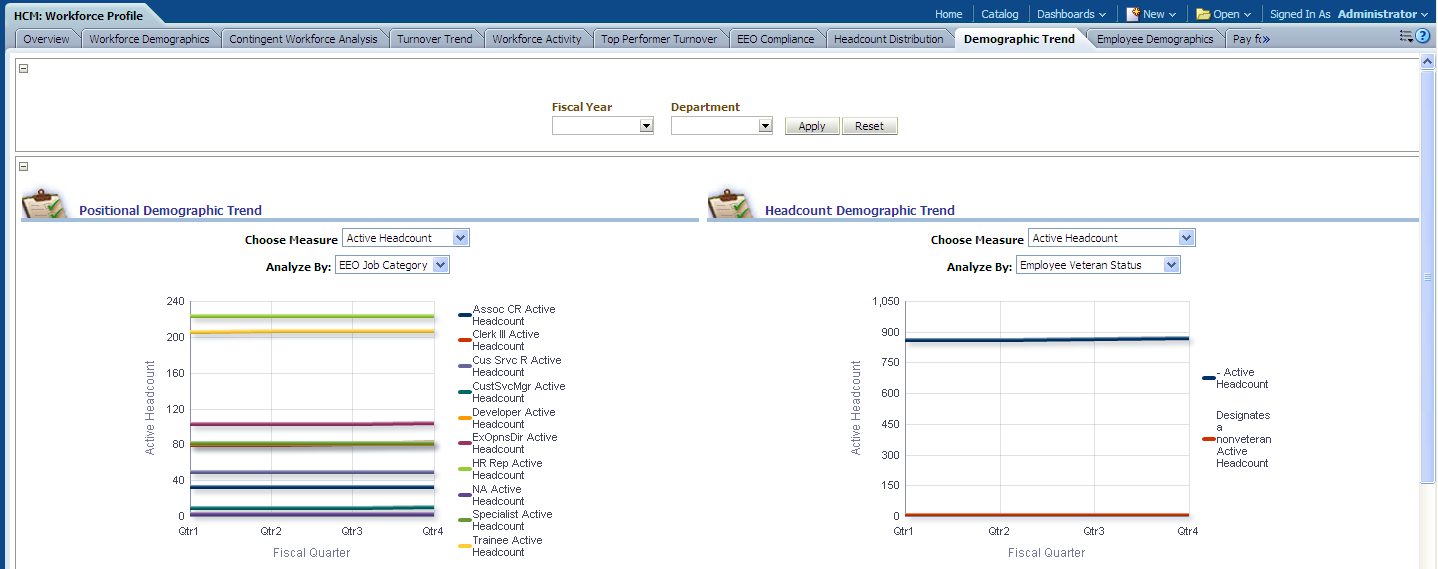
Use the Demographic Trend page (Dashboards, HCM: Human Capital Management, HCM: Workforce Profile, Demographic Trend).
Image: Demographic Trend page
This example illustrates the fields and controls on the Demographic Trend page. You can find definitions for the fields and controls later on this page.
|
Usage |
Reports |
Dashboard Prompt |
|---|---|---|
|
Provides an overview of demographic trends for your organization, by position and headcount. |
This page is comprised of the following reports:
|
Use the Demographic Trend page prompt to filter page results by:
|
Positional Demographic Trend Report
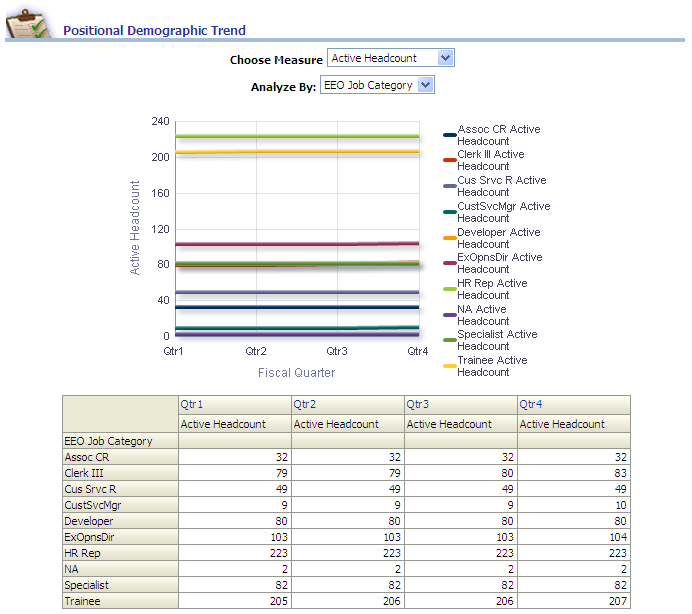
Use the Positional Demographic Trend report, which enables you to analyze active headcount, voluntary headcount, involuntary headcount, and promotions by various dimensions, such as pay grade and job category.
Image: Positional Demographic Trend report
This example illustrates the fields and controls on the Positional Demographic Trend report. You can find definitions for the fields and controls later on this page.
|
X,Y Axis Data |
Choose Measure |
Analyze By Filter |
|---|---|---|
|
The Positional Demographic Trend graph displays Fiscal Quarter data on the x-axis and Headcount data on the y-axis, with EEO Job Category data plotted across the x/y-axis. The y-axis can also display any of the following measures, depending on your Choose Measure filter selection:
The x/y-axis can also plot any of the following dimensions, depending on your Analyze By filter selection:
Note: You can click on graph data to review drill down data for a particular quarter. |
Use this filter to view report results by the following measures:
|
Use this filter to view report results by the following dimensions:
|
|
Report Column / Measure Name |
Report Column / Measure Origin |
|---|---|
|
Fiscal Quarter |
Day (D_DAY) Dimension |
|
Job Series |
Employee Job Code (D_EMPL_JOB) Dimension |
|
EEO Job Category |
Job Code (D_JOBCODE) Dimension |
|
Pay Grade |
Employee Job Code (D_EMPL_JOB) Dimension |
|
Number of Promotions (Promotion Count) |
Workforce (F_WORKFORCE) Fact |
|
Voluntary Count |
Workforce (F_WORKFORCE) Fact |
|
Involuntary Count |
Workforce (F_WORKFORCE) Fact |
|
Headcount |
Workforce (F_WORKFORCE) Fact |
Headcount Demographic Trend Report
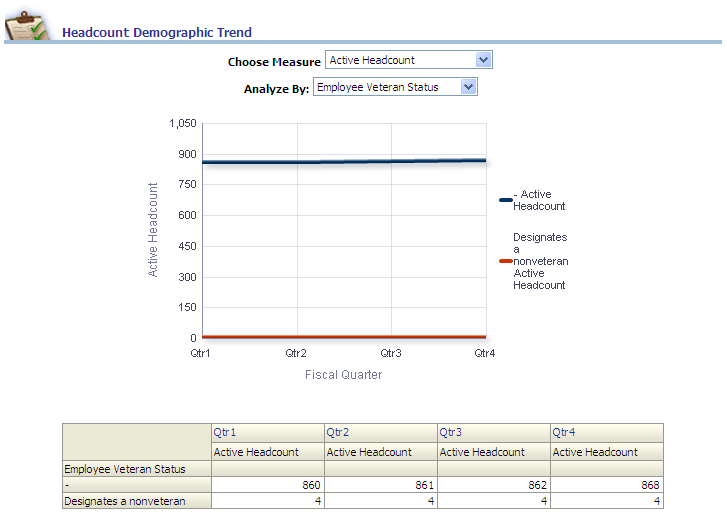
Use the Headcount Demographic Trend report, which enables you to analyze active headcount, voluntary headcount, involuntary headcount, and promotions by various dimensions, such as pay grade and job category.
Image: Headcount Demographic Trend report
This example illustrates the fields and controls on the Headcount Demographic Trend report. You can find definitions for the fields and controls later on this page.
|
X,Y Axis Data |
Choose Measure |
Analyze By Filter |
|---|---|---|
|
The Headcount Demographic Trend graph displays Fiscal Quarter data on the x-axis and Headcount data on the y-axis, with Employee Veteran Status data plotted across the x/y-axis. The y-axis can also display any of the following measures, depending on your Choose Measure filter selection:
The x/y-axis can also plot any of the following dimensions, depending on your Analyze By filter selection:
Note: You can click on the data in the graph to review drill down data for a particular quarter. |
Use this filter to view report results by the following measures:
|
Use this filter to view report results by the following dimensions:
|
|
Report Column / Measure Name |
Report Column / Measure Origin |
|---|---|
|
Fiscal Quarter |
Day (D_DAY) Dimension |
|
Age |
Person (D_PERSON) Dimension |
|
Employee High Potential Flag |
This flag uses a Y or N value, based on Higher Education Level (HI_EDU_LVL_CD) values, which include:
If HI_EDU_LVL_CD value = J, K or L, then Employee High Potential Flag is set to Y. Otherwise, the flag is set to N. |
|
Employee Marital Status |
Person (D_PERSON) Dimension |
|
Gender |
Person (D_PERSON) Dimension |
|
Employee Citizenship |
Person (D_PERSON) Dimension |
|
Employee Disability |
Person (D_PERSON) Dimension |
|
Security Clearance Level |
Position (D_POS) Dimension |
|
Ethnic Group |
Person (D_PERSON) Dimension |
|
Veterans Preference Code |
Person (D_PERSON) Dimension |
|
Employee Veteran Status |
Person (D_PERSON) Dimension |
|
Voluntary Count |
Workforce (F_WORKFORCE) Fact |
|
Involuntary Count |
Workforce (F_WORKFORCE) Fact |
|
Headcount |
Workforce (F_WORKFORCE) Fact |
|
Number of Promotions (Promotion Count) |
Workforce (F_WORKFORCE) Fact |
|
Dissatisfied Termination Ratio |
Workforce (F_WORKFORCE) Fact: (If F_WORKFORCE.TERMINATE_COUNT <> 0 AND D_WA_ACTION.ACTION = 'TER' AND D_WA_ACTION.WA_VOLUNTARY_FLAG = 'V' AND D_WA_ACTION.ACTION_REASON in ([ 'EES', 'HRS', 'LOC', 'LOF', 'PAY', 'POL', 'PRM', 'SUP', 'TYP', 'UNS', 'USP', 'WOR'] ) then F_WORKFORCE.TERMINATE_COUNT else 0} / nullif(F_WORKFORCE.TERMINATE_COUNT) , 0) |