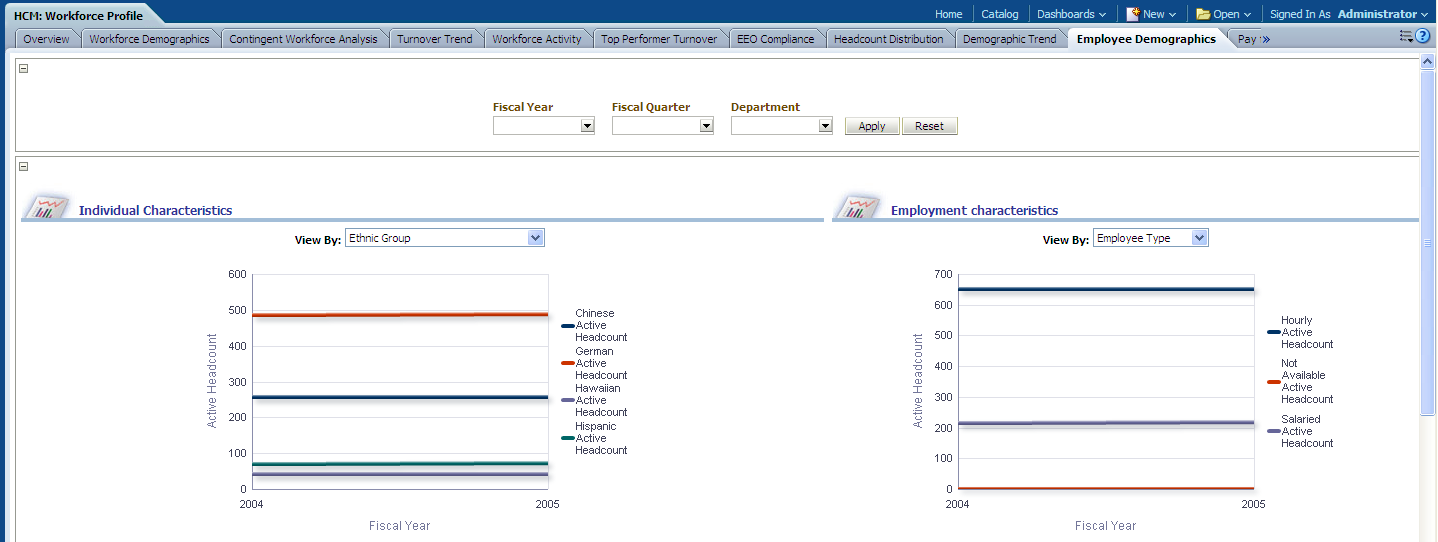
Employee Demographics Page
Use the Employee Demographics page to provide a detailed overview of employee demographics and characteristics for your organization
Image: Employee Demographics page
This example illustrates the fields and controls on the Employee Demographics page. You can find definitions for the fields and controls later on this page.
|
Usage |
Reports |
Dashboard Prompt |
|---|---|---|
|
Provides a detailed overview of employee demographics and characteristics for your organization. |
This page is comprised of the following reports:
|
Use the Employee Demographics page prompt to filter page results by:
|
Individual Characteristics Report
Use the Individual Characteristics report, which details trending of employee characteristics by ethnic group, age, gender, and so forth.
Image: Individual Characteristics report, part 1
This example illustrates the fields and controls on the Individual Characteristics report, part 1. You can find definitions for the fields and controls later on this page.
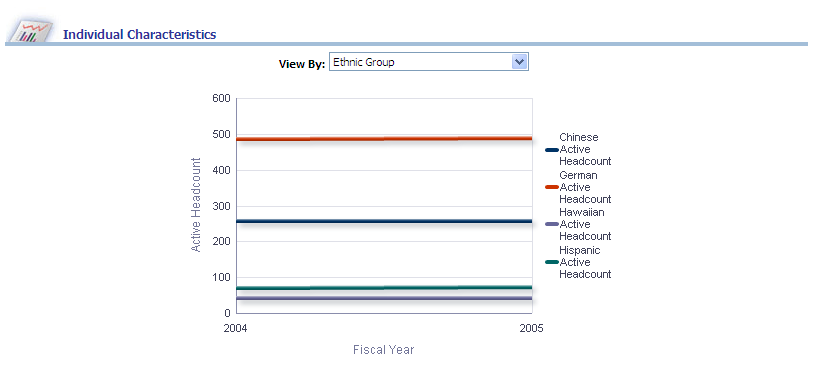
Image: Individual Characteristics report, part 1
This example illustrates the fields and controls on the Individual Characteristics report, part 1. You can find definitions for the fields and controls later on this page.
|
X,Y Axis Data |
View By Filter |
|---|---|
|
The Individual Characteristics graph displays Fiscal Year data on the x-axis and Headcount data on the y-axis, with Ethnic Group data plotted across the x/y-axis. The x/y-axis can also plot any of the following dimensions, depending on your View By filter selection:
Note: You can click on graph data to review drill down data for a particular year. |
Use this filter to view report results by:
|
|
Report Column / Measure Name |
Report Column / Measure Origin |
|---|---|
|
Fiscal Year |
Day (D_DAY) Dimension |
|
Gender |
Person (D_PERSON) Dimension |
|
Age |
Person (D_PERSON) Dimension |
|
Employee Citizenship |
Person (D_PERSON) Dimension |
|
Employee Disability |
Person (D_PERSON) Dimension |
|
Security Clearance Level |
Position (D_POS) Dimension |
|
Employee Highest Education Degree |
Person (D_PERSON) Dimension |
|
Employee Marital Status |
Person (D_PERSON) Dimension |
|
Ethnic Group |
Person (D_PERSON) Dimension |
|
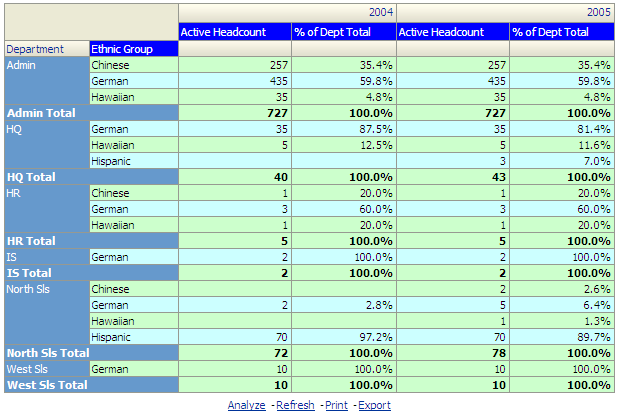
Headcount |
Workforce (F_WORKFORCE) Fact |
|
% of Department Total |
Workforce (F_WORKFORCE) Fact: (Active Headcount / Total Active Headcount) * 100 |
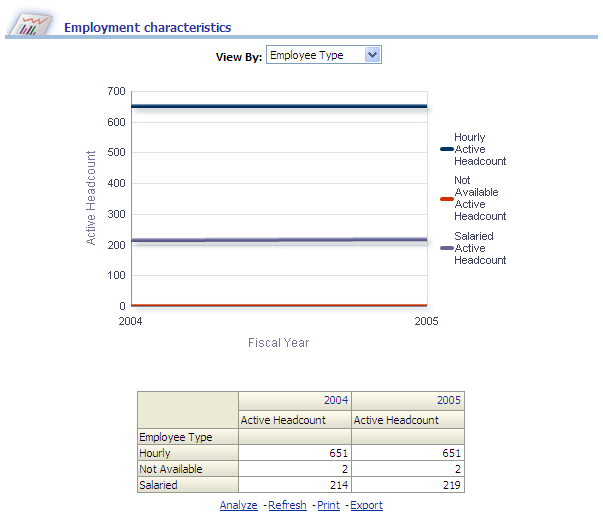
Employment Characteristics Report
Use the Employment Characteristics report, which details active headcount by employee type and full time or part time.
Image: Employment Characteristics report
This example illustrates the fields and controls on the Employment Characteristics report. You can find definitions for the fields and controls later on this page.
|
X,Y Axis Data |
View By Filter |
|---|---|
|
The Employment Characteristics graph displays Fiscal Year data on the x-axis and Headcount data on the y-axis, with Employee Type data plotted across the x/y-axis. The x/y-axis can also plot the Full Time/Part Time dimension, depending on your View By filter selection. Note: You can click on graph data to review drill down data for a particular year. |
Use this filter to view report results by:
|
|
Report Column / Measure Name |
Report Column / Measure Origin |
|---|---|
|
Fiscal Year |
Day (D_DAY) Dimension |
|
Employee Type |
Employee Job Code (D_EMPL_JOB) Dimension |
|
Full Time / Part Time |
Employee Job Code (D_EMPL_JOB) Dimension |
|
Headcount |
Workforce (F_WORKFORCE) Fact |