Equal Employment Opportunity (EEO) Compliance Page
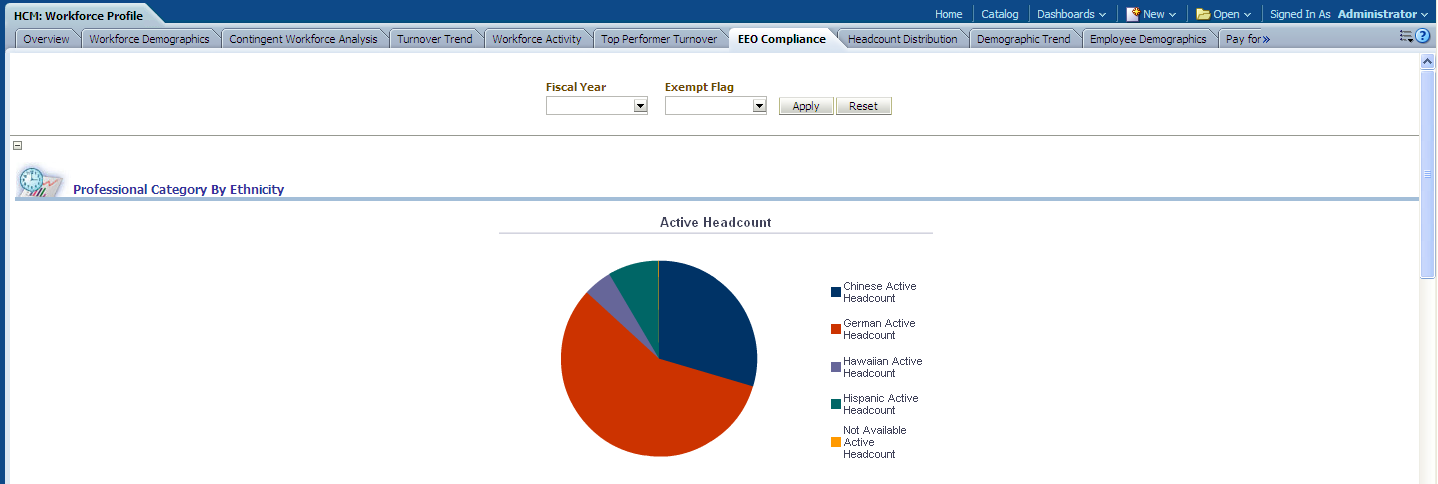
Use the EEO Compliance page to provide an overview of equal employment opportunity metrics for your organization by ethnicity, gender, and minority group.
Image: EEO Compliance page
This example illustrates the fields and controls on the EEO Compliance page. You can find definitions for the fields and controls later on this page.
|
Usage |
Reports |
Dashboard Prompt |
|---|---|---|
|
Provides an overview of equal employment opportunity metrics for your organization by ethnicity, gender, and minority group. |
This page is comprised of the following reports:
|
Use the EEO Compliance page prompt to filter page results by Fiscal Year. |
Professional Category By Ethnicity Report
Use the Professional Category By Ethnicity report, which enables you to analyze the ethnic composition of your workforce.
Image: Professional Category By Ethnicity report
This example illustrates the fields and controls on the Professional Category By Ethnicity report. You can find definitions for the fields and controls later on this page.
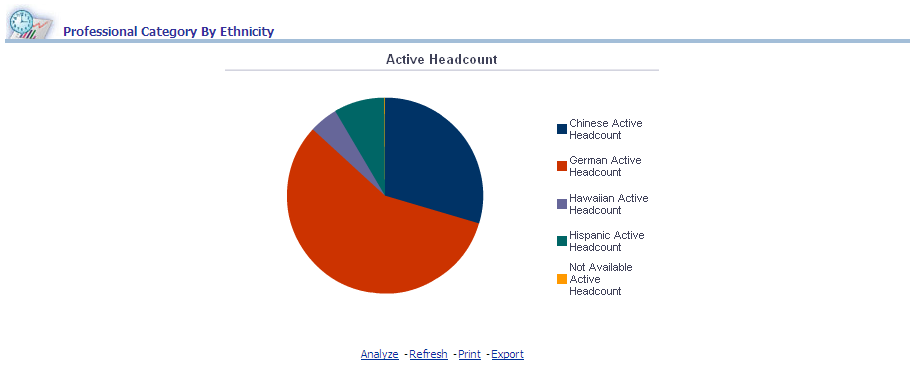
The Professional Category By Ethnicity pie chart displays Headcount data grouped by Ethnic Group.
Note: You can click on a pie slice to drill down to active headcount data for a particular ethnic group.
|
Report Column / Measure Name |
Report Column / Measure Origin |
|---|---|
|
Snapshot Year |
Day (D_DAY) Dimension |
|
Ethnic Group |
Person (D_PERSON) Dimension |
|
Headcount |
Workforce (F_WORKFORCE) Fact |
Minority Representation by Job Category Report
Use the Minority Representation by Job Category report, which enables you to analyze the ethnic composition of employees across equal employment opportunity job categories.
Image: Minority Representation by Job Category report, part 1
This example illustrates the fields and controls on the Minority Representation by Job Category report, part 1. You can find definitions for the fields and controls later on this page.
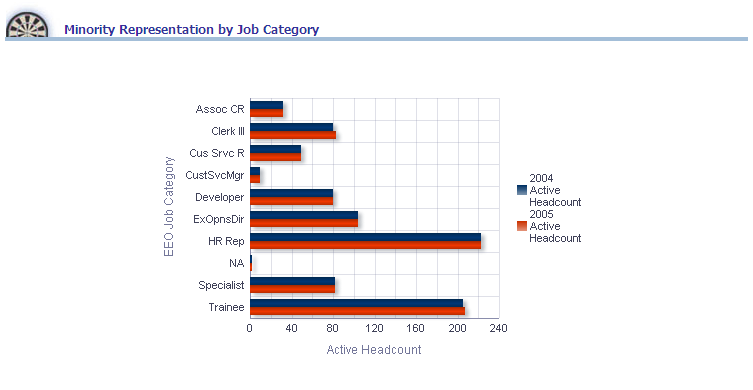
Image: Minority Representation by Job Category report, part 2
This example illustrates the fields and controls on the Minority Representation by Job Category report, part 2. You can find definitions for the fields and controls later on this page.
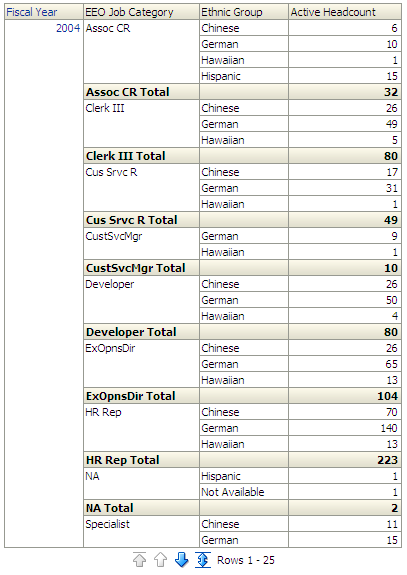
The Minority Representation by Job Category graph displays Headcount data on the x-axis and EEO Job Category and Fiscal Year data on the y-axis.
Note: You can click on graph data to review drill down data for a particular year.
|
Report Column / Measure Name |
Report Column / Measure Origin |
|---|---|
|
Fiscal Year |
Day (D_DAY) Dimension |
|
EEO Job Category |
Job Code (D_JOBCODE) Dimension |
|
Ethnic Group |
Person (D_PERSON) Dimension |
|
Headcount |
Workforce (F_WORKFORCE) Fact |
Female Representation By Job Category Report
Use the Female Representation By Job Category report, which enables you to analyze female representation across job categories.
Image: Female Representation By Job Category report
This example illustrates the fields and controls on the Female Representation By Job Category report. You can find definitions for the fields and controls later on this page.
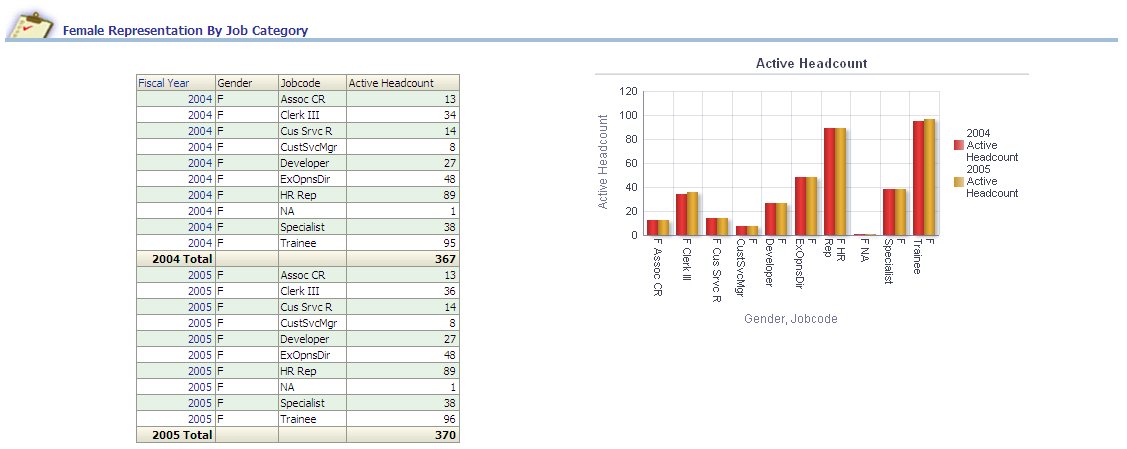
The Female Representation By Job Category graph displays Gender and Job Code data on the x-axis and Headcount and Fiscal Year data on the y-axis.
Note: You can click on graph data to review drill down data for a particular job code and year.
|
Report Column / Measure Name |
Report Column / Measure Origin |
|---|---|
|
Fiscal Year |
Day (D_DAY) Dimension |
|
Gender |
Person (D_PERSON) Dimension |
|
Job Code |
Employee Job Code (D_EMPL_JOB) Dimension |
|
Headcount |
Workforce (F_WORKFORCE) Fact |