Using the Workforce Profile Dashboard - Headcount Distribution Page
Use the Headcount Distribution page (Dashboards, HCM: Human Capital Management, HCM: Workforce Profile, Headcount Distribution).
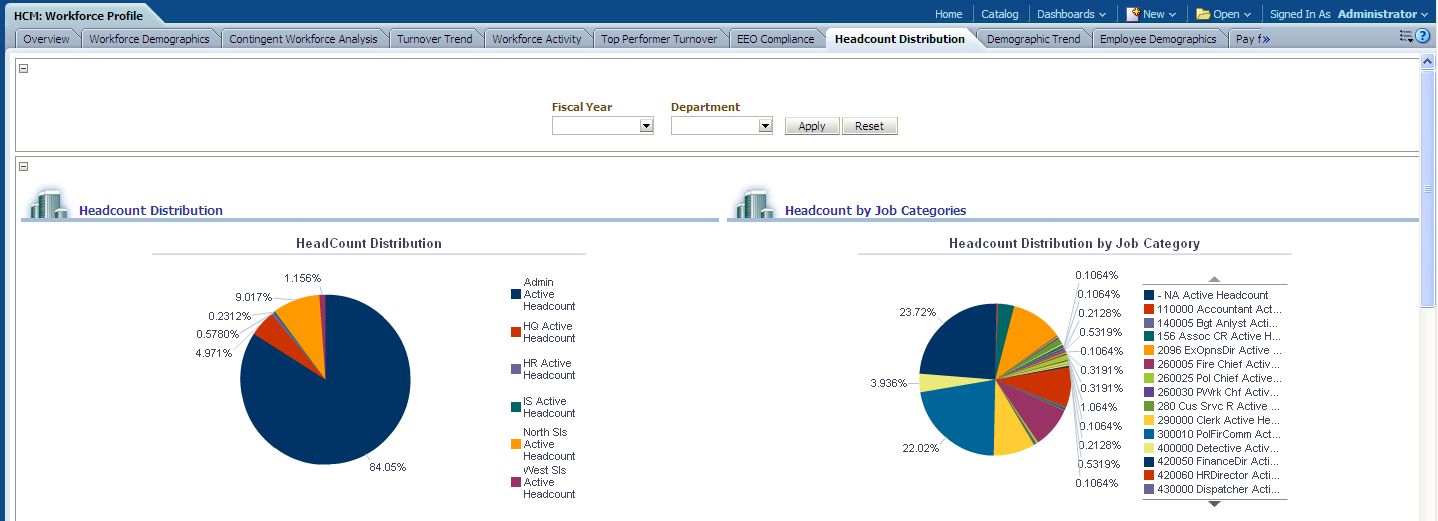
Image: Headcount Distribution page
This example illustrates the fields and controls on the Headcount Distribution page. You can find definitions for the fields and controls later on this page.
|
Usage |
Reports |
Dashboard Prompt |
|---|---|---|
|
Provides an overview of headcount distribution for your organization by department and job category, as well as headcount trends. |
This page is comprised of the following reports:
|
Use the Headcount Distribution page prompt to filter page results by:
|
Headcount Distribution Report
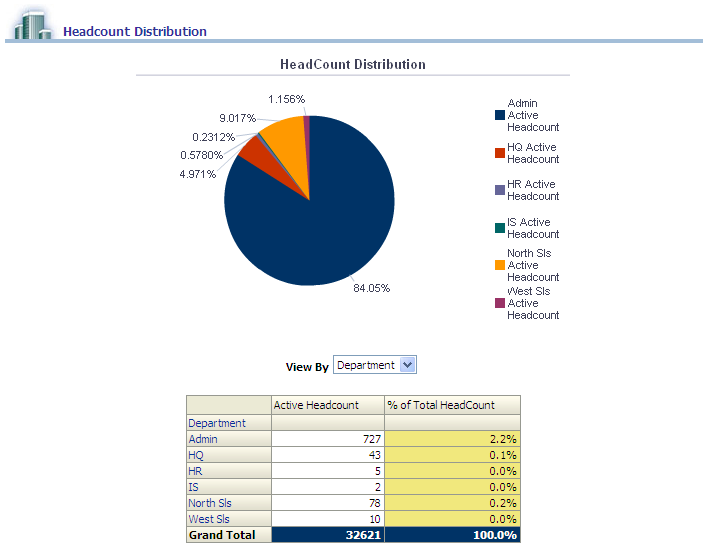
Use the Headcount Distribution report, which enables you to analyze the distribution of employees across departments or location.
Image: Headcount Distribution report
This example illustrates the fields and controls on the Headcount Distribution report. You can find definitions for the fields and controls later on this page.
|
Pie Chart Data |
View By Filter |
|---|---|
|
The Headcount Distribution pie chart displays Headcount data grouped by Department. Note: You can click on a pie slice to drill down to headcount data for a particular department or location. |
Use this filter to view report results by:
|
|
Report Column / Measure Name |
Report Column / Measure Origin |
|---|---|
|
Department |
Department (D_DEPT) Dimension |
|
Location |
Location (D_LOCATION) Dimension |
|
Headcount |
Workforce (F_WORKFORCE) Fact |
|
% of Total Headcount |
(Applicant Count / Total Applicants) * 100 |
Headcount by Job Categories Report
Use the Headcount by Job Categories report, which enables you to analyze the distribution of employees across job categories.
Image: Headcount by Job Categories report, part 1
This example illustrates the fields and controls on the Headcount by Job Categories report, part 1. You can find definitions for the fields and controls later on this page.
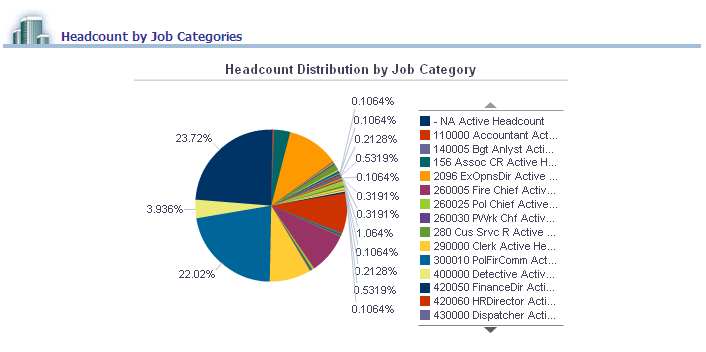
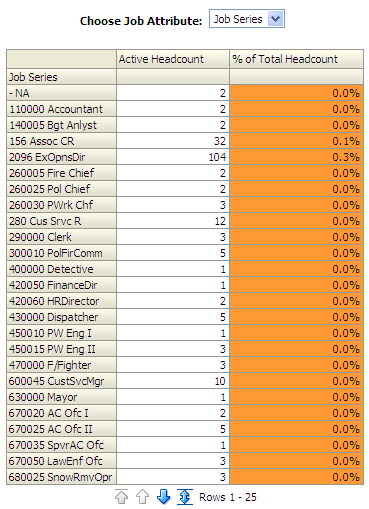
Image: Headcount by Job Categories report, part 2
This example illustrates the fields and controls on the Headcount by Job Categories report, part 2. You can find definitions for the fields and controls later on this page.
|
Pie Chart Data |
View By Filter |
|---|---|
|
The Headcount by Job Categories pie chart displays Headcount data grouped by Job Series. Headcount data can also be grouped by the following dimensions, depending on your View By filter selection:
Note: You can click on a pie slice to drill down to headcount data for a particular job code, job series, or grade. |
Use this filter to view report results by:
|
|
Report Column / Measure Name |
Report Column / Measure Origin |
|---|---|
|
Job Code |
Employee Job Code (D_EMPL_JOB) Dimension |
|
Job Series |
Employee Job Code (D_EMPL_JOB) Dimension |
|
Grade |
Employee Job Code (D_EMPL_JOB) Dimension |
|
Headcount |
Workforce (F_WORKFORCE) Fact |
|
% of Total Headcount |
(Applicant Count / Total Applicants) * 100 |
Organization Headcount Trend Report
Use the Organization Headcount Trend report, which details headcount, voluntary count, and involuntary count trends.
Image: Organization Headcount Trend report
This example illustrates the fields and controls on the Organization Headcount Trend report. You can find definitions for the fields and controls later on this page.
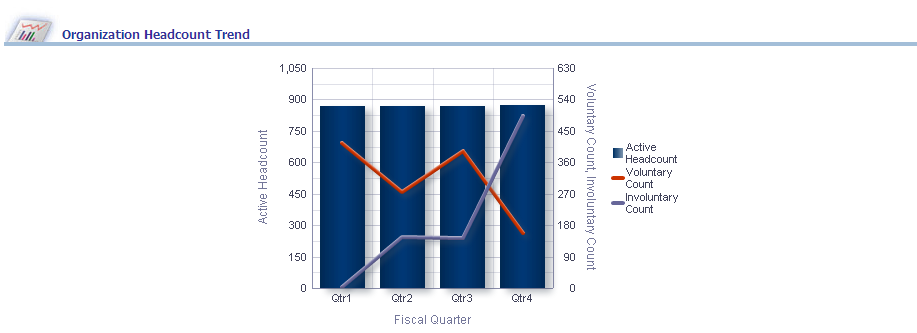
The Organization Headcount Trend graph displays Fiscal Quarter data on the x-axis and Headcount data on the y-axis, with Voluntary Count and Involuntary Count data plotted across the x/y-axis.
Note: You can on graph data to review drill down data for a particular quarter.
|
Report Column / Measure Name |
Report Column / Measure Origin |
|---|---|
|
Fiscal Quarter |
Day (D_DAY) Dimension |
|
Voluntary Count |
Workforce (F_WORKFORCE) Fact |
|
Involuntary Count |
Workforce (F_WORKFORCE) Fact |
|
Headcount |
Workforce (F_WORKFORCE) Fact |