Workforce Profile- Overview Page
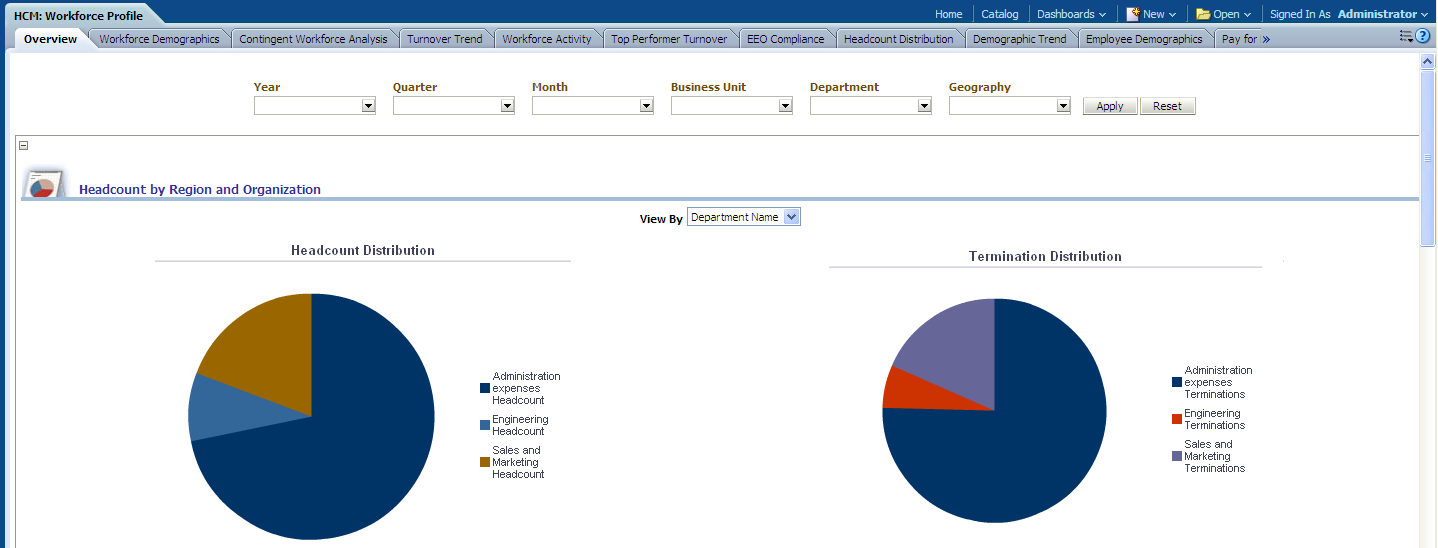
Use the Workforce Profile - Overview page to provide an overview of headcount, turnover, and promotion trends for your organization.
Image: Workforce Profile - Overview page
This example illustrates the fields and controls on the Workforce Profile - Overview page. You can find definitions for the fields and controls later on this page.
|
Usage |
Reports |
Dashboard Prompt |
|---|---|---|
|
Provides an overview of headcount, turnover, and promotion trends for your organization. |
This page is comprised of the following reports:
|
Use the Workforce Profile - Overview page prompt to filter page results by:
|
Headcount by Region and Organization Report
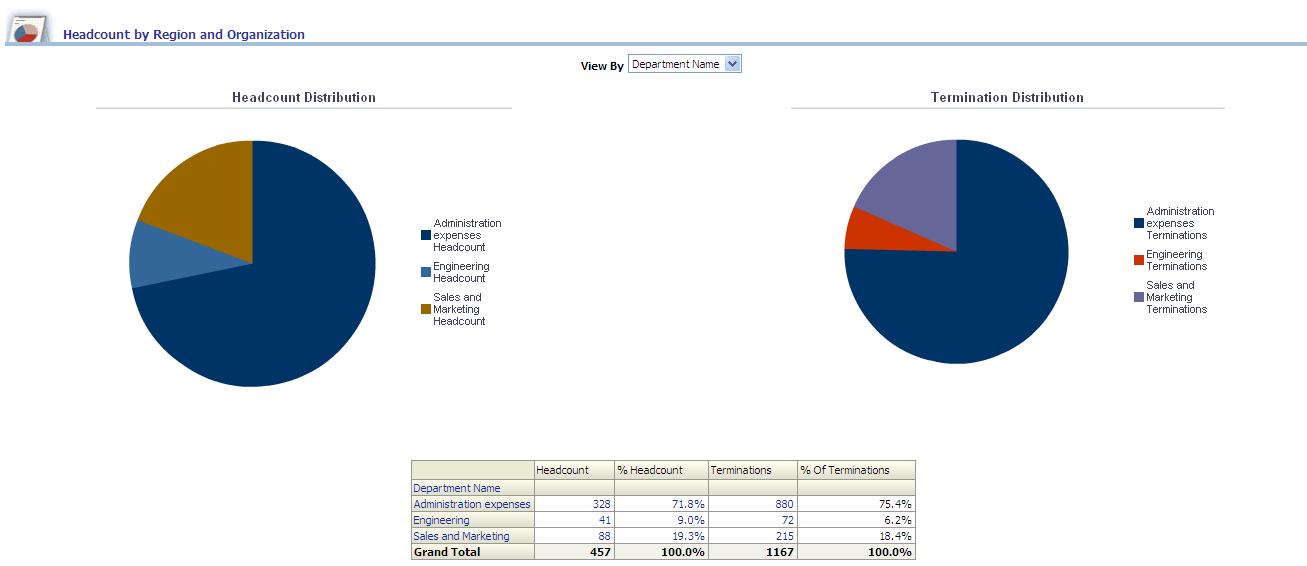
Use the Headcount by Region report, which enables you to analyze headcount and termination distribution by department or location.
Image: Headcount by Region and Organization report
This example illustrates the fields and controls on the Headcount by Region and Organization report. You can find definitions for the fields and controls later on this page.
|
View By Filter - Department Name (Default) |
View By Filter - Location |
|---|---|
|
The Headcount Distribution pie chart displays Headcount / Percent Headcount data grouped by Department. The Termination Distribution pie chart displays Terminations / Percent Terminations data grouped by Department. Note: You can click on a pie slice to drill down to individual department-level data. |
The Headcount Distribution pie chart displays Headcount / Percent Headcount data grouped by Location. The Termination Distribution pie chart displays Terminations / Percent Terminations data grouped by Location. Note: You can click on a pie slice to drill down to individual location data. |
|
Report Column / Measure Name |
Report Column / Measure Origin |
|---|---|
|
Department |
Department (D_DEPT) Dimension |
|
Location |
Location (D_LOCATION) Dimension |
|
Headcount |
Workforce (F_WORKFORCE) Fact |
|
Termination (count) |
Workforce (F_WORKFORCE) Fact |
|
% Headcount |
Workforce (F_WORKFORCE) Fact |
|
% of Termination |
Workforce (F_WORKFORCE) Fact |
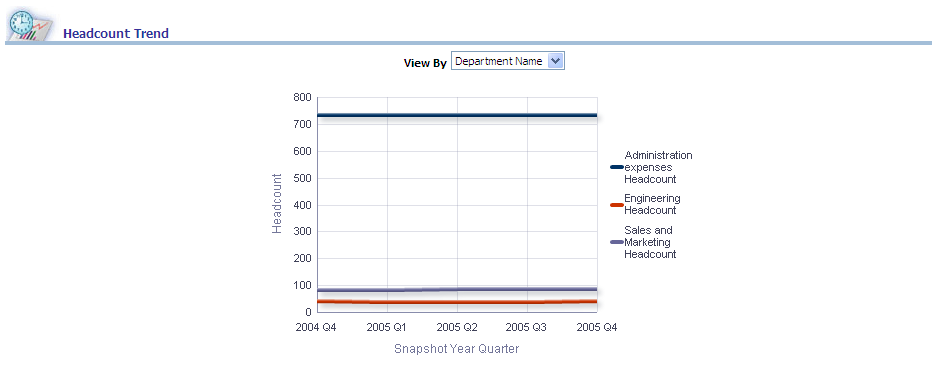
Headcount Trend Report
Use the Headcount Trend report, which provides a trending of headcount by quarter, year, department, and location.
Image: Headcount Trend report
This example illustrates the fields and controls on the Headcount Trend report. You can find definitions for the fields and controls later on this page.
|
X,Y Axis Data |
View By Filter |
|---|---|
|
The Headcount Trend graph displays Snapshot Year, Quarter data on the x-axis and Headcount and Department data on the y-axis. The y-axis can also display Location data if you select the value from the View By filter. |
Use this filter to view report results by:
|
|
Report Column / Measure Name |
Report Column / Measure Origin |
|---|---|
|
Snapshot Year |
Day (D_DAY) Dimension |
|
Snapshot Quarter |
Day (D_DAY) Dimension |
|
Department |
Department (D_DEPT) Dimension |
|
Location |
Location (D_LOCATION) Dimension |
|
Headcount |
Workforce (F_WORKFORCE) Fact |
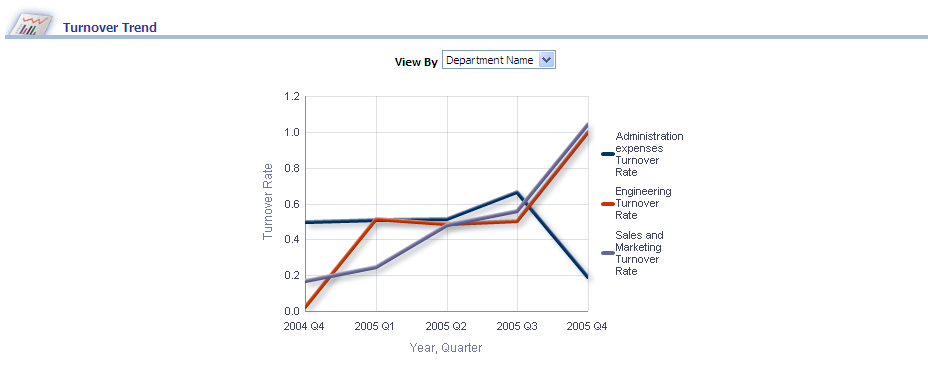
Turnover Trend Report
Use the Turnover Trend report, which provides a trending of employee turnover by quarter, year, department, and location.
Image: Turnover Trend report
This example illustrates the fields and controls on the Turnover Trend report. You can find definitions for the fields and controls later on this page.
|
X,Y Axis Data |
View By Filter |
|---|---|
|
The Turnover Trend graph displays Year, Quarter data on the x-axis and Turnover Rate and Department data on the y-axis. The y-axis can also display Location data if you select the value from the View By filter. |
Use this filter to view report results by:
|
|
Report Column / Measure Name |
Report Column / Measure Origin |
|---|---|
|
Year |
Day (D_DAY) Dimension |
|
Quarter |
Day (D_DAY) Dimension |
|
Department |
Department (D_DEPT) Dimension |
|
Location |
Location (D_LOCATION) Dimension |
|
Turnover Rate |
Workforce (F_WORKFORCE) Fact: Total Termination Count * (100 / Total Headcount) |
Promotion Trend Report
Use the Promotion Trend report, which provides a trending of employee promotions by quarter, year, department, and location.
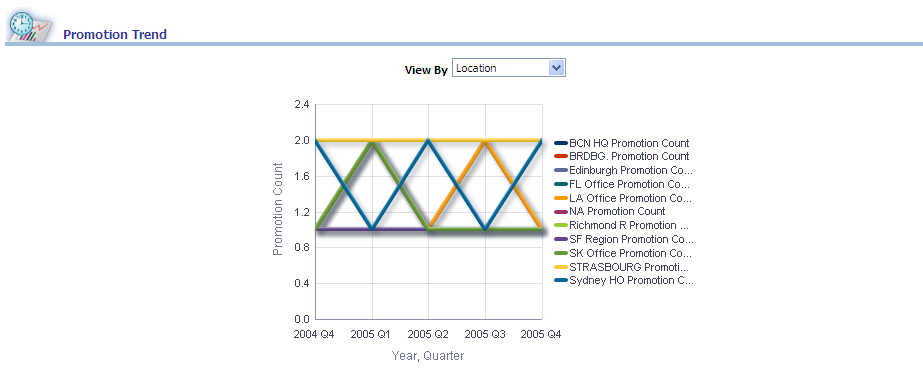
Image: Promotion Trend report
This example illustrates the fields and controls on the Promotion Trend report. You can find definitions for the fields and controls later on this page.
|
X,Y Axis Data |
View By Filter |
|---|---|
|
The Promotion Trend graph displays Year, Quarter data on the x-axis and Promotion Count and Department data on the y-axis. The y-axis can also display Location data if you select the value from the View By filter. |
Use this filter to view report results by:
|
|
Report Column / Measure Name |
Report Column / Measure Origin |
|---|---|
|
Year |
Day (D_DAY) Dimension |
|
Quarter |
Day (D_DAY) Dimension |
|
Department |
Department (D_DEPT) Dimension |
|
Location |
Location (D_LOCATION) Dimension |
|
Promotion Count |
Workforce (F_WORKFORCE) Fact |