Pay for Performance Page
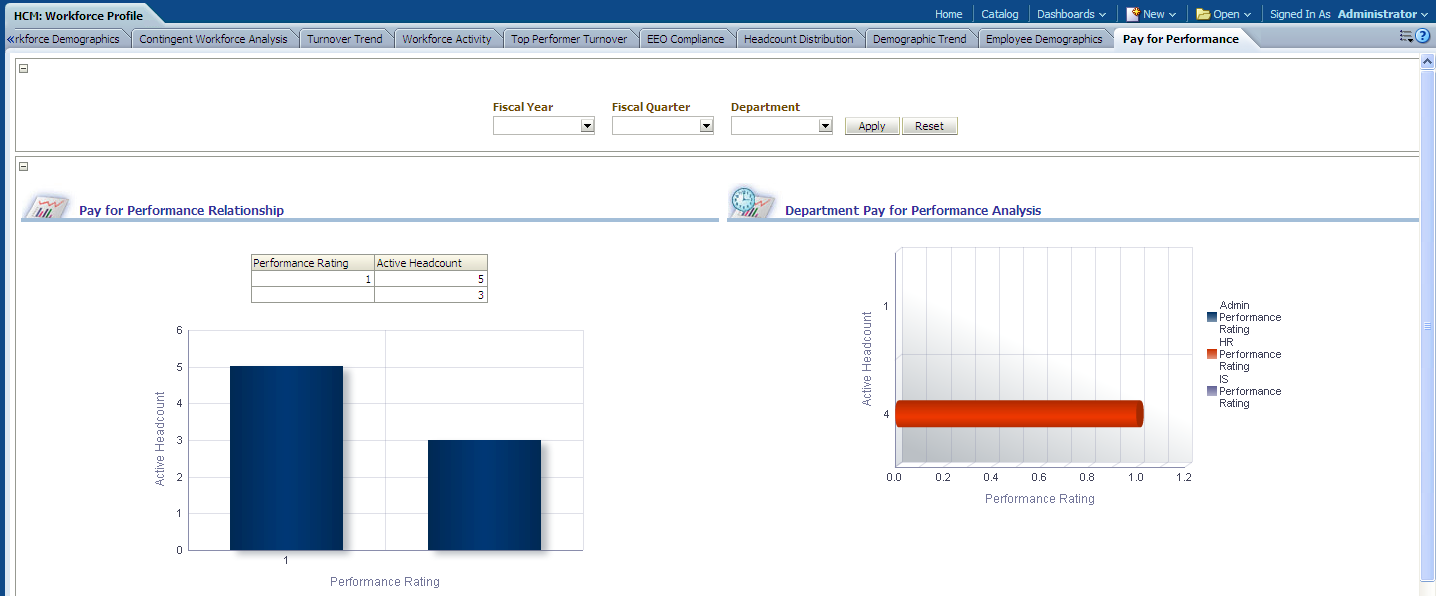
Use the Pay for Performance page to provide an overview of performance pay metrics for your organization, by relationship and department
Image: Pay for Performance page
This example illustrates the fields and controls on the Pay for Performance page. You can find definitions for the fields and controls later on this page.
|
Usage |
Reports |
Dashboard Prompt |
|---|---|---|
|
Provides an overview of performance pay metrics for your organization, by relationship and department. |
This page is comprised of the following reports:
|
Use the Pay for Performance page prompt to filter page results by:
|
Pay for Performance Relationship Report
Use the Pay for Performance Relationship report, which details performance rating and active headcount metrics.
Image: Pay for Performance Relationship report
This example illustrates the fields and controls on the Pay for Performance Relationship report. You can find definitions for the fields and controls later on this page.
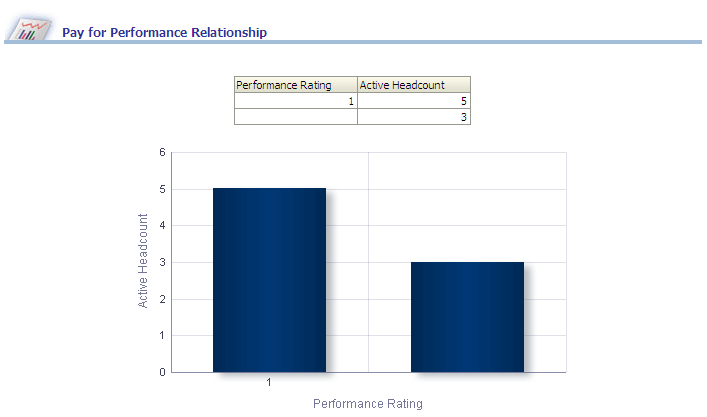
The Pay for Performance Relationship graph displays Performance Rating data on the x-axis and Headcount data on the y-axis.
The following table lists the columns and measures used in the Pay for Performance Relationship report.
|
Report Column / Measure Name |
Report Column / Measure Origin |
|---|---|
|
Performance Rating |
Employee Appraisal (D_EMPL_APRSL) Dimension |
|
Headcount |
Workforce (F_WORKFORCE) Fact |
Department Pay for Performance Analysis Report
Use the Department Pay for Performance Analysis report, which details performance rating and active headcount metrics by department.
Image: Department Pay for Performance Analysis report
This example illustrates the fields and controls on the Department Pay for Performance Analysis report. You can find definitions for the fields and controls later on this page.
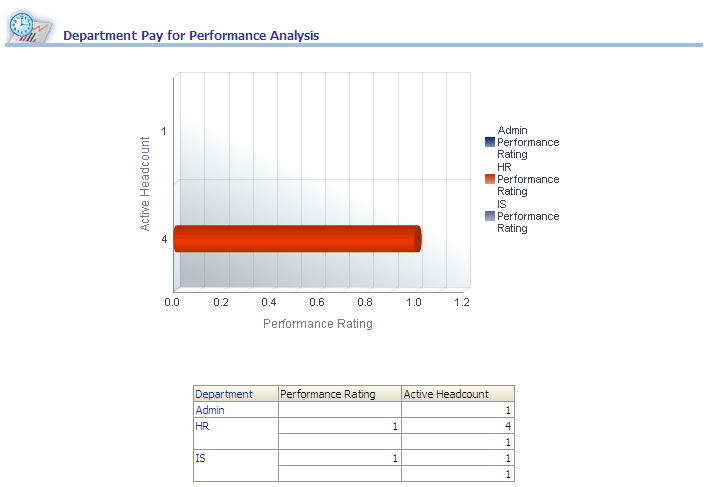
The Department Pay for Performance Analysis graph displays Performance Rating data on the x-axis and Headcount data on the y-axis, with Department data plotted across the x/y-axis.
Note: You can click on graph data to review drill down data for a particular department.
|
Report Column / Measure Name |
Report Column / Measure Origin |
|---|---|
|
Department |
Department (D_DEPT) Dimension |
|
Performance Rating |
Employee Appraisal (D_EMPL_APRSL) Dimension |
|
Headcount |
Workforce (F_WORKFORCE) Fact |