Top Performer Turnover Page
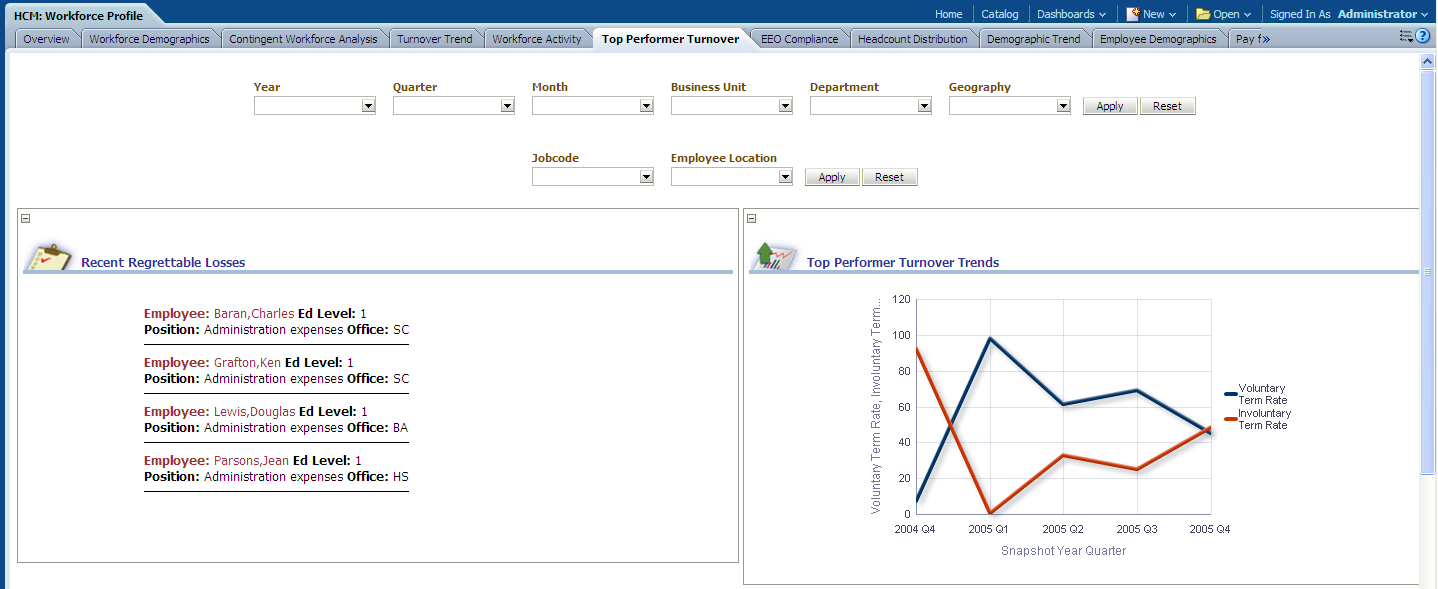
Use the Top Performer Turnover page to provide an overview of key turnover metrics for top performers in your organization, such as recent losses and trends.
Image: Top Performer Turnover page
This example illustrates the fields and controls on the Top Performer Turnover page. You can find definitions for the fields and controls later on this page.
|
Usage |
Reports |
Dashboard Prompt |
|---|---|---|
|
Provides an overview of key turnover metrics for top performers in your organization, such as recent losses and trends. |
This page is comprised of the following reports:
|
Use the Top Performer Turnover page prompt to filter page results by:
|
Recent Regrettable Losses Report
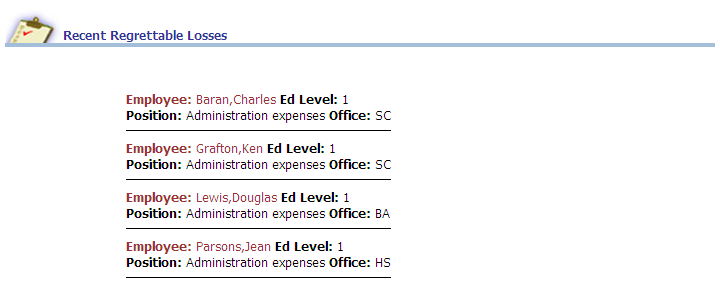
Use the Recent Regrettable Losses report, which displays information about employees that have recently left the organization.
Image: Recent Regrettable Losses report
This example illustrates the fields and controls on the Recent Regrettable Losses report. You can find definitions for the fields and controls later on this page.
Top Performer Turnover Trends Report
Use the Top Performer Turnover Trends report, which details trending of both voluntary term rate and involuntary term rate of your top performers.
Image: Top Performer Turnover Trends report
This example illustrates the fields and controls on the Top Performer Turnover Trends report. You can find definitions for the fields and controls later on this page.
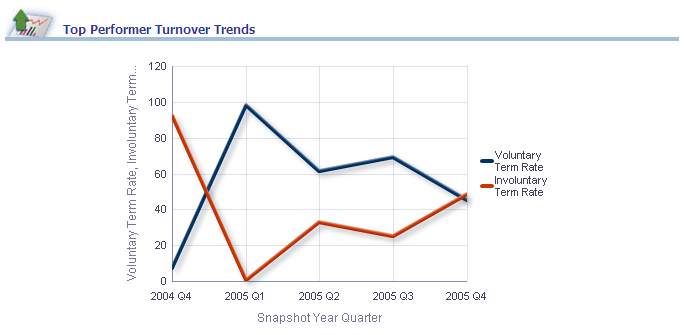
The Top Performer Turnover Trends graph displays Snapshot Year and Snapshot Quarter data on the x-axis and Voluntary Term Rate and Involuntary Term Rate data on the y-axis.
Note: You can click on graph data to review drill down data for a particular year or quarter.
|
Report Column / Measure Name |
Report Column / Measure Origin |
|---|---|
|
Snapshot Year |
Day (D_DAY) Dimension |
|
Snapshot Quarter |
Day (D_DAY) Dimension |
|
Voluntary Term Rate |
Workforce (F_WORKFORCE) Fact This measure is calculated by dividing the sum of Voluntary count by sum of Terminate count when terminate count not equal to 0: Case when [(IF Fact Workforce.TERMINATE_COUNT <> 0 AND Dimension Action.WA_VOLUNTARY_FLAG = 'V' then Fact Workforce.TERMINATE_COUNT else 0) * 100 / nullif (Fact Workforce.TERMINATE_COUNT,0)] else 0. |
|
Involuntary Term Rate |
Workforce (F_WORKFORCE) Fact This measure is calculated by dividing sum of Involuntary count by sum of Termination count when terminate count not equal to 0: Case when [(IF Fact Workforce.TERMINATE_COUNT <> 0 AND Dimension Action.WA_VOLUNTARY_FLAG = 'I' then Fact Workforce.TERMINATE_COUNT else 0) * 100 / nullif (Fact Workforce.TERMINATE_COUNT,0)] else 0. |
Top Performer At Risk Report
Use the Top Performer At Risk report, which details top performers at risk of turnover by department, location and job.
Image: Top Performer At Risk report
This example illustrates the fields and controls on the Top Performer At Risk report. You can find definitions for the fields and controls later on this page.
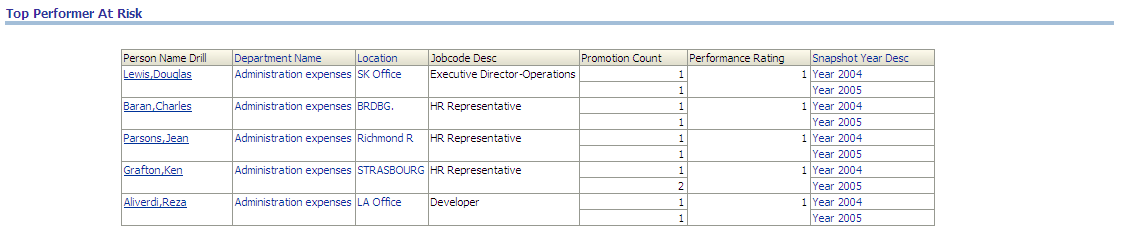
You can click any person name, department name, or location on the graph to review drill down data.
|
Report Column / Measure Name |
Report Column / Measure Origin |
|---|---|
|
Snapshot Year |
Day (D_DAY) Dimension |
|
Department |
Department (D_DEPT) Dimension |
|
Location |
Location (D_LOCATION) Dimension |
|
Job Code |
Employee Job Code (D_EMPL_JOB) Dimension |
|
Performance Rating |
Employee Appraisal (D_EMPL_APRSL) Dimension |
|
Person Name |
Person (D_PERSON) Dimension |
|
Promotion Count |
Workforce (F_WORKFORCE) Fact |