Turnover Trend Page
Use the Turnover Trend page (Dashboards, HCM: Human Capital Management, HCM: Workforce Profile, Turnover Trend).
Image: Turnover Trend page
This example illustrates the fields and controls on the Turnover Trend page. You can find definitions for the fields and controls later on this page.
|
Usage |
Reports |
Dashboard Prompt |
|---|---|---|
|
Provides an overview of turnover and position-change trends for your organization. |
This page is comprised of the following reports:
|
Use the Turnover Trend page prompt to filter page results by:
|
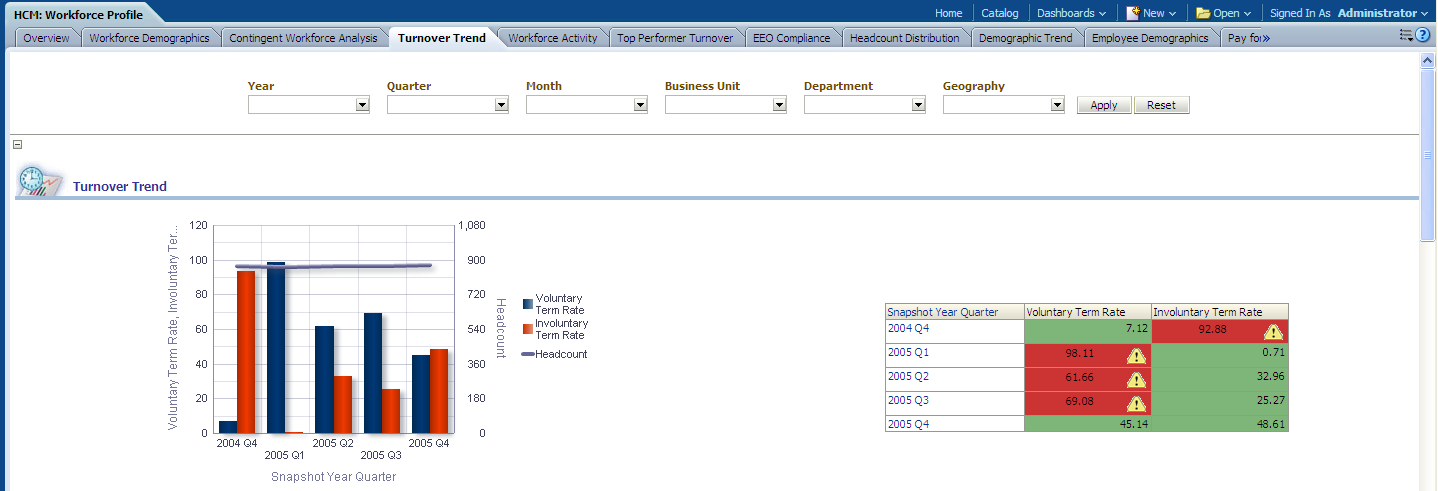
Turnover Trend Report
Use the Turnover Trend report, which details employee turnover trend by voluntary term rate and involuntary term rate by quarter.
Image: Turnover Trend report
This example illustrates the fields and controls on the Turnover Trend report. You can find definitions for the fields and controls later on this page.
![HCM_TurnoverTrendReport[TurnoverTrendDash]](img/i-4642ab0fn-7e74.png)
The Turnover Trend graph displays Snapshot Year and Snapshot Quarter data on the x-axis and Headcount, Voluntary Term Rate, and Headcount Involuntary Term Rate data on the y-axis.
Note: You can click on graph data to review drill down data for a particular year and quarter.
|
Report Column / Measure Name |
Report Column / Measure Origin |
|---|---|
|
Snapshot Year |
Day (D_DAY) Dimension |
|
Snapshot Quarter |
Day (D_DAY) Dimension |
|
Headcount |
Workforce (F_WORKFORCE) Fact |
|
Voluntary Count |
Workforce (F_WORKFORCE) Fact |
|
Involuntary Count |
Workforce (F_WORKFORCE) Fact |
|
Voluntary Term Rate |
Workforce (F_WORKFORCE) Fact This measure is calculated by dividing the sum of Voluntary count by sum of Terminate count when terminate count not equal to 0: Case when [(IF Fact Workforce.TERMINATE_COUNT <> 0 AND Dimension Action.WA_VOLUNTARY_FLAG = 'V' then Fact Workforce.TERMINATE_COUNT else 0) * 100 / nullif (Fact Workforce.TERMINATE_COUNT,0)] else 0. |
|
Involuntary Term Rate |
Workforce (F_WORKFORCE) Fact This measure is calculated by dividing sum of Involuntary count by sum of Termination count when terminate count not equal to 0: Case when [(IF Fact Workforce.TERMINATE_COUNT <> 0 AND Dimension Action.WA_VOLUNTARY_FLAG = 'I' then Fact Workforce.TERMINATE_COUNT else 0) * 100 / nullif (Fact Workforce.TERMINATE_COUNT,0)] else 0. |
Position Change Trends Report
Use the Position Change Trends report, which details turnover rates, promotion ratio, and hire count by quarter.
Image: Position Change Trends report
This example illustrates the fields and controls on the Position Change Trends report. You can find definitions for the fields and controls later on this page.
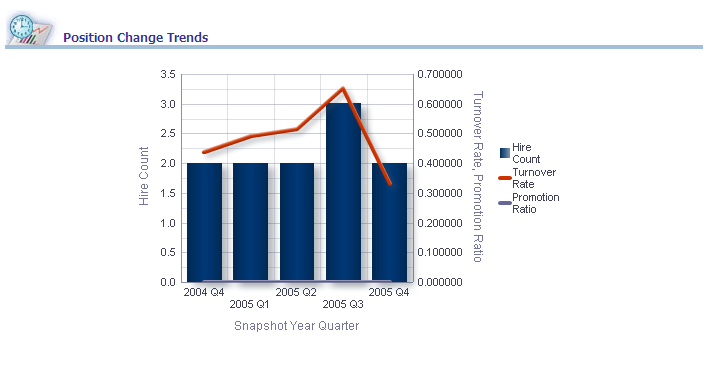
The Position Change Trends graph displays Snapshot Year and Snapshot Quarter data on the x-axis and Hire Count, Turnover Rate, and Promotion Ratio data on the y-axis.
Note: You can click on graph data to review drill down data for a particular year and quarter.
|
Report Column / Measure Name |
Report Column / Measure Origin |
|---|---|
|
Snapshot Year |
Day (D_DAY) Dimension |
|
Snapshot Quarter |
Day (D_DAY) Dimension |
|
Headcount |
Workforce (F_WORKFORCE) Fact |
|
Turnover Rate |
Workforce (F_WORKFORCE) Fact: Total Termination Count * (100 / Total Headcount) |
|
Promotion Ratio |
Workforce (F_WORKFORCE) Fact Promotion Count / Total Headcount |
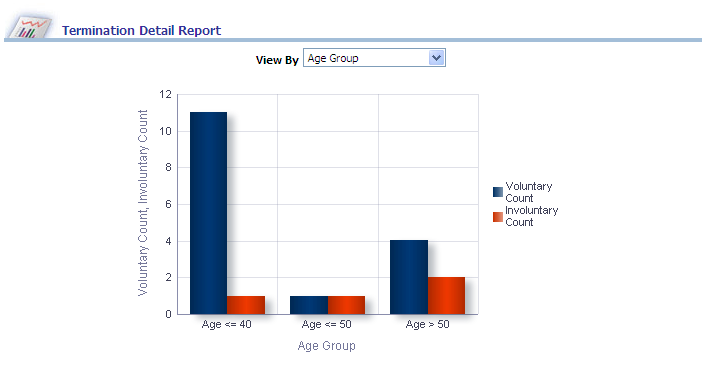
Termination Detail Report
Use the Termination Detail report, which details both voluntary term rate and involuntary term rate by age group, job function, service group, and appraisal review rating.
Image: Termination Detail report
This example illustrates the fields and controls on the Termination Detail report. You can find definitions for the fields and controls later on this page.
|
X,Y Axis Data |
View By Filter |
|---|---|
|
The Termination Detail graph displays Age Group data on the x-axis and Voluntary Count and Involuntary Count data on the y-axis. The x-axis can also display any of the following dimensions, depending on your View By filter selection:
Note: You can on graph data to review drill down data for a particular dimension (such as job function). |
Use this filter to view report results by:
|
|
Report Column / Measure Name |
Report Column / Measure Origin |
|---|---|
|
Job Function |
Jobcode (D_JOBCODE) Dimension |
|
Appraisal Review Rating |
Employee Appraisal (D_EMPL_APRSL) Dimension |
|
Service Group |
Service Group (D_SERVICEGRP_VW) Dimension (D_DURATION) |
|
Age Group |
Age Group (D_AGRGRP_VW) Dimension (D_DURATION) |
|
Voluntary Count |
Workforce (F_WORKFORCE) Fact |
|
Involuntary Count |
Workforce (F_WORKFORCE) Fact |
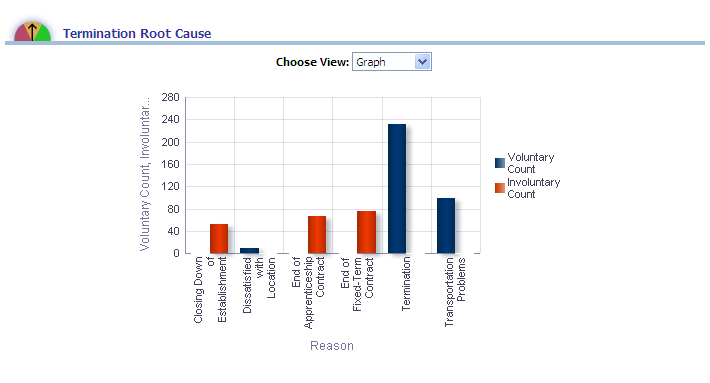
Termination Root Cause Report
Use the Termination Root Cause report, which enables you to analyze root causes of termination across your organization and the action taken.
Image: Termination Root Cause report
This example illustrates the fields and controls on the Termination Root Cause report. You can find definitions for the fields and controls later on this page.
|
X,Y Axis Data |
Choose View Filter |
|---|---|
|
In chart view, the Termination Root Cause graph displays Reason data on the x-axis and Voluntary Count and Involuntary Count data on the y-axis. In pivot table view, the same data is displayed in table format, but includes the addition of Department data. |
Use this filter to view report results in chart format or pivot table format. |
|
Report Column / Measure Name |
Report Column / Measure Origin |
|---|---|
|
Person |
Person (D_PERSON) Dimension |
|
Position |
Position (D_POS) Dimension |
|
Action |
Action (D_WA_ACTION) Dimension |
|
Department |
Department (D_DEPT) Dimension |
|
Reason |
Response Reason (D_RESP_RSN) Dimension |
|
Voluntary Count |
Workforce (F_WORKFORCE) Fact |
|
Involuntary Count |
Workforce (F_WORKFORCE) Fact |
Top Performer Turnover Trend Report
Use the Top Performer Turnover Trend report, which enables you to analyze voluntary and involuntary turnover trends for your top performers across your organization.
Image: Top Performer Turnover Trend report
This example illustrates the fields and controls on the Top Performer Turnover Trend report. You can find definitions for the fields and controls later on this page.
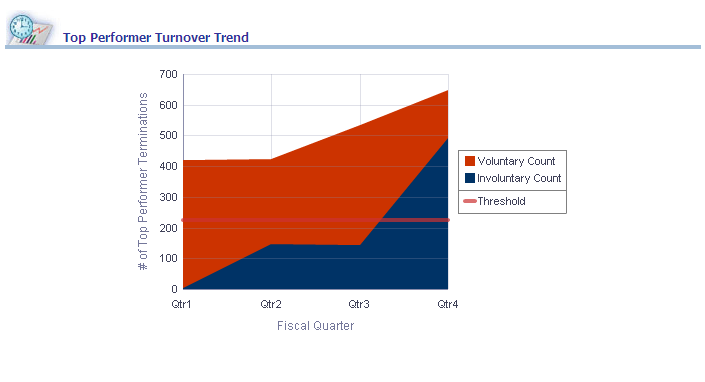
The Top Performer Turnover Trend graph displays Fiscal Quarter data on the x-axis and Voluntary Count, Involuntary Count and Total Number of Top Performer Termination Count data on the y-axis.
Note: You define the report threshold value in the chart view of the report. In chart view, click Axis Scaling. In the new window click Edit Scale Markers. In the new window, edit the threshold value per your business requirements.
|
Report Column / Measure Name |
Report Column / Measure Origin |
|---|---|
|
Fiscal Quarter |
Day (D_DAY) Dimension |
|
Voluntary Count |
Workforce (F_WORKFORCE) Fact |
|
Involuntary Count |
Workforce (F_WORKFORCE) Fact |
|
Total Number of Top Performer Termination |
Workforce (F_WORKFORCE) Fact |
Turnover Distribution Analysis Report
Use the Turnover Distribution Analysis report, which details both voluntary term counts and involuntary term counts by fiscal year and department.
Image: Turnover Distribution Analysis report
This example illustrates the fields and controls on the Turnover Distribution Analysis report. You can find definitions for the fields and controls later on this page.
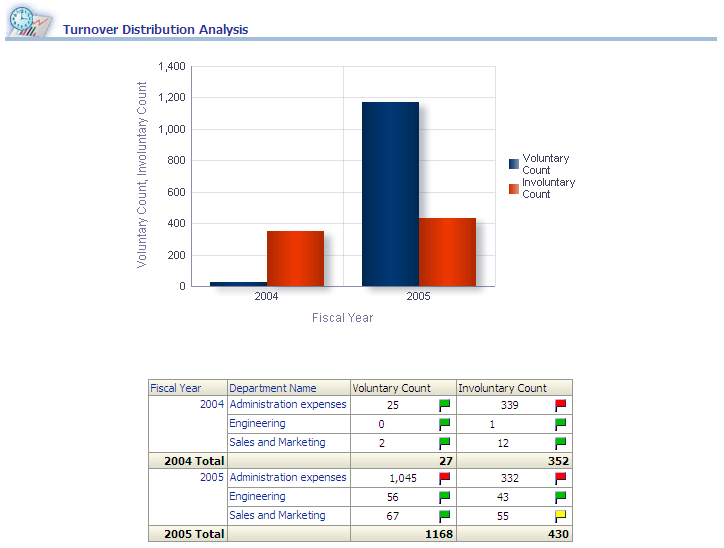
The Turnover Distribution Analysis graph displays Fiscal Year data on the x-axis and Voluntary Count and Involuntary Count data on the y-axis.
Note: You can click on graph data to review drill down data for a particular year.
|
Report Column / Measure Name |
Report Column / Measure Origin |
|---|---|
|
Fiscal Year |
Day (D_DAY) Dimension |
|
Department |
Department (D_DEPT) Dimension |
|
Voluntary Count |
Workforce (F_WORKFORCE) Fact |
|
Involuntary Count |
Workforce (F_WORKFORCE) Fact |
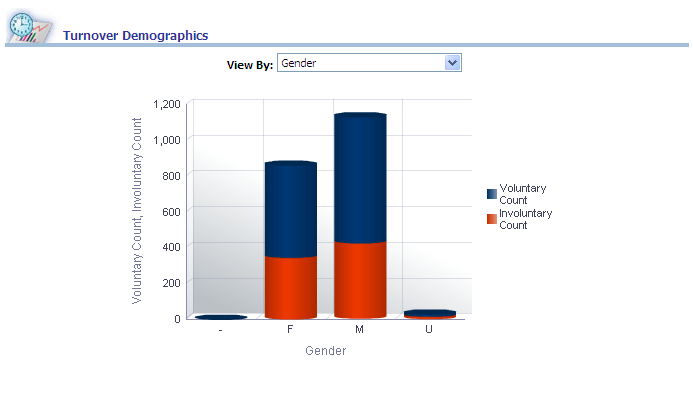
Turnover Demographics Report
Use the Turnover Demographics report, which enables you to analyze employee turnover by demographic, such as gender or age.
Image: Turnover Demographics report
This example illustrates the fields and controls on the Turnover Demographics report. You can find definitions for the fields and controls later on this page.
|
X,Y Axis Data |
View By Filter |
|---|---|
|
The Turnover Demographics graph displays Gender data on the x-axis and Voluntary Count and Involuntary Count data on the y-axis. The x-axis can also display any of the following dimensions, depending on your View By filter selection:
Note: You can click on graph data to review drill down data for a particular dimension (such as gender or age). |
Use this filter to view report results by:
|
|
Report Column / Measure Name |
Report Column / Measure Origin |
|---|---|
|
Employee Type |
Employee Job Code (D_EMPL_JOB) Dimension |
|
Age |
Person (D_PERSON) Dimension |
|
Ethnic Group |
Person (D_PERSON) Dimension |
|
Gender |
Person (D_PERSON) Dimension |
|
Position Security Clearance Code |
Position (D_POS) Dimension |
|
Employee High Potential Flag |
This flag uses a Y or N value, based on Higher Education Level Code (HI_EDU_LVL_CD) values, which include:
If HI_EDU_LVL_CD value = J, K or L, then Employee High Potential Flag is set to Y. Otherwise, the flag is set to N. |
|
Voluntary Count |
Workforce (F_WORKFORCE) Fact |
|
Involuntary Count |
Workforce (F_WORKFORCE) Fact |