Workforce Demographics Page
Use the Workforce Demographics page .
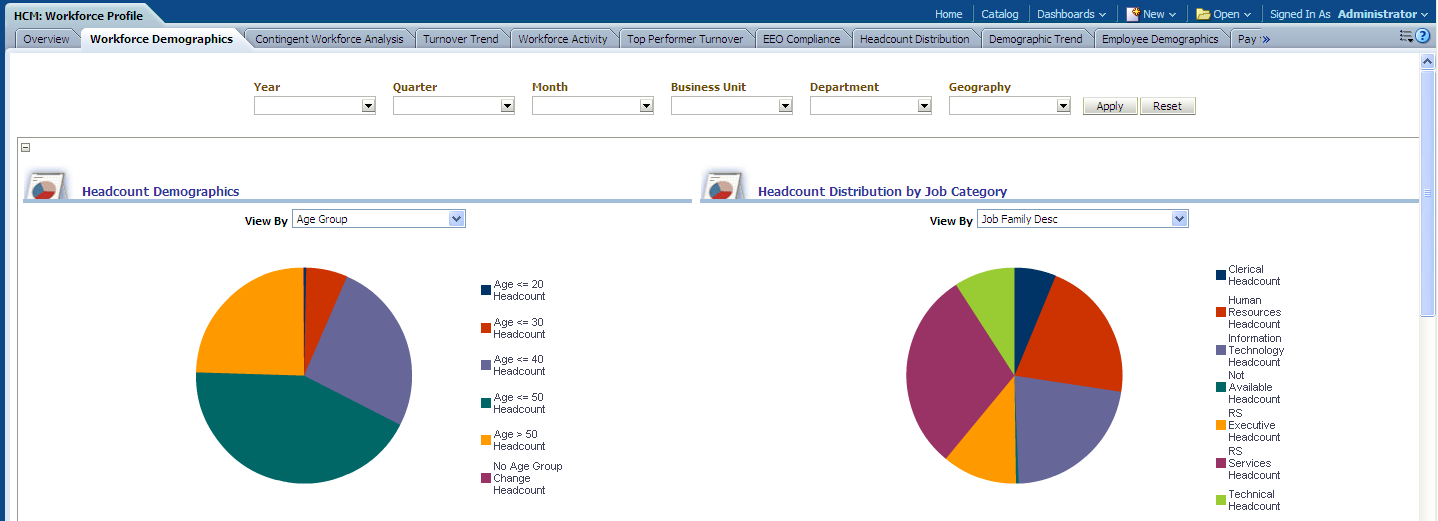
Image: Workforce Demographics page
This example illustrates the fields and controls on the Workforce Demographics page. You can find definitions for the fields and controls later on this page.
|
Usage |
Reports |
Dashboard Prompt |
|---|---|---|
|
Provides a detailed overview of organization headcount demographics |
This page is comprised of the following reports:
|
Use the Workforce Demographics page prompt to filter page results by:
|
Headcount Demographics Report
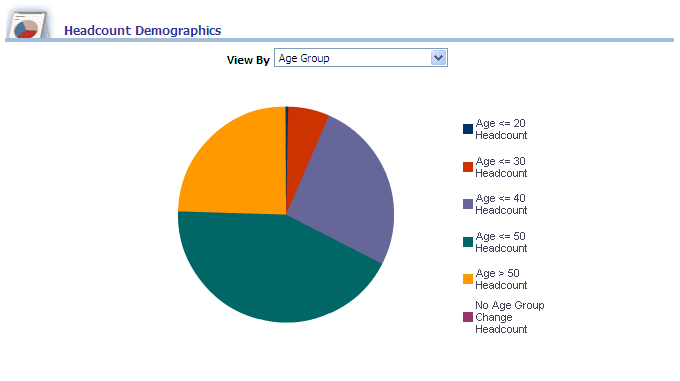
Use the Headcount Demographics report, which details headcount by various demographic dimensions such as age, service group, location, and department.
Image: Headcount Demographics report
This example illustrates the fields and controls on the Headcount Demographics report. You can find definitions for the fields and controls later on this page.
|
Pie Chart Data |
View By Filter |
|---|---|
|
The Headcount Demographics pie chart displays Headcount data grouped by Age Group. Headcount data can also be grouped by any of the following dimensions, depending on your View By filter selection:
Note: You can click on a pie slice to drill down to headcount data for a particular dimension (such as location). |
Use this filter to view report results by:
|
|
Report Column / Measure Name |
Report Column / Measure Origin |
|---|---|
|
Age Group |
Age Group (D_AGRGRP_VW) Dimension (D_DURATION) |
|
Fairlabor Standards Act Status |
Employee Job (D_EMPL_JOB) Dimension |
|
Service Group |
Service Group (D_SERVICEGRP_VW) Dimension (D_DURATION) |
|
Department |
Department (D_DEPT) Dimension |
|
Location |
Location (D_LOCATION) Dimension |
|
Headcount |
Workforce (F_WORKFORCE) Fact |
Headcount Distribution by Job Category Report
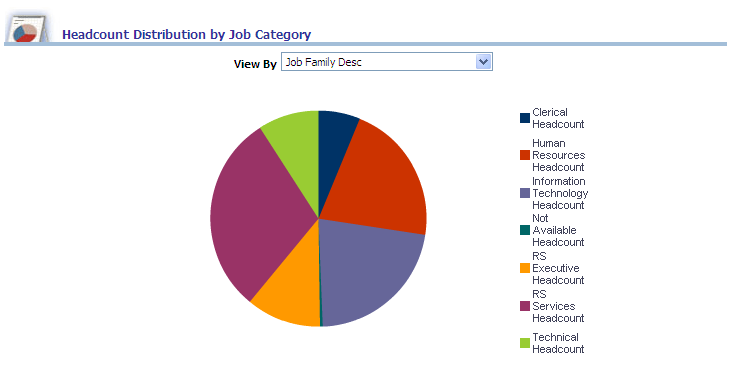
Use the Headcount Distribution by Job Category report, which details employee headcount distribution by various job category dimensions such as job code, position, and salary grade.
Image: Headcount Distribution by Job Category report
This example illustrates the fields and controls on the Headcount Distribution by Job Category report. You can find definitions for the fields and controls later on this page.
|
Pie Chart Data |
View By Filter |
|---|---|
|
The Headcount Distribution by Job Category pie chart displays Headcount data grouped by Job Family Description. Headcount data can also be grouped by any of the following dimensions, depending on your View By filter selection:
Note: You can click on a pie slice to drill down to head count data for a particular dimension (such as location). |
Use this filter to view report results by:
|
The following table lists the columns and measures used in the Headcount Distribution by Job Category report.
|
Report Column / Measure Name |
Report Column / Measure Origin |
|---|---|
|
Equal Employment Opportunity 1 Code |
Jobcode (D_JOBCODE) Dimension |
|
Job Code |
Employee Job Code (D_EMPL_JOB) Dimension |
|
Job Family Description |
Jobcode (D_JOBCODE) Dimension |
|
Position |
Position (D_POS) Dimension |
|
Salary Grade Group |
Salary Grade Group (D_SALGRDGRP_VW) Dimension (D_DURATION) |
|
Department |
Department (D_DEPT) Dimension |
|
Location |
Location (D_LOCATION) Dimension |
|
Headcount |
Workforce (F_WORKFORCE) Fact |
Termination Demographics Report
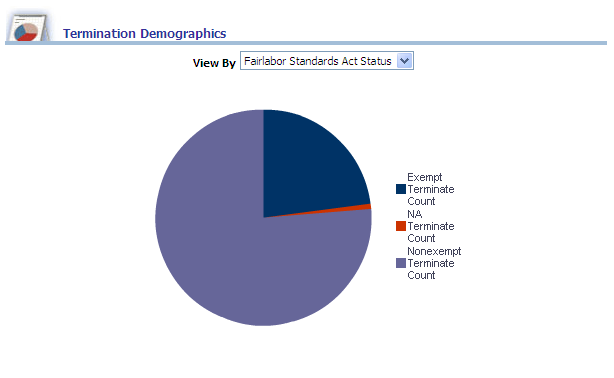
Use the Termination Demographics report, which details employee terminations by various dimensions such as age, department, or service group.
Image: Termination Demographics report
This example illustrates the fields and controls on the Termination Demographics report. You can find definitions for the fields and controls later on this page.
|
Pie Chart Data |
View By Filter |
|---|---|
|
The Termination Demographics pie chart displays Termination Count data grouped by Fairlabor Standards Act Status. Termination count data can also be grouped by any of the following dimensions, depending on your View By filter selection:
Note: You can click on a pie slice to drill down to termination count data for a particular dimension (such as location). |
Use this filter to view report results by:
|
|
Report Column / Measure Name |
Report Column / Measure Origin |
|---|---|
|
Age Group |
Age Group (D_AGRGRP_VW) Dimension (D_DURATION) |
|
Fairlabor Standards Act Status |
Employee Job (D_EMPL_JOB) Dimension |
|
Service Group |
Service Group (D_SERVICEGRP_VW) Dimension (D_DURATION) |
|
Department |
Department (D_DEPT) Dimension |
|
Location |
Location (D_LOCATION) Dimension |
|
Termination Count |
Workforce (F_WORKFORCE) Fact |
Termination Distribution by Job Category Report
Use the Termination Distribution by Job Category report, which details employee termination distribution by various job category dimensions such as job code, position, and salary grade.
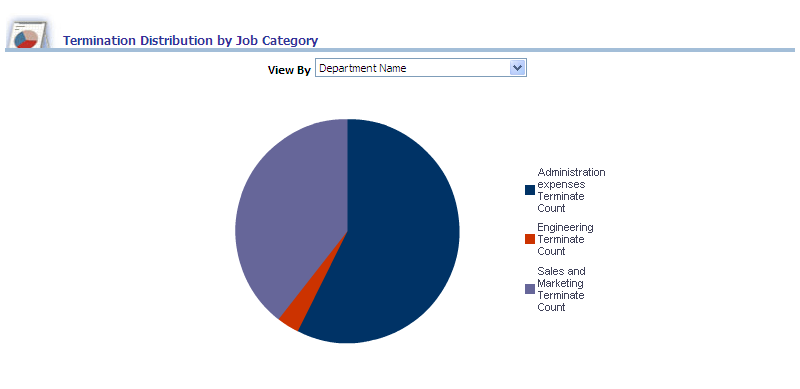
Image: Termination Distribution by Job Category report
This example illustrates the fields and controls on the Termination Distribution by Job Category report. You can find definitions for the fields and controls later on this page.
|
Pie Chart Data |
View By Filter |
|---|---|
|
The Termination Distribution by Job Category pie chart displays Termination Count data grouped by Department. Termination count data can also be grouped by any of the following dimensions, depending on your View By filter selection:
Note: You can click on a pie slice to drill down to termination count data for a particular dimension (such as position). |
Use this filter to view report results by:
|
|
Report Column / Measure Name |
Report Column / Measure Origin |
|---|---|
|
Equal Employment Opportunity 1 Code |
Jobcode (D_JOBCODE) Dimension |
|
Job Code |
Employee Job Code (D_EMPL_JOB) Dimension |
|
Job Family Description |
Jobcode (D_JOBCODE) Dimension |
|
Position |
Position (D_POS) Dimension |
|
Salary Grade Group |
Salary Grade Group (D_SALGRDGRP_VW) Dimension (D_DURATION) |
|
Department |
Department (D_DEPT) Dimension |
|
Location |
Location (D_LOCATION) Dimension |
|
Termination Count |
Workforce (F_WORKFORCE) Fact |
Promotion Demographics Report
Use the Promotion Demographics report, which details employee promotions by various dimensions such as age group, location, or department.
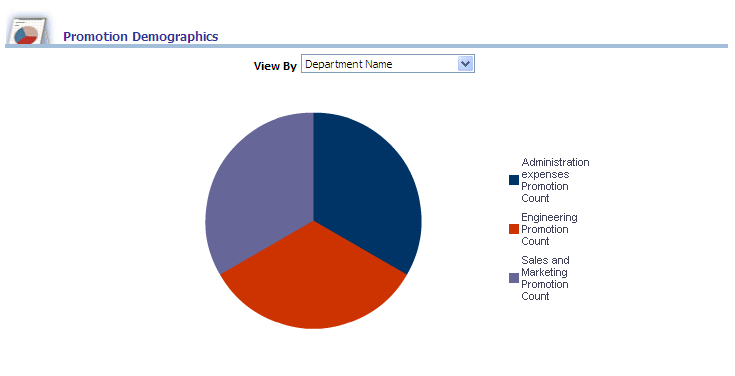
Image: Promotion Demographics report
This example illustrates the fields and controls on the Promotion Demographics report. You can find definitions for the fields and controls later on this page.
|
Pie Chart Data |
View By Filter |
|---|---|
|
The Promotion Demographics pie chart displays Promotion Count data grouped by Department. Promotion count data can also be grouped by any of the following dimensions, depending on your View By filter selection:
Note: You can click on a pie slice to drill down to promotion count data for a particular dimension (such as age group). |
Use this filter to view report results by:
|
|
Report Column / Measure Name |
Report Column / Measure Origin |
|---|---|
|
Age Group |
Age Group (D_AGRGRP_VW) Dimension (D_DURATION) |
|
Fairlabor Standards Act Status |
Employee Job (D_EMPL_JOB) Dimension |
|
Service Group |
Service Group (D_SERVICEGRP_VW) Dimension (D_DURATION) |
|
Department |
Department (D_DEPT) Dimension |
|
Location |
Location (D_LOCATION) Dimension |
|
Promotion Count |
Workforce (F_WORKFORCE) Fact |
Promotion Distribution by Job Category Report
Use the Promotion Distribution by Job Category report, which details employee promotion distribution by various job category dimensions such as job code, position, and salary grade.
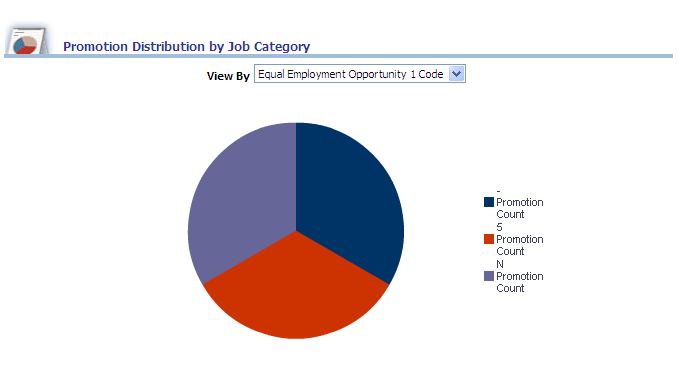
Image: Promotion Distribution by Job Category report
This example illustrates the fields and controls on the Promotion Distribution by Job Category report. You can find definitions for the fields and controls later on this page.
|
Pie Chart Data |
View By Filter |
|---|---|
|
The Promotion Distribution by Job Category pie chart displays Promotion Count data grouped by Equal Employment Opportunity 1 Code. Promotion count data can also be grouped by any of the following dimensions, depending on your View By filter selection:
Note: You can click on a pie slice to drill down to promotion count data for a particular dimension (such as department). |
Use this filter to view report results by:
|
|
Report Column / Measure Name |
Report Column / Measure Origin |
|---|---|
|
Equal Employment Opportunity 1 Code |
Jobcode (D_JOBCODE) Dimension |
|
Job Code |
Employee Job Code (D_EMPL_JOB) Dimension |
|
Job Family Description |
Jobcode (D_JOBCODE) Dimension |
|
Position |
Position (D_POS) Dimension |
|
Salary Grade Group |
Salary Grade Group (D_SALGRDGRP_VW) Dimension (D_DURATION) |
|
Department |
Department (D_DEPT) Dimension |
|
Location |
Location (D_LOCATION) Dimension |
|
Promotion Count |
Workforce (F_WORKFORCE) Fact |