Working with the OBIEE Lineage Dashboard
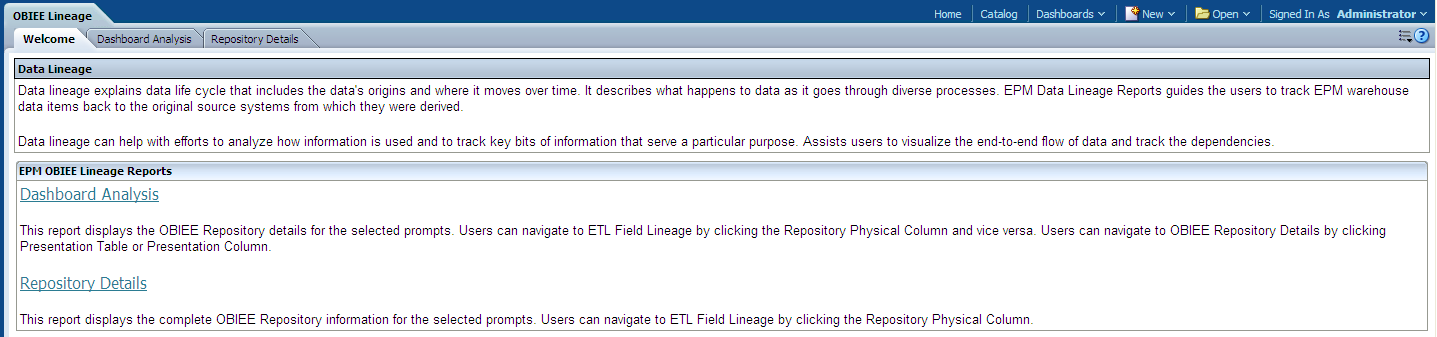
Use the OBIEE Lineage dashboard to obtain an overview of the relationships between selected dashboard and report data, and the Presentation and Physical layers within the OBIEE metadata repository.
Image: OBIEE Lineage dashboard
OBIEE Lineage dashboard
|
Usage |
Reports |
|---|---|
|
Provides an overview of the relationships between selected dashboard and report data, and the Presentation and Physical layers within the OBIEE metadata repository. |
This dashboard is comprised of the following pages:
Note: The Welcome page provides descriptions of the pages included in this dashboard and is not discussed in this documentation. |
For more information on the Physical, Business Model and Mapping, and Presentation layers within OBIEE, see Fusion Campus Solutions Intelligence Architecture and Oracle BI Administration Tool
Using the Dashboard Analysis Page
Access the Dashboard Analysis page, which enables you to analyze the relationships between selected dashboard and report data, and the Presentation and Physical layers within the OBIEE metadata repository.
Image: Dashboard Analysis page
Dashboard Analysis page

The following table provides column descriptions for the Dashboard Analysis page:
|
Column |
Description |
|---|---|
|
Dashboard |
Displays the name of the dashboard. |
|
Dashboard Page |
Displays the dashboard page associated with a dashboard. |
|
Report |
Displays the name of the report associated with a dashboard page. |
|
Subject Area |
Displays the subject area of the presentation table and presentation column used in the related report. |
|
Presentation Table |
Displays the name of the presentation table used by the related report. Click on a presentation table to access the Repository Details page and analyze the detailed relationships between the selected presentation table and the Business Model & Mapping layer and Physical layer information. |
|
Presentation Column |
Displays the name of the presentation column used by the related presentation table. Click on a presentation column to access the Repository Details page and analyze the detailed relationships between the selected presentation column and the Business Model & Mapping layer and Physical layer information. |
|
Physical Table |
Displays the name of the physical table underlying the related presentation table. |
|
Physical Column |
Displays the name of the physical column used by the related physical table. Click a physical column to access the Field Impact Analysis page and analyze the tables, ETL jobs, and EPM warehouses impacted by the selected column. |
Drilling in the Dashboard Analysis Page
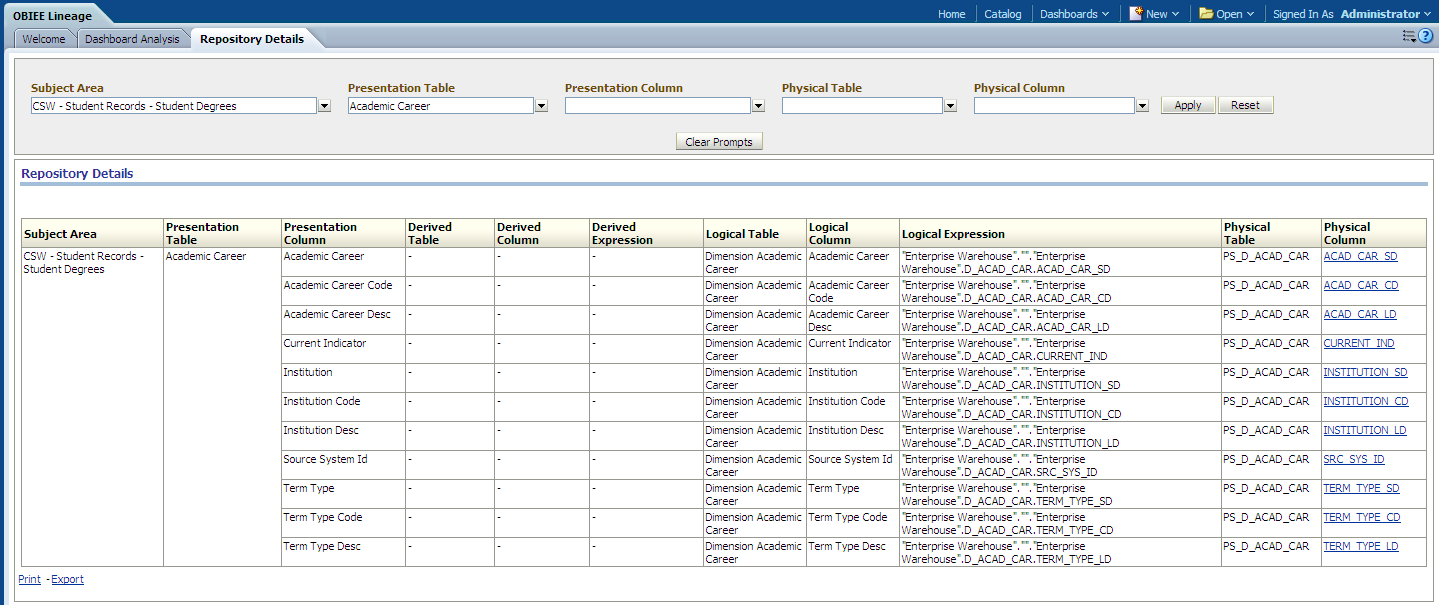
In the Dashboard Analysis page you can click a presentation table to access the Repository Details page and analyze the detail relationships between the selected presentation table and the Business Model & Mapping layer and Physical layer information. For example, the following page represents drill down information for the presentation table, Academic Career:
Image: Drilling in the Dashboard Analysis page (Repository Details page)
Drilling in the Dashboard Analysis page (Repository Details page)
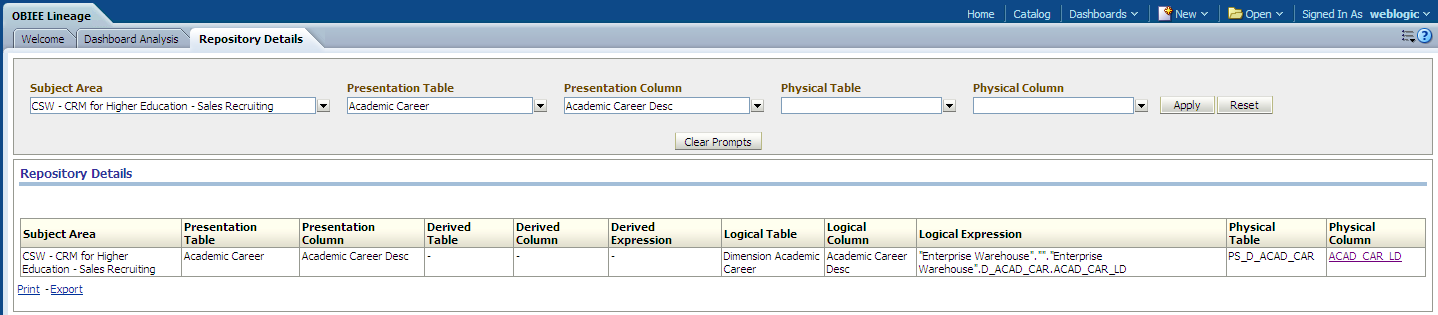
You can also click a presentation column to access the Repository Details page and analyze the detailed relationships between the selected presentation column and business model and the mapping layer and physical layer information. For example, the following page represents drill down information for the presentation column, Academic Career Desc:
Image: Drilling in the Dashboard Analysis page (Repository Details page)
Drilling in the Dashboard Analysis page (Repository Details page)
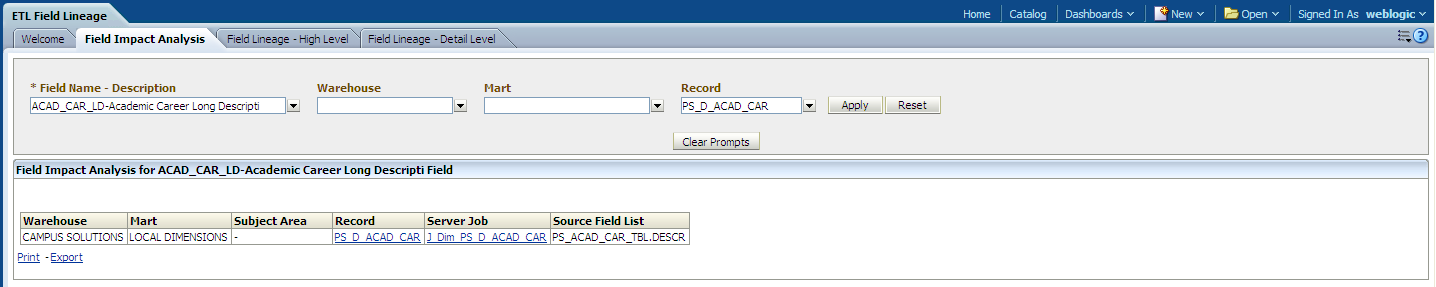
You can also click a physical column to access the Field Impact Analysis page and analyze the tables, ETL jobs, and EPM warehouses impacted by the selected column. For example, the following page represents drill down information for the physical column, ACAD_CAR_LD:
Image: Drilling in the Dashboard Analysis page (Field Impact Analysis page)
Drilling in the Dashboard Analysis page (Field Impact Analysis page)
Using the Repository Details Page
Access the Repository Details page, which enables you to analyze the detailed relationships between the Presentation layer and the Business Model & Mapping layer and Physical layer information.
Image: Repository Details page
Repository Details page
The following table provides column descriptions from the Repository Details page:
|
Column |
Description |
|---|---|
|
Subject Area |
Displays the subject area name. |
|
Presentation Table |
Displays the name of the presentation table associated with the subject area. |
|
Presentation Column |
Displays the name of the presentation column used by the related presentation table. |
|
Derived Table |
Displays the name of the derived table in the Business Model & Mapping Layer (if any). |
|
Derived Column |
Displays the name of the derived column for the derived table in the Business Model & Mapping Layer (if any). |
|
Derived Expression |
Displays the derived expression used to derive the Derived Column in the Business Model & Mapping Layer (if any). |
|
Logical Table |
Displays the logical table name in the Business Model & Mapping Layer that is associated with the related presentation column. |
|
Logical Column |
Displays the logical column name associated with the related logical table in the Business Model & Mapping Layer. |
|
Logical Expression |
Displays the logical expression used to derive the logical column in the Business Model & Mapping Layer. |
|
Physical Table |
Displays the physical table name associated with the related presentation column. |
|
Physical Column |
Displays the name of the physical column used by the related physical table. Click a physical column to access the Field Impact Analysis page and analyze the tables, ETL jobs, and EPM warehouses impacted by the selected column. |
Drilling in the Repository Details Page
In the Repository Details page you can click a physical column to analyze the tables, ETL jobs, and EPM warehouses impacted by the selected column. For example, the following page represents drill down information for the physical column, ACAD_CAR_LD:
Image: Drilling in the Repository Details page (Field Impact Analysis page)
Drilling in the Repository Details page (Field Impact Analysis page)