Setting Up Curve Interpolants
This section discusses how to define curve interpolants.
Pages Used to Set Up Curve Interpolants
|
Page Name |
Definition Name |
Navigation |
Usage |
|---|---|---|---|
|
Curve Interpolants |
YC_DEF_PNL |
|
Specify how Curve Generator calculates curves. |
|
Curve Interpolants-Notes |
YC_DEF_NOTES_PNL |
|
Enter setup notes. |
|
Currency Discount Factors |
FI_CURR_DF_TBL |
|
Define discount factors when calculating the net present value (NPV) on a set of cash flows. |
|
Currency Discount Factors — Notes |
FI_CURR_DF_NOTES |
|
Add notes to the discount factor definitions. |
Curve Interpolants Page
Use the Curve Interpolants page (YC_DEF_PNL) to specify how Curve Generator calculates curves.
Image: Curve Interpolants page
This example illustrates the fields and controls on the Curve Interpolants page. You can find definitions for the fields and controls later on this page.
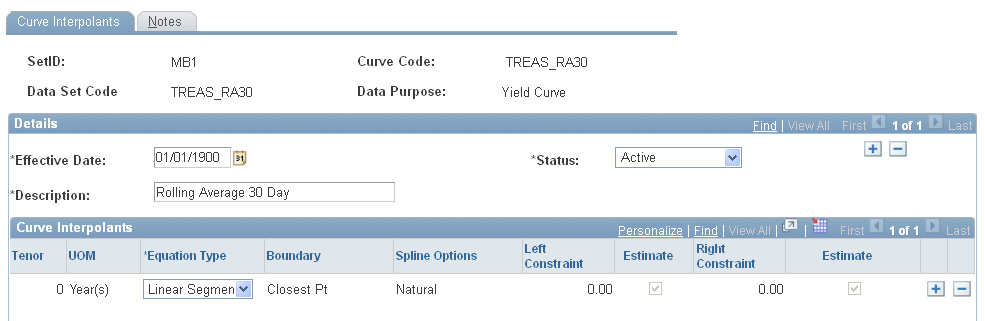
This page serves to associate the data set to the curve. Select a data set code and equation type. This grid tells the Curve Generator how to use the equation to calculate curves. Different interpolation algorithms can be used for different sections of the curve set.
For rolling averages, select the rolling average curve for Data Set Code (data set). If, for example, you set this to the Market Issue curve (TREAS_SET1 in the page shot above), the market issue points on the rolling average curve will reflect the base market data (TREAS_SET1) rather than the calculated rolling averages.
Specify the tenor and unit of measure (UOM).
If you need rates from a given yield curve within maturities that are shorter than those that are in the source data, indicate an overnight or short-term rate. This enables Curve Generator to interpolate the required values between the overnight or short-term rate and the selected source data.
Specify the curve interpolation method that you want to define.
Options are: Cubic Spline, Hermite Cubic, Linear Segment, orStep Function.
Indicate where you want terms to be spliced by defining the boundary.
If the tenor that you specify in a grid does not land on a data point, this field enables you to specify an alternate point to use (closest, prior, orbehind).
If you define this equation as a cubic spline interpolation, the Spline Option column appears.
Specify the way that you want the spline curve to handle the left and right endpoints of each curve set. Options are: Continuous Curl, Curvature Curl, Curvature Constraint, orSlope Constraint.
Select specific values for the slop or curvature at the left and right points, known as the constraints.
If you define the spline option as a continuous curl, you do not need to set up the right constraint.
If you specify this equation as a slope constraint, set up the estimates for left and right constraints.