Setting Up Deterministic Models
This section provides an overview of deterministic scenarios and discusses how to:
Set up the deterministic model.
Set up the shock model.
Set up the drift model.
Pages Used to Set Up Deterministic Models
|
Page Name |
Definition Name |
Navigation |
Usage |
|---|---|---|---|
|
Model Definition |
DT_MODEL_DEF_PNL |
|
Create a new deterministic interest rate model or modify an existing model. |
|
Deterministic Scenario - Notes |
DT_NOTES_PNL |
|
Enter set up notes. |
|
Shock Model |
DT_SH_TNR_SCPNL |
Click the Tenors button on the Deterministic Scenario - Model Definition page. |
Use this page to illustrate and create shaped curves under the shock model for instantaneous changes to the current term structure. |
|
Drift Model |
DT_DR_TNR_SCPNL |
Click the Tenors button on the Deterministic Scenario - Model Definition page. |
Use this page to illustrate and create shaped curves under the drift model for gradual changes to the current term structure. |
Understanding Deterministic Scenarios
The Deterministic Interest Rate Scenario Generator enables you to model an organization's exposure to interest rate risk. There are two general (deterministic) methods for modeling interest rate movements.
The Rate shock (shock model) enables you to model instantaneous changes to the market yield curve in an arbitrage-free scenario.
The Rate ramp. (drift model) employs the option allowing individual tenors on a yield curve to move gradually and independent of one another over a specified period of time.
The drift model does not ensure an arbitrage-free environment.
Shock Model
The shock model is an example of an arbitrage-free scenario that you can employ to model the financial institution's sensitivity to interest rate changes on the NPV of a portfolio. Use the entire yield curve (term structure) to ascertain the appropriate discount factors for future cash flows determined by the portfolio's makeup of on-balance sheet and off-balance sheet items. Use two methods for defining scenarios.
The parallel shift method enables you to define an instantaneous change to the term structure.
As a result of this shock, each point of the term structure is changed by the same amount.
The shaped curve method is also an instantaneous change but it enables you to define the new shape of the curve.
In this manner, the scenarios allow for things like twists, steepening of curves, flattening of curves, and so on. Included in shock model functionality is the ability to select different shock assumptions for different yield curves. This enables you to determine the sensitivity analysis for basis risk (For example, two yield curves that move in different fashions).
Regulators require financial institutions to illustrate the impact on their portfolios due to adverse rate changes. This is accomplished by subjecting the current portfolio to a series of rate shocks (For example, immediate rate changes of 100–400 basis points). This technique illustrates both the earnings that are at risk and the value that is at risk for a financial institution's portfolio. These techniques are effective tools for both monthly review of the entire organization's book and daily analysis of smaller trading books. Regulators require that the financial institution's risk capital be sufficient to withstand a rate shock scenario. Although an actual market rate shock is unlikely, the shock model does provide a relative measure of the financial institution's risk exposure while satisfying regulator's requirements.
Drift Model
Use the drift model method to model net interest income (NII). NII focuses on the spread between income from financial products that are offered and the match funded liabilities. The drift model method enables you to independently define future values of assorted tenors from the same yield curve.
Arbitrage-free forward rates are not calculated in drift models. This is useful for creating inverted yield curves or modeling gradual changes to the term structure, curve twists, and curve shifts (nonparallel shifts).
Note: It is assumed that the analyst conducts the analyses with the understanding that the specified series of term-structures are no longer arbitrage-free with respect to the current term-structure.
Model Definition Page
Use the Model Definition page (DT_MODEL_DEF_PNL) to create a new deterministic interest rate model or modify an existing model.
Image: Model Definition page
This example illustrates the fields and controls on the Model Definition page. You can find definitions for the fields and controls later on this page.
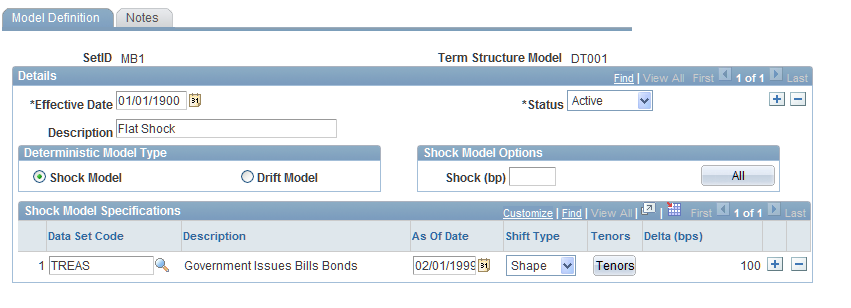
Specify this model to be either a shock model or a drift model:
If you selected a shock model, enter the value of interest rate shock in basis points in the Shock (bp) field.
For example, 100 indicates a 100 basis-point shift upward in rates for the selected yield curve. Similarly, -100 indicates a 100 basis-point drop in rates to the selected yield curve. Then, click theAll button to apply the shock value to all data set codes in the grid. The default value is of a parallel shift yield.
If you select a drift model, enter the schedule (daily, monthly, or yearly) for which future yield curves are built.
Enter values up to five digits. All three fields cannot be left blank. When the rule is processed, the number of daily time steps is first considered, then the monthly time steps, then yearly.
Next, enter the model specifications. Fields that may appear are:
Shock Model Page
Use the Shock Model page (DT_SH_TNR_SCPNL) to use this page to illustrate and create shaped curves under the shock model for instantaneous changes to the current term structure.
You supply the change to the rate in basis points next to the designated tenor shift. As you supply the Delta (bps) (delta basis points) values, the instantaneous yield curve shift scenario that is plotted in green is charted alongside the base scenario plot. You have the flexibility of designating shaped shift types (besides a parallel shift) across all tenors. Click theReset button to reset the curve shift scenario plot and data points. ClickOK to accept the changes to the shock model.
Drift Model Page
Use the Drift Model page (DT_DR_TNR_SCPNL) to use this page to illustrate and create shaped curves under the drift model for gradual changes to the current term structure.
Image: Drift Model page
This example illustrates the fields and controls on the Drift Model page. You can find definitions for the fields and controls later on this page.
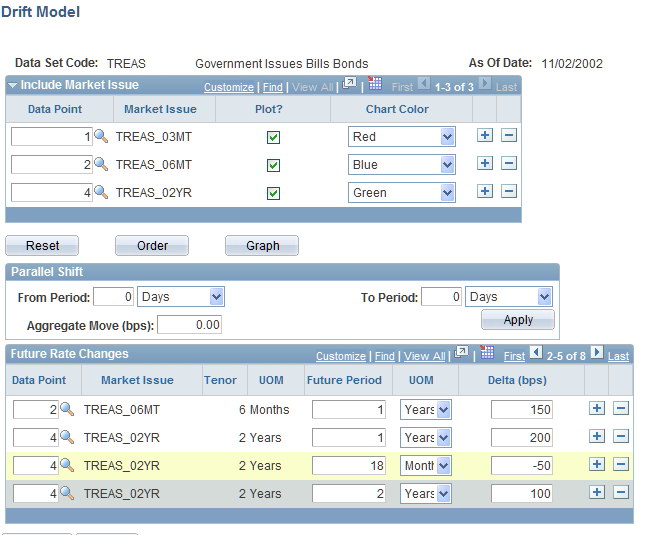
Set up the Market Issues that enable you to establish which data points you want to plot. Specify source data in theData Point field. Include or exclude data points using thePlot check box. Click theReset button to clear all the selected data points. UseOrder to change the order of the data points that are plotted.
The Futures Rate Changes group box enables you to establish the future rate movements of the data points that you set up in theMarket Issues group box. Select data points to which you want to apply future rate changes. Then, establish a future period by using theFuture Period andUOM (unit of measure) fields and enter the basis point change in theDelta (bps) field.
Click OK to accept the changes.
You also have the option of creating a parallel shift in the drift model by using the data points that you previously selected on the Include Market Issue grid. Just select the period of time that you want to apply the shift in theParallel Shift group box (rather than creating a series individual future period points in theFuture Rate Changes group box) and indicate the value of the aggregate move in basis points. This shift applies to all data points that you previously selected on theInclude Market Issue grid. Then, click theApply button.
Click the Graph button to generate a graphical representation of the drift model.