Setting Up the Pricing Index Model
This section provides an overview of the Pricing Index Model and discusses how to:
Set up the Pricing Index Model.
Adjust the Pricing Index.
Define the Pricing Index step functions.
To set up global definitions for a particular pricing model, you need to create it within the Price Index Model, then specify which indexes the model uses. You can do this on the Price Index page. The Price Index page enables you to define a target index that specifies the characteristics of the pricing rule. For example, you can define whether the target index behaves differently in declining rate environments versus rising environments or whether it is a smooth or step function. Also, the calculated value of the target index (as defined by the index equations) is validated against the key underlying rate for reasonableness. The adjusted target index is constrained by a range that is defined as a fixed spread against the key underlying rate.
Pages Used to Set Up the Pricing Index Model
|
Page Name |
Definition Name |
Navigation |
Usage |
|---|---|---|---|
|
Price Index |
FI_PRINDX_RULE |
|
Select whether you want the target index to be defined as an equation or a single-point from a specified yield curve. |
|
Index Adjustment |
FI_PRINDX_ADJ |
|
Sets up the index adjustments. |
|
Step Function |
FI_PRINDX_STEP |
|
Specifies a step function (if applicable). |
|
Pricing Index - Notes |
FI_PRINDX_NOTES |
|
Enter setup notes. |
Understanding the Pricing Index Model
An appropriate product rate forecast is necessary to capture reasonable interest rate spreads between future products and market rates (and between asset and liability products themselves) in all simulated rate environments. The Pricing Index Model enables you to model future product pricing rates by using market interest rates (for example, treasury, LIBOR, or derived yield curves) as inputs for user-defined product-pricing algorithms. Product rates can be derived in market or deterministic scenarios. The predicted rates can then be used:
By the Cash Flow Generator application engine to calculate future product rates for variable rate products.
The Cash Flow Generator uses these refinance rates (future product rates) to set the repricing rate on variable rate products and to ascertain the level of prepayment and deposit runoff. For example, the Cash Flow Generator uses the Pricing Index Model rates for calculation of future payment amounts on adjustable rate mortgages.
By the Behavioral Models to calculate future prepay and runoff rates.
These models use future product rates for the calculation of their respective prepayment or deposit runoff rates.
To assign future product rates to forecasted volumes that are generated by Portfolio Forecast.
Use the Pricing Index Model to define indexes upon which the rate that is paid or charged for an individual product is based. This may be as simple as identifying a single rate from a yield curve (for example, the seven-year CMT from the U.S. Treasury curve) or a combination of rates from different yield curves. You can include other defining variables, such as a lag component or the addition or subtraction of rate spreads in the model.
The Pricing Index Model is scenario aware. For example, if the index rate is calculated from a treasury rate and the treasury curve is shocked by 100 basis points, the Pricing Index Model uses the shocked value as its input. The only requirement is that you specify the appropriate rate assumption for the scenario definition. There is no need to redefine Pricing Index Models in order to run a shocked scenario impacting all product rates. (The supported scenarios are market and deterministic)
The Pricing Index Model can use the Function Evaluator for calculating formulas leading to assumptions in building pro forma financial statements.
This section discusses:
Pricing Index Model definitions.
Target index definition.
Smooth and step functions.
Index adjustments.
Key underlying interest rates.
Deltas.
Pricing Index Model Concepts
Whether you create a model from an index or a yield curve, you can define pricing models that behave differently in a rising rate environment and in a declining rate environment. For example, you can define a systematic widening (or narrowing) of spreads in a rising (or declining) rate environment. You also can define indexes that respond continuously to the movement of the underlying interest rates or that move as a step function. The creation of a step function index models the pricing behavior of administered rates (that is, money market accounts, demand deposit accounts, and so forth). You can also define constraints in the pricing model that ensure reasonable spread relationships in extreme interest rate environments.
Image: Price index concepts illustrated
The following illustration represents these concepts. Here, the price index is evaluated against key underlying values in a smooth function. The unadjusted target value is evaluated against the key underlying rate for reasonableness. This test can be defined as a spread against the key underlying. This test ensures that the unadjusted target value never falls out of this reasonableness range, regardless of the absolute level of interest rates.
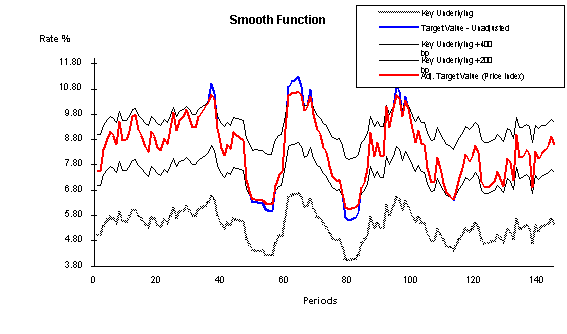
The red line (adj. target value) is the most important to follow. This represents the price index after adjustments; it remains within a defined spread range from the key underlying value (for this example, they are set at +400 and +200 bp). In this case, the adjusted target value is the price index because the value remains within the defined constraints. The blue line represents the unadjusted target value before evaluation against the constraints. In the periods where there is no blue line visible, the red line and the blue line are equal and there is no constraint violation. Where the blue line is visible, it exceeds the constraints and therefore cannot be the price index. The gray line is the original key underlying value that does not have any constraints.
Target Index Definition
The Target Index page enables you to choose whether you want the target index to be defined as an equation or a single point from a specified yield curve. Target indexes that are defined from two separate equations can be defined for a rising rate environment and a declining rate environment, or one function can be used for both rate environments. The determination of whether to use the upward or downward equation is based on the change in the key underlying value. Options are Upward = Downward to create a single equation orUpward < > Downward to create two different equations for the respective change in direction. UseSingle Point Index for creating a price index that is keyed to one rate from a specified yield curve.
Smooth and Step Functions
The Index Adjustment page enables you to assign a step function to the adjusted target index. Select Smooth if you want a price index that continuously moves in response to the movement of the target index. SelectStep (for step function) if you want the price index to move only when the spread between the price index and the target index is in excess of a specific threshold for a defined period.
Image: Smooth and step functions
Movement of the step function is defined by the criteria in a range that you specify that affects a change in the price index value. The step function range is defined as a minimum and maximum spread relative to the adjusted target index. As long as the price index value stays within this range, it does not change. If the price index drifts below or above the range (for a consecutive period of time that is also defined by the user) it is adjusted upward or downward. The level of adjustment may be defined to be an absolute move or a percentage of the difference between the current rate and the target index. The following graph illustrates this concept:
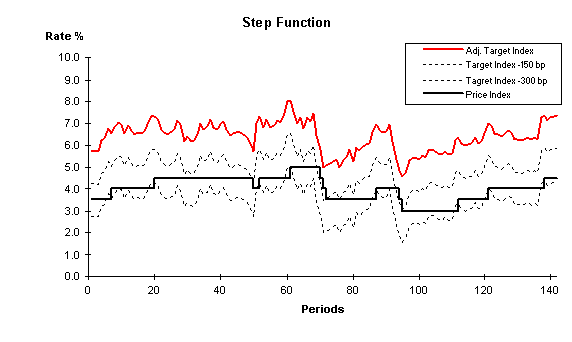
The solid, red line represents the price index (adjusted target index) that you define in the Price Index page after it is evaluated against the key underlying rate that is defined in the Index Adjustment setup page. The dotted lines represent the range that you define as the allowable spread between the adjusted target index and the current index value (product rate). The solid, angular line is the way that the adjusted price index responds to the step range and adjusted target index.
Index Adjustments
The Index Adjustment page enables you to define the parameters that are evaluated against the target index for a reasonableness test.
The target index is the result of the equation or the single point rate as defined in the previous page. The target index may be based upon a single forward rate from a single yield curve, or it may be a blend of multiple rates from more than one yield curve. The target index is evaluated for reasonableness against a key underlying rate The target index changes as a result of changes in the equation parameters; however, sometimes certain changes can lead to values that are considered unrealistic. For example, the equation is defined as three-month LIBOR raised to the 1.25 power to capture an increased spread dynamic in higher rate environments. This might be fine when three-month LIBOR is 4 percent, returning a target index rate of 5.65 percent. However, this may not work well when three-month LIBOR is 8 percent, resulting in a target index of 13.45 percent. In this example, it may be desirable to ensure that the index is never greater than three-month LIBOR plus 300 basis points. The Index Adjustment page enables you to define the parameters that test the target index for reasonableness in all rate environments and constrain the value based on those tests.
Key Underlying Index Rates
(Appears only if you specify Index in theKey Rate Type field). Specify the type of key underlying index that you want. Index key rate types are available for you to set up adjustment curves instead of using market rates for target rate adjustments. For example, let's say that the benchmark for setting product rates is the Prime Rate or 11th District COFI (cost of funds index). These must be defined as an index because they are not market-traded rates or instruments that can be used to construct a yield curve. Consequently, if you want to ensure that the product rates (defined by a function) are always within a reasonable benchmark, this is how you accomplish that.
Note: An index ID cannot be defined as the key underlying rate for itself.
Deltas
This field captures the rate change rule that is applied to the price index in a declining rate environment. This field may appear as Downward Delta (bp) orDownward Percent (%) depending on which option you chose in theAdjustment Method field. The downward delta is the basis point change subtracted from the price index if the threshold-interval test is true. The downward percentage is the relative basis point change subtracted from the price index if the threshold-interval test is true. It is calculated as a percentage of the spread between the price index and the target index.
Captures the rate change rule that is applied to the price index in a rising rate environment. This field may appear as Upward Delta (bp) orUpward Percent (%) depending on which option you chose in theAdjustment Method field. The upward delta is the basis point change added to the price index if the threshold-interval test is true. The upward percentage is the relative basis point change added to the price index if the threshold-interval test is true. It is calculated as a percentage of the difference between the price index and the target index.
Price Index Page
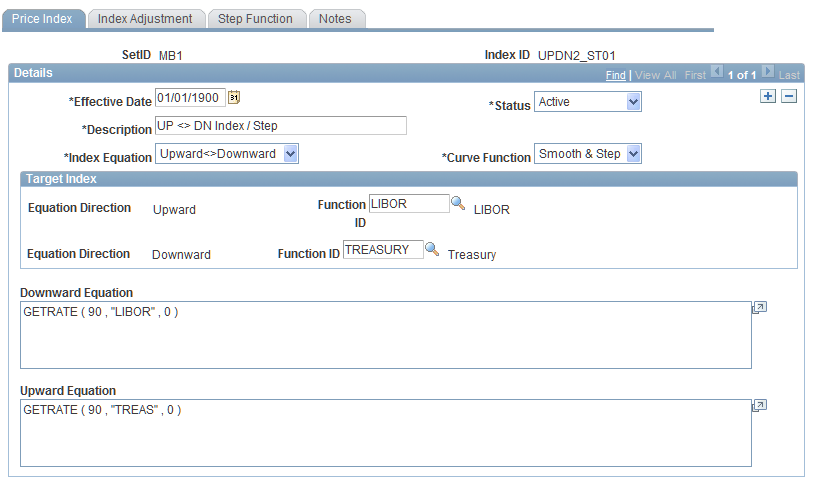
Use the Price Index page (FI_PRINDX_RULE) to select whether you want the target index to be defined as an equation or a single-point from a specified yield curve.
Image: Price Index page
This example illustrates the fields and controls on the Price Index page . You can find definitions for the fields and controls later on this page.
Note: This is a dynamic page. The options that you choose in the fields may activate or deactivate additional pages and fields.
Set up general price index information. Define the target index by selecting Upward <> Downward (for two equations), Upward = Downward (for one equation), orSingle Point Index (for yield curve rate) in the Index Equation field. Select a curve function. Options areSmooth orSmooth & Step.
Set up specific target index information. These are the fields that may be displayed depending on the target index that you define:
If you define the target index by using equations, you need to set up the Index Adjustment page. (Skip this process if you use yield curves to define the index.) If not, you can optionally enter setup notes on the Notes page.
Index Adjustment Page
Use the Index Adjustment page (FI_PRINDX_ADJ) to sets up the index adjustments.
Image: Index Adjustment Page
This example illustrates the fields and controls on the Index Adjustment Page. You can find definitions for the fields and controls later on this page.
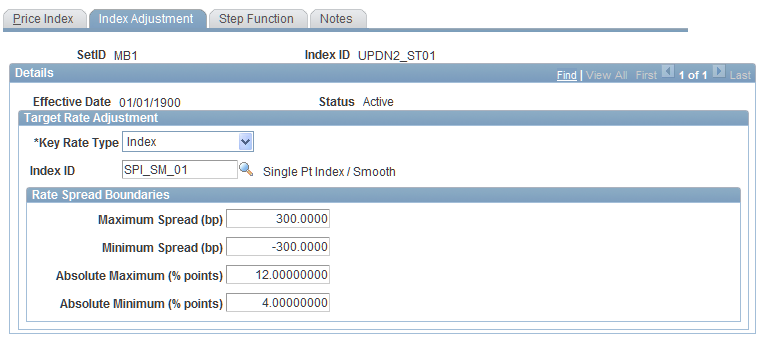
On the Index Adjustment page, specify the type of key underlying value that you want the target index evaluated against by specifying a key rate type. Options are Yield Curve orIndex.
If you select Yield Curve, specify the corresponding yield curve code and maturity.
If you select Index, specify the corresponding index ID.
Then, enter values in basis points for the upper and lower boundaries of the target index spread in the maximum and minimum spread fields. Enter values in percentage points for the maximum and minimum rates of the target index over its entire life in the absolute maximum and minimum fields. When you are finished, set up the Step Functions page.
Step Function Page
Use the Step Function page (FI_PRINDX_STEP) to specifies a step function (if applicable).
Image: Step Function Page
This example illustrates the fields and controls on the Step Function Page. You can find definitions for the fields and controls later on this page.
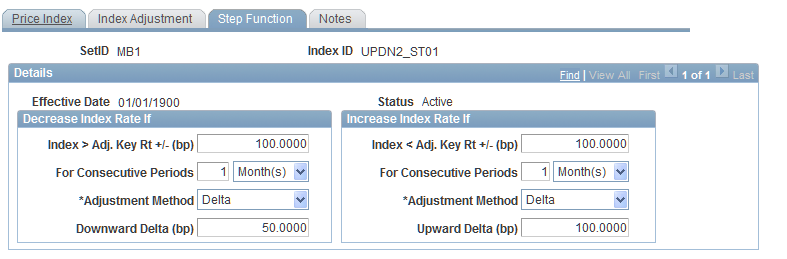
Set up the Step Functions page for both equation and yield-curve defined target indexes. Specify the upper and lower boundaries of the spread threshold in basis points. Do this in the Index <> Adj. Key Rt +- (bp) fields. Use the decrease column for upper boundaries and the increase column for lower boundaries. Values may be positive or negative.
In the For Consecutive Periods fields, specify the interval of consecutive periods for which the threshold test must be true to initiate a change in the price index (for both upper and lower boundaries).
In the Adjustment Method fields, indicate the manner in which the step function adjusts to fluctuations in interest rates and periods. SelectDelta for an absolute change or% of Difference for a relative change in the price index if the threshold test and the interval test are true.
In the Delta fields, specify the rate change rule that is applied to the price index in a declining (Downward Delta) or rising (Upward Delta) environment.