Using the Migration Matrix Utility
Use the migration matrix utility to analyze changes in instrument, facility, or collateral attributes. The migration matrix utility enables you to evaluate how selected financial instruments in a set of data change over time. The term migration matrix refers to the fact that the analytic results are arranged in a grid, with the starting value attributes arrayed along the X axis and the ending values shown along the Y. The results shown at the intersection can be shown as either an instrument count or a percentage.
Some representative questions that this utility is designed to answer are:
Over the past year, what percentage of the loans in my portfolio that started with an "A" risk rating ended up in default?
Over the past month, how many instruments in my portfolio went from 60 days delinquent to current?
Of all the loans that ended up in default as of the end of the quarter, what percentage started as delinquent?
Page Used to Use the Migration Matrix Utility
|
Page Name |
Definition Name |
Navigation |
Usage |
|---|---|---|---|
|
FSI Migration Matrix |
RWC_RISK_MIGR_PAGE |
|
View the changes in selected attributes for a set of financial instruments. |
FSI Migration Matrix Page
Use the FSI Migration Matrix page (RWC_RISK_MIGR_PAGE) to view the changes in selected attributes for a set of financial instruments.
Image: FSI Migration Matrix page
This example illustrates the fields and controls on the FSI Migration Matrix page. You can find definitions for the fields and controls later on this page.
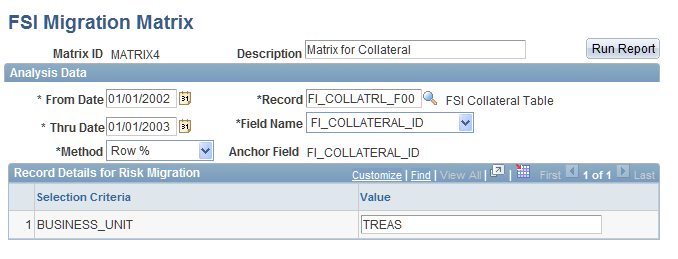
Click Run Report to view the resulting grid: