Analyzing Consolidation Runs
This section provides an overview of consolidation run analysis and discusses how to:
Specify criteria for a consolidation run analysis.
Include additional dimensions.
View the analysis results.
Compare the details by ChartField.
Pages Used to Analyze Consolidation Runs
|
Page Name |
Definition Name |
Navigation |
Usage |
|---|---|---|---|
|
Consolidation Run Analysis - Criteria |
GC_DIFF_INQ_PAGE |
|
Specify the criteria to compare processing runs. |
|
Consolidation Run Analysis - Results |
GC_DIFF_INQ_PAGE |
Click Go on the Consolidation Run Analysis - Criteria page. |
View the differences between processing runs. |
|
Additional Dimensions |
GC_DIFF_SEL_DIM |
Click Additional Dimensions on the Consolidation Run Analysis page. |
Select which dimension data to view. |
|
Run Analysis By Chartfields |
GC_DIFF_INQ_DTL |
Click an amount on the Consolidation Run Analysis - Results page. |
View differences between processing runs for the selected amount. |
Understanding Consolidation Run Analysis
The consolidation run analysis component enables you to view the differences between two consolidation processing runs based on the same criteria (consolidation business unit, scenario, fiscal year, and accounting period), so that you can determine if and why there are differences, and decide whether you need to reprocess. This could be the case, for example, if you process by using the top node of the consolidation tree, and then process a lower level node, or if changes were made to the source subsidiary data or consolidation rules since the prior run.
Note: To use this feature, you must run consolidation processes with the Get Prior Run Differences option selected.
Consolidation Run Analysis - Criteria Page
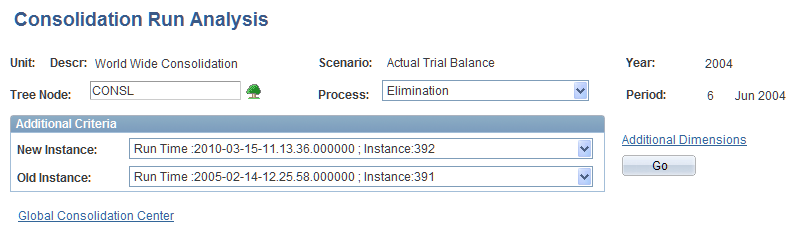
Use the Consolidation Run Analysis - Criteria page (GC_DIFF_INQ_PAGE) to specify the criteria to compare processing runs.
Image: Consolidation Run Analysis - Criteria page
This example illustrates the fields and controls on the Consolidation Run Analysis - Criteria page. You can find definitions for the fields and controls later on this page.
Additional Dimensions Page
Use the Additional Dimensions page (GC_DIFF_SEL_DIM) to select which dimension data to view.
Image: Additional Dimensions page
This example illustrates the fields and controls on the Additional Dimensions page. You can find definitions for the fields and controls later on this page.
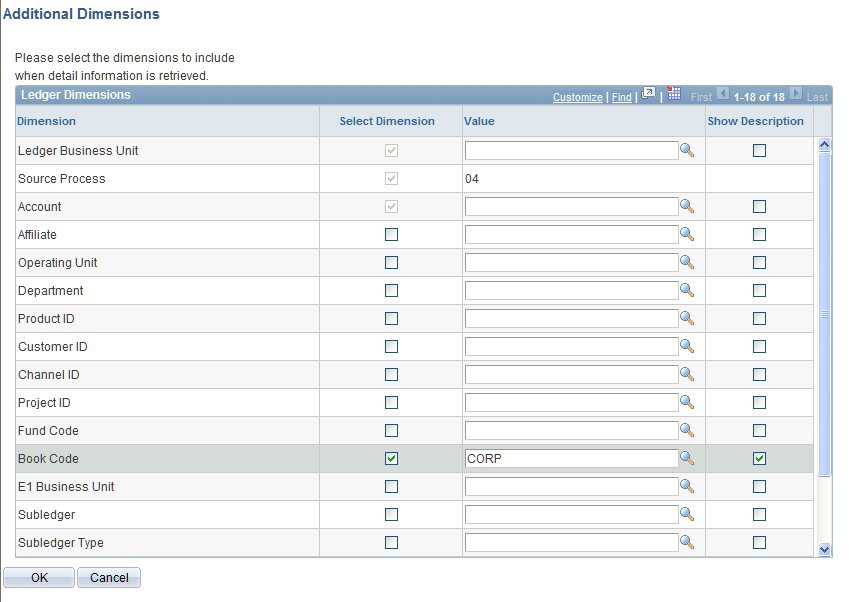
The dimensions that are included because of the run parameters that you specified are display-only and already selected.
Consolidation Run Analysis - Results Page
Use the Consolidation Run Analysis - Results page (GC_DIFF_INQ_PAGE) to view the differences between processing runs.
Image: Consolidation Run Analysis - Results page
This example illustrates the fields and controls on the Consolidation Run Analysis - Results page. You can find definitions for the fields and controls later on this page.
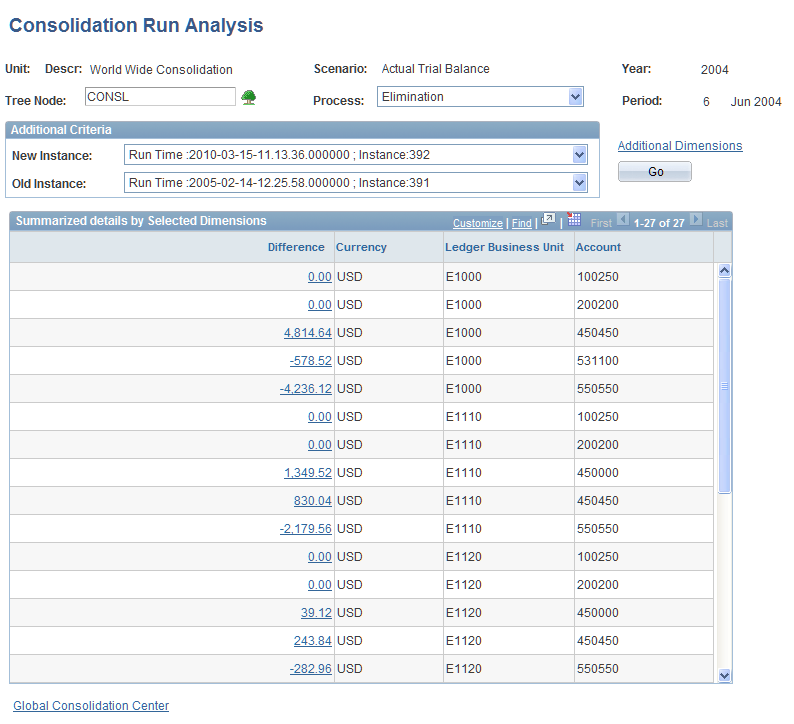
The results of the run analysis appear in the Summarized details by Selected Dimensions grid. The amount shown for each row is the difference between runs for the selected dimensions, which is derived by subtracting the ChartField balances in the old instance from the new instance. Only those ChartFields with balances that differ, or that exist in one run but not the other, appear in the grid.
Click a difference amount to access the Run Analysis by ChartFields page, where you can view the details that comprise the amount.
Run Analysis By Chartfields Page
Use the Run Analysis By Chartfields page (GC_DIFF_INQ_DTL) to view differences between processing runs for the selected amount.
Image: Run Analysis By Chartfields page
This example illustrates the fields and controls on the Run Analysis By Chartfields page. You can find definitions for the fields and controls later on this page.
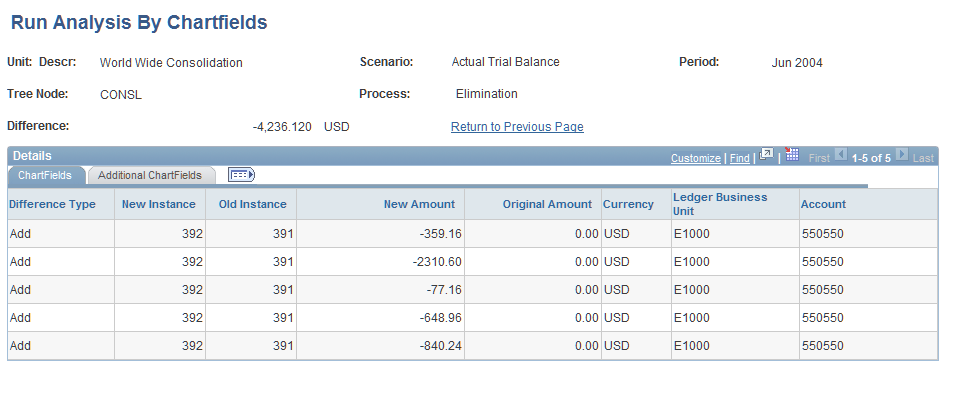
This page shows the ChartField details for the two compared runs. This information appears in the grid:
Select the Additional ChartFields tab to view columns for all ChartFields.