Understanding Portfolio Analysis
Several elements within the Project Portfolio Management application play a part in portfolio analysis:
Project portfolios.
A project portfolio tree.
Measures and dimensions.
The Portfolio Analysis component (BC_PORTFLIO_VIEW).
Project Portfolios
For the purposes of the Project Portfolio Management application, a portfolio defines a group of related projects and project requests, and this documentation uses the term project portfolios to refer to these portfolios. Portfolios are created by using the Portfolio Definition component (BC_PORTFOLIO_DFN).
The steps to set up a project portfolio are:
Create the portfolios, using the Portfolio Definition page.
Using the Portfolio Definition - Dimension Member Selection page, specify which projects and project requests to include in the portfolio, using one of these methods:
Specify each project or project request individually, by selecting its ID.
Define a rule that retrieves the projects.
Use the Dim Member Select component (BC_KPI_FILTER) pages to define the rule.
Create your project portfolio tree.
As you define each node, select the portfolio ID to use for that node.
Project Portfolio Tree
A project portfolio tree depicts the hierarchical relationship of project portfolios within your organization. For example, you can establish a tree where the root node represents all corporate projects, the next level represents departments or regions, and the lowest level is made up of project portfolios categorized by functional grouping, such as sales projects, finance projects, and so on. You must establish project portfolios before you can define a project portfolio tree.
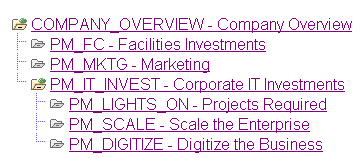
The PORTFOLIO_PPK tree structure is required for any project portfolio trees that you create. The tree must be a node-oriented (winter) tree. Each tree node within a project portfolio tree must be a defined portfolio. The nodes at the lowest level of the tree represent portfolios of projects and project requests, those at higher levels represent the organizational categories within which you group your project portfolios, and the points at which the project data is summarized. The illustration below shows an example of the project portfolio tree, PORTFOLIO_DEMO, that is delivered with the demo database.
Image: PORTFOLIO_DEMO tree
This example illustrates the fields and controls on the PORTFOLIO_DEMO tree. You can find definitions for the fields and controls later on this page.
Note: By definition, every portfolio requires a dimension member (a project request ID or project ID in the case of project portfolios). Therefore, when you define a portfolio that will be used for a summary node, it must have at least one project ID or project request ID associated with it. For portfolio analysis the system considers only the project requests and projects that are associated with nodes at the lowest level of the tree (the terminal nodes). The system excludes any projects and project requests associated with summary level nodes; they don't appear on the Portfolio Analysis page, nor is their data used to compute aggregated results.
Measures and Dimensions
Measures and dimensions are the project and project request data that is available to be analyzed by using the Portfolio Analysis page. Measures are data from numeric-based fields, such as estimated costs and return on investment, while dimensions are data from character-based fields, such as project owner and requesting department. Measures and dimensions are established by using the Define Measures/Dimensions page. These measures and dimensions comprise the list of values that are available to use as data for an analysis chart. Measures and dimensions are established at the system level, and once defined, are available for all users when using the Portfolio Analysis component.
The Portfolio Analysis Component
The Portfolio Analysis component displays a chart and lists the values of the measure and dimension data for the projects and project requests that are associated with the terminal nodes of a project portfolio tree. The component includes a section for configuring the chart, an interactive view of the project portfolio tree, the generated chart, and a grid that contains two tabs—one that displays the values for the charted project portfolios, and one that displays the values for up to four additional measures. These additional measures can include key project metrics that you wish to analyze but choose not to include in the chart; they are established per user by using the Additional Portfolio Measures page.
Using this page, you navigate through the project portfolio tree to view the data associated with the selected node. If the selected node has nodes that are subordinate to it, the data that appears is aggregated from the immediate subordinates of that node using the summarization rules specified for that dimension or measure. If the selected node has no subordinates, then the data that is viewed will be for each of the projects and project requests within that portfolio.
Each user can save their own configured analysis "views", and specify which view is the default view. To examine a particular set of portfolios or project requests you can also selectively choose which to chart.
The following chart types are provided:
Line.
Bar (two dimensional or three dimensional).
Stacked bar (two dimensional or three dimensional).
Pie (two dimensional or three dimensional).
Bubble.
Each chart type has different data and label requirements and options.