Comparing Current Pay Structures With New Target Rates
This section provides an overview of the pay structure compare process and discusses how to:
View final market compensation scenario data.
View salary plan gap data.
Pages Used to Compare Current Pay Structures With New Target Rates
|
Page Name |
Definition Name |
Navigation |
Usage |
|---|---|---|---|
|
Review New Market Rate |
WA_MKT_RATE_VW |
|
View the new target rate data for a job code. |
|
Salary Plan Gap |
WA_MKT_STR_CUR_INQ |
|
View a comparison of the target market rates against the midpoint of the current pay range for all job codes in a particular salary administration plan. You see the variance expressed as an amount and a percentage. |
Understanding the Pay Structure Compare Process
After you approve and publish your new target market rates, and the results are stored in the WA_MKT_RATE_TBL table, compare the target market rates to your current base pay structure and workforce compensation. Determine whether your current base pay structure, or workforce compensation, is in alignment with your new targets, or whether they need to be adjusted. You can:
Review the new target rate data, using the Review New Market Rate page.
Compare the target rates to the midpoints of your current base pay structure, using the Salary Plan Gap page.
Review New Market Rate Page
Use the Review New Market Rate page (WA_MKT_RATE_VW) to view the new target rate data for a job code.
Image: Review New Market Rate page
This example illustrates the fields and controls on the Review New Market Rate page. You can find definitions for the fields and controls later on this page.
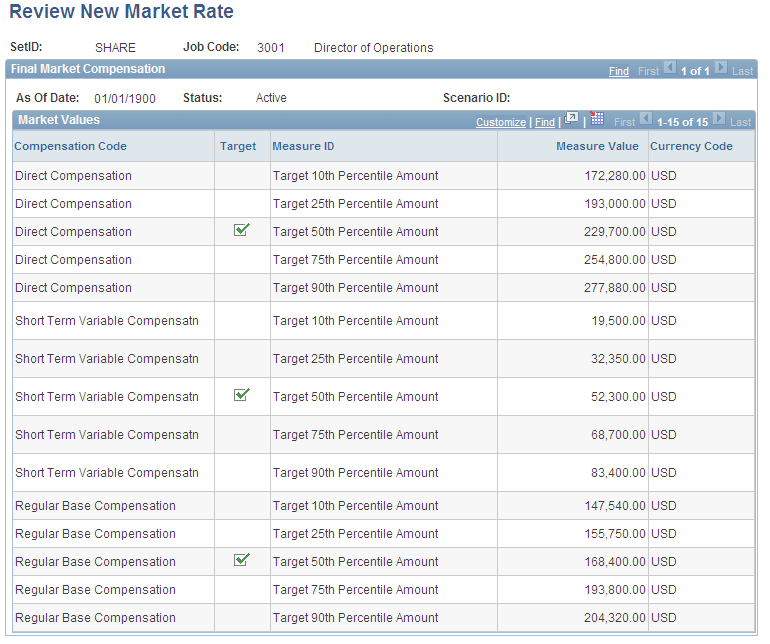
Use this page to view the compensation codes and associated measures and measure values for a particular scenario ID and job code.
Salary Plan Gap Page
Use the Salary Plan Gap page (WA_MKT_STR_CUR_INQ) to view a comparison of the target market rates against the midpoint of the current pay range for all job codes in a particular salary administration plan.
You see the variance expressed as an amount and a percentage.
Image: Salary Plan Gap page
This example illustrates the fields and controls on the Salary Plan Gap page. You can find definitions for the fields and controls later on this page.
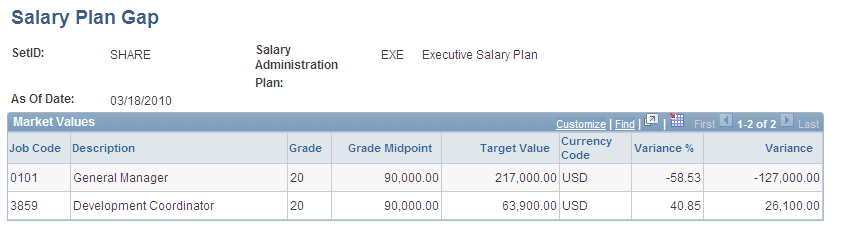
Use this page to view a comparison of the compensation target rates against the midpoint of the range for the current salary grade.
For a particular salary plan, view the grade midpoint and target value for each job code and grade. The variance of the grade midpoint from the target value appears as a percentage amount. A positive value indicates that the grade midpoint exceeds the target value. A negative value indicates that the grade midpoint is below the target value.