Reviewing and Analyzing a Compensation Scenario
This section provides an overview of compensation scenario review and analysis and discusses how to:
Review results of data elements applied to a scenario.
Review merit matrix table setup.
Review pay rules setup.
Review compensation scenario.
Pages Used to Review and Analyze Your Compensation Scenario
|
Page Name |
Definition Name |
Navigation |
Usage |
|---|---|---|---|
|
Review Data Elements |
WA_ELEM_INQ |
|
Review the results of the data elements included in a scenario. |
|
Base Pay Rule |
WA_CP_BP_INQ |
Workforce Analytics, Compensation Strategy, Analyze and Approve, Review Rules, Base Pay Rule |
Review the compensation rules setup for base pay rules. |
|
Variable Pay Rule |
WA_CP_VC_INQ |
Workforce Analytics, Compensation Strategy, Analyze and Approve, Review Rules, Variable Pay Rule |
Review the compensation rules setup for variable pay rules. |
|
Compensation Scenario Summary |
WA_CP_ACE_BUD_TOT |
Workforce Analytics, Compensation Strategy, Analyze and Approve, Analyze and Alter Scenario, Compensation Scenario Summary |
Review a summary of the employer expenses versus employee values for a compensation planning scenario. |
|
Budget Plan |
WA_CP_ACE_BUD_ALT |
Workforce Analytics, Compensation Strategy, Analyze and Approve, Analyze and Alter Scenario, Budget Plan |
Review and alter the compensation allocations in the scenario across the budget plan dimension. |
|
Compensation Rule |
WA_CP_ACE_RULE_ALT |
Workforce Analytics, Compensation Strategy, Analyze and Approve, Analyze and Alter Scenario, Compensation Rule |
Review and alter the compensation allocations in the scenario across the budget plan and compensation rule dimensions. |
|
Group and Plan |
WA_CP_ACE_BDGR_ALT |
Workforce Analytics, Compensation Strategy, Analyze and Approve, Analyze and Alter Scenario, Group and Plan |
Review and alter the compensation allocations in the scenario across the eligibility group and budget plan dimensions. |
|
Group and Rule |
WA_CP_ACE_RUGR_ALT |
Workforce Analytics, Compensation Strategy, Analyze and Approve, Analyze and Alter Scenario, Group and Rule |
Review and alter the compensation allocations in the scenario across the eligibility group and compensation rule dimensions. |
|
Department and Plan |
WA_CP_ACE_BDDP_ALT |
Workforce Analytics, Compensation Strategy, Analyze and Approve, Analyze and Alter Scenario, Department and Plan |
Review and alter the compensation allocations in the scenario across the department and budget plan dimensions. |
|
Department and Rule |
WA_CP_ACE_RUDP_ALT |
Workforce Analytics, Compensation Strategy, Analyze and Approve, Analyze and Alter Scenario, Department and Rule |
Review and alter the compensation allocations in the scenario across the department and compensation rule dimensions. |
|
Employee and Plan |
WA_CP_ACE_BDEM_ALT |
Workforce Analytics, Compensation Strategy, Analyze and Approve, Analyze and Alter Scenario, Employee and Plan |
Review and alter the compensation allocations in the scenario across the employee and budget plan dimensions. |
|
Employee and Rule |
WA_CP_ACE_RUEM_ALT |
Workforce Analytics, Compensation Strategy, Analyze and Approve, Analyze and Alter Scenario, Employee and Rule |
Review and alter the compensation allocations in the scenario across the employee and compensation rule dimensions. |
Understanding Compensation Scenario Review and Analysis
By generating a Compensation Planning and Simulation (CPS) scenario and running the Compensation Planning and Simulation Application Engine process (WA_CPS), you produce results that define a compensation strategy and budget. The next step is to review your work and analyze the results of your scenario. To assist you we provide the Compensation Scenario Analysis component to review and analyze compensation scenario output.
Note: Using this component you can also make changes to the compensation scenario output. However, if you save changes to an approved scenario the status is reset to awaiting approval.
Analyzing and reviewing your compensation scenario is an iterative process. If you don not think the data output from your scenario is satisfactory, then go back to the various setup steps outlined in this topic and change the groups and rules as needed. Then run the Compensation Scenario process over again, and analyze and review the results. Keep doing this until you are satisfied you have identified the scenario with the desired results.
Understanding the Compensation Scenario Analysis Component
The Compensation Scenario Analysis component provides functionality to enable a compensation analyst to review and alter the results of a CPS scenario online using ACE (Analytic Calculation Engine). ACE is a decision support tool that provides real-time, multidimensional modeling. With ACE the compensation analyst can review, analyze and alter CPS scenario results to ensure they meet the overall compensation strategy and budget of your organization. The analyst can analyze and alter scenario results without having to change the model and rules, and rerun the process.
There are nine pages in the Compensation Scenario Analysis component, each designed to analyze a specific aspect of the compensation scenario output. The Compensation Scenario Summary page is designed to view and analyze the compensation allocation in the scenario across any combination of dimensions. The remaining pages provide a preset combination of dimensions that enable you to alter the data at the plan, rule, group, department and employee level, and by amount or percent.
Pages in the Compensation Scenario Analysis component display one of two views:
Budget plan: For base pay rules a budget plan is the roll up of values for action reasons. For variable pay rules a budget plan is the roll up of the values for variable compensation plan IDs. In this view the budget plan roll-ups are displayed, but not the breakdown of data for individual compensation rules.
Compensation rule: In this view the breakdown of data for individual compensation rules is displayed.
For more information regarding the Analytic Calculation Engine, seePeopleTools: Analytic Calculation Engine
Using the Compensation Scenario Analysis Component
Each page in the Compensation Scenario Analysis component has an analytic grid for multidimensional analysis. The grid contains data cubes (categories of data) and dimensions. You can use the analytic grid to edit your data, pivot data cubes and dimensions (move them between the row and column axis of the grid) to gain a different view of your data, and view selected "slices" of your data. Within an analytic grid, you can expand and collapse those dimensions that have a hierarchical structure; you can also drill down into such dimensions.
You can alter the results of the scenario in the grid. For example, you can alter the Employee Value, Employer Expense or the Allocated Stock Units by entering an amount or percentage in the Alter Method and Amount columns. The Current Altered Amount and Altered Stock Units automatically reflect the result of this change. The system also prorates this change across all rows that roll up to this level. Any changes to the Stock Units are reflected in the Employee Value column. The Total Altered Expense and Total Altered Value reflect the aggregated results of all the changes you make in other pages when altering the data by different dimensions. The Average Value reflect the average amount per employee for each dimension members combination (excluding zero amounts). You can also modify preferences within the grid—saving a particular layout that you have created or returning to the default grid layout.
Note: The system does not allow you to alter a value of 0. For example, if a row in the Stock Units column displays "0", you cannot adjust it in the Alter Method and Amount columns.
All prorated amounts are rounded to the nearest cent and stock units are rounded to whole number. This may result in some discrepancy between target amounts and total altered amounts, which is expected due to rounding and aggregation.
If multiple users are altering the same model simultaneously, they may override each other yielding unpredictable results and error messages. It is thus not recommended that multiple users access the same model simultaneously.
Each grid contains a slice bar, which enables you to view a subset of your data. You can slice your data by choosing from any list—representing data cubes or dimensions—that appears on the slice bar by default. In addition, you can add data cubes or dimensions to the slice bar and use them to view alternate slices of your data.
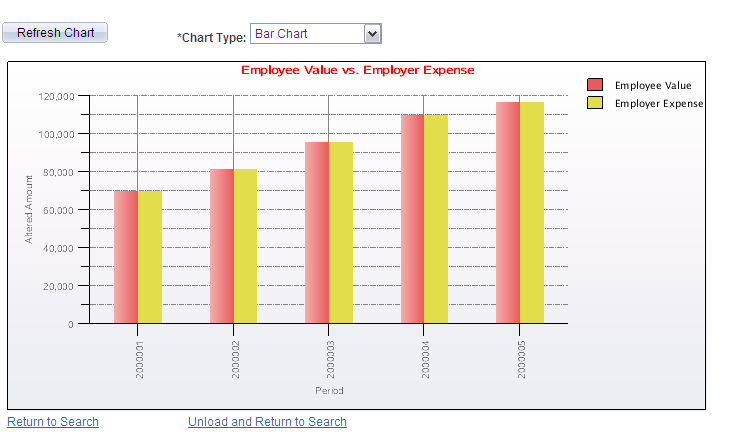
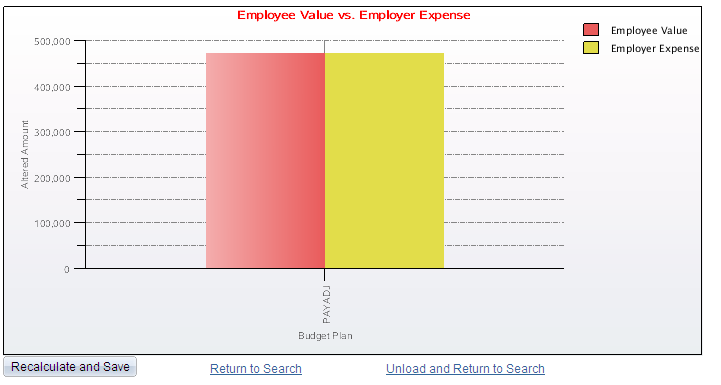
Each page in the component also contains a graphic chart to represent your data. The bar charts compare the total altered Employer Expense to the total altered Employee Value for the scenario, and a specific dimension (such as budget plan or employee). The x axis displays the first dimension in the grid. When you hold the cursor over the charts, they also display the exact monetary amounts for Total Employer Expense and Total Employee Value for the scenario.
Note: Charts can respond to changes you make in the grid, but this requires that you click the Refresh Chart button.
Although the intersections of data, or dimensions, presented on each page of the Compensation Scenario Analysis component are different, the basic page function and grids are the same. With the Compensation Scenario Analysis component you can:
Review the compensation allocations in the scenario across a given set of dimensions.
Determine if the allocations are in alignment with your organization's compensation strategy and budgeting constraints.
Manipulate the scenario output at the department, group, employee and compensation rule level.
Limiting Access to the Compensation Scenario Analysis Component
You can limit access to the component using PeopleTools security (permission list) so that only certain users can review or alter scenarios. In addition to PeopleTools security, you can strictly limit access to scenarios using scenario-level security. If a user does not have security access for a given scenario, they cannot access it. If you grant users access to a scenario, they have access to all scenario data within that scenario, so that they can view all the data they are approving. Therefore, for those operators you have granted such security, you may also want to grant them department level security for all department within their scenarios. This enables them to review all the employees on pages with department-level security.
Note: When working with the Department dimension in the Compensation Scenario Analysis component, you can only select, view, and drill down to departments and employees for which you are authorized. Non authorized departments and employees are not available. The totals, however, represent the overall total amounts for all employees, regardless of security access.
Common Elements Used in the Compensation Scenario Analysis Pages
The following fields are common to each page in the Compensation Scenario Analysis component.
Review Data Elements Page
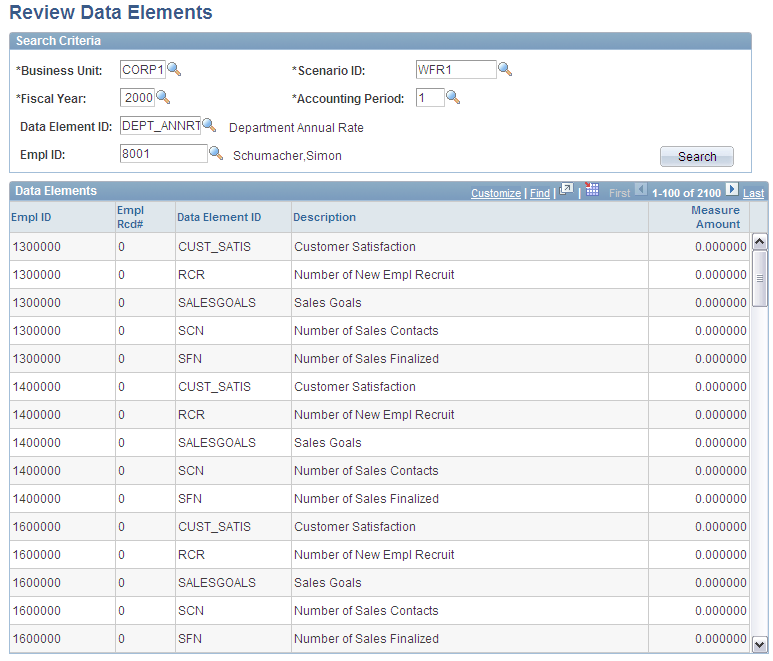
Use the Review Data Elements page (WA_ELEM_INQ) to review the results of the data elements included in a scenario.
Image: Review Data Elements page
This example illustrates the fields and controls on the Review Data Elements page. You can find definitions for the fields and controls later on this page.
Entering Search Criteria
Use the active fields at the top of the screen to indicate search criteria for the rows of data you want to see displayed in the grid on the bottom of the page.
Reviewing the Data Elements Data
Based on your search criteria, the system displays a row of data for each employee in the scenario whose compensation calculations were based on a data element. You use the display to view the results of the data elements after the Compensation Planning and Simulation process is run. For example, if you want to view the results of an employee's goals matrix score, do that here.
Note: If no data is available for the search criteria entered , a note appears in the grid informing you that no data is available.
For each row of data displayed, the system provides the EmplID and:
Note: On inquiry pages such as this one, row-level security can go down to the employee level. This means, if your implementation has row-level security, and you don't have security to see an employee, you won't. The employees you see in the grid, on this page, can vary depending upon your level of security access.
Base Pay Rule Page
Use the Base Pay Rule page (WA_CP_BP_INQ) to review the compensation rules setup for base pay rules.
Image: Base Pay Rule page
This example illustrates the fields and controls on the Base Pay Rule page. You can find definitions for the fields and controls later on this page.
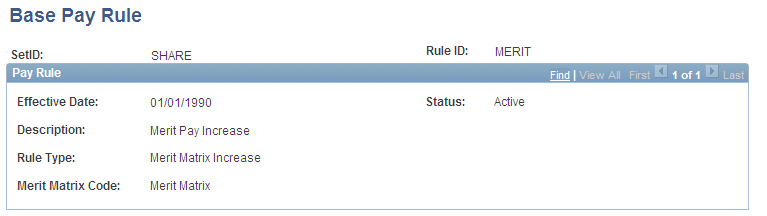
This page summarizes the base pay rules you defined in the Base Pay Rules and Other Pay Rules pages. This page displays the setup for the selected compensation rule from the WA_CP_RULE_DFN table, and different fields display depending upon the compensation rule selected.
Variable Pay Rule Page
Use the Variable Pay Rule page (WA_CP_VC_INQ) to review the compensation rules setup for variable pay rules.
Image: Variable Pay Rule page
This example illustrates the fields and controls on the Variable Pay Rule page. You can find definitions for the fields and controls later on this page.
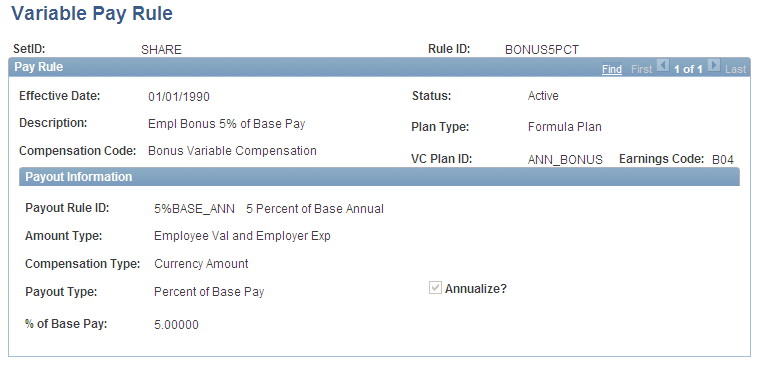
This page summarizes the base pay rules you defined in the Variable Pay Rules and Other Pay Rules pages. This page displays the setup for the selected compensation rule from the WA_CP_RULE_DFN table, and different fields display depending upon the compensation rule selected.
Compensation Scenario Summary Page
Use the Compensation Scenario Summary page (WA_CP_ACE_BUD_TOT) to review a summary of the employer expenses versus employee values for a compensation planning scenario.
Image: Compensation Scenario Summary page 1 of 2
This example illustrates the fields and controls on the Compensation Scenario Summary page 1 of 2. You can find definitions for the fields and controls later on this page.
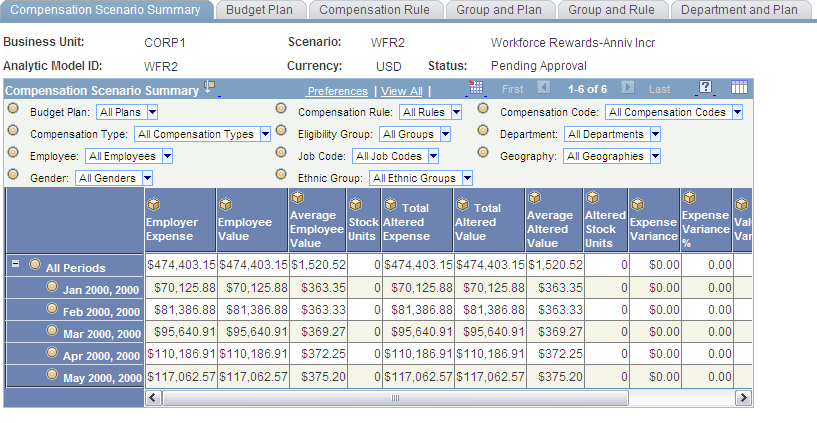
Image: Compensation Scenario Summary page 2 of 2
This example illustrates the fields and controls on the Compensation Scenario Summary page 2 of 2. You can find definitions for the fields and controls later on this page.
The Compensation Scenario Summary page displays period level data about the scenario compensation costs. The compensation costs are categorized as either an Employer Expense or an Employee Value. For each accounting Period, the system displays the monetary amounts for the Average Value, total altered Employee Value, and total Altered Employer Expense.
The page also includes all the dimensions and attributes available for analysis as well as variance columns to reflect the results of your changes in the other pages. These variance columns are: Expense Variance, Value Variance, Stock Units Variance. The variances indicate the difference between the original scenario budgeted amounts and your alterations.
Note: You cannot make alterations in this page.
Budget Plan Page
Use the Budget Plan page (WA_CP_ACE_BUD_ALT) to review and alter the compensation allocations in the scenario across the budget plan dimension.
Image: Budget Plan page 1 of 2
This example illustrates the fields and controls on the Budget Plan page 1 of 2. You can find definitions for the fields and controls later on this page.
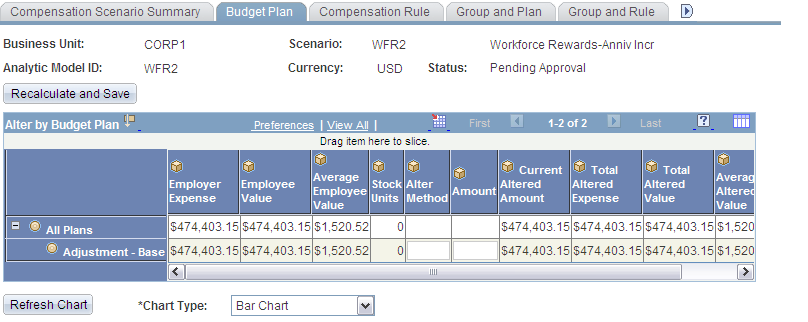
Image: Budget Plan page 2 of 2
This example illustrates the fields and controls on the Budget Plan page 2 of 2. You can find definitions for the fields and controls later on this page.
The Budget Plan page displays budget plan rule level data about the scenario compensation costs. The compensation costs are categorized as either an Employer Expense or an Employee Value. For each budget plan the system also displays the monetary amounts for the Average Value, Current Altered Amount, Altered Employee Value, Total Altered Employer Expense, and Average Altered Value.
You can use this page to alter the amounts using the Alter Method and Amount cells, when available.
Compensation Rule Page
Use the Compensation Rule page (WA_CP_ACE_RULE_ALT) to review and alter the compensation allocations in the scenario across the budget plan and compensation rule dimensions.
Image: Compensation Rule page 1 of 2
This example illustrates the fields and controls on the Compensation Rule page 1 of 2. You can find definitions for the fields and controls later on this page.
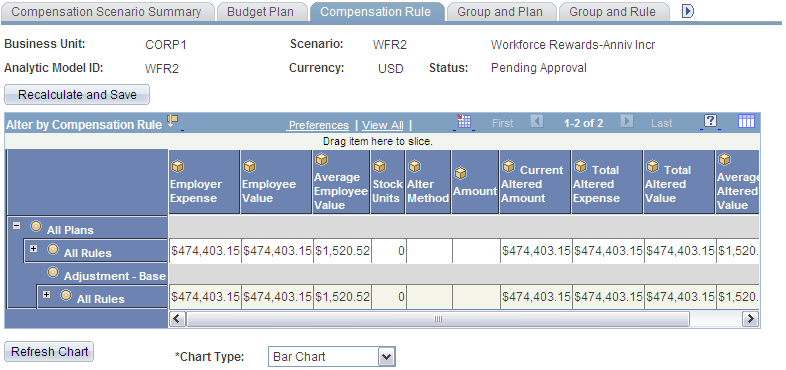
Image: Compensation Rule page 2 of 2
This example illustrates the fields and controls on the Compensation Rule page 2 of 2. You can find definitions for the fields and controls later on this page.
The Compensation Rule page displays budget plan rule level data about the scenario compensation costs. The compensation costs are categorized as either an Employer Expense or an Employee Value. For each budget plan the system also displays the monetary amounts for the Average Value, Current Altered Amount, Altered Employee Value, Total Altered Employer Expense, and Average Altered Value.
You can also alter the amounts on this page using the Alter Method and Amount cells, when available.
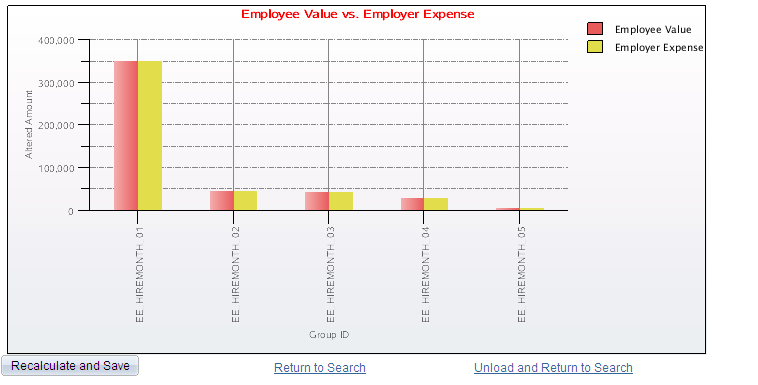
Group and Plan Page
Use the Group and Plan page (WA_CP_ACE_BDGR_ALT) to review and alter the compensation allocations in the scenario across the eligibility group and budget plan dimensions.
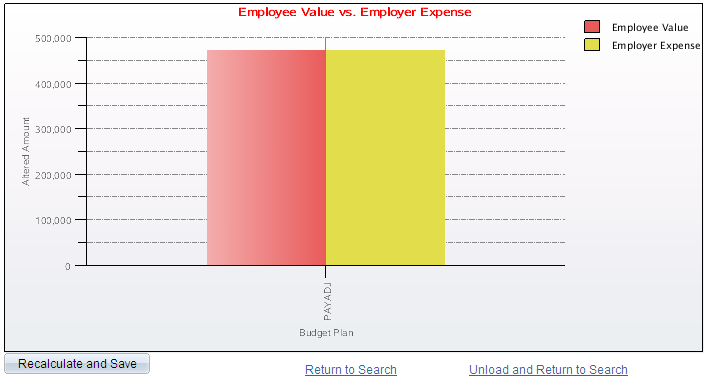
Image: Group and Plan page 1 of 2
This example illustrates the fields and controls on the Group and Plan page 1 of 2. You can find definitions for the fields and controls later on this page.
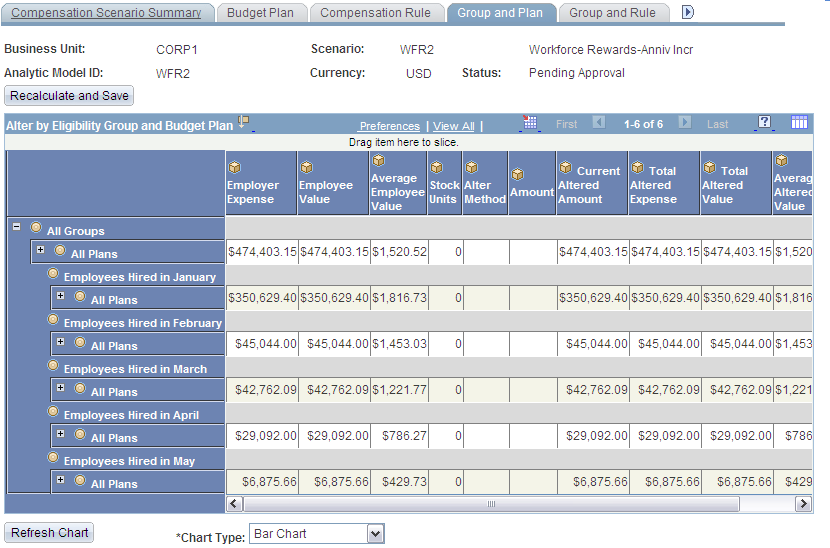
Image: Group and Plan page 2 of 2
This example illustrates the fields and controls on the Group and Plan page 2 of 2. You can find definitions for the fields and controls later on this page.
The Group and Plan page displays budget plan rule level data about the scenario compensation costs. The compensation costs are categorized as either an Employer Expense or an Employee Value. For each budget plan the system also displays the monetary amounts for the Average Value, Current Altered Amount, Altered Employee Value, Total Altered Employer Expense, and Average Altered Value.
You can also alter the amounts on this page using the Alter Method and Amount cells, when available.
Group and Rule Page
Use the Group and Rule page (WA_CP_ACE_RUGR_ALT) to review and alter the compensation allocations in the scenario across the eligibility group and compensation rule dimensions.
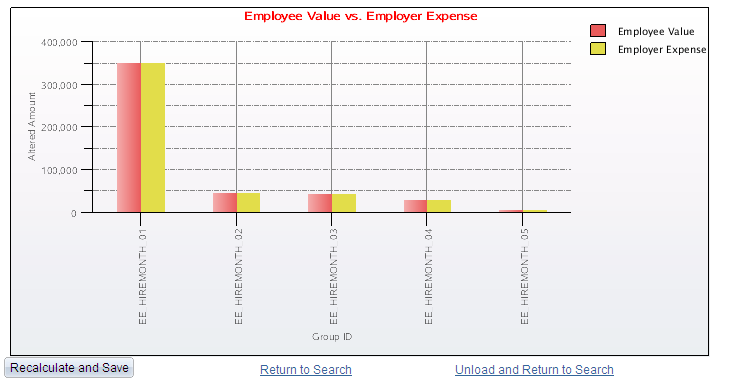
Image: Group and Rule page 1 of 2
This example illustrates the fields and controls on the Group and Rule page 1 of 2. You can find definitions for the fields and controls later on this page.
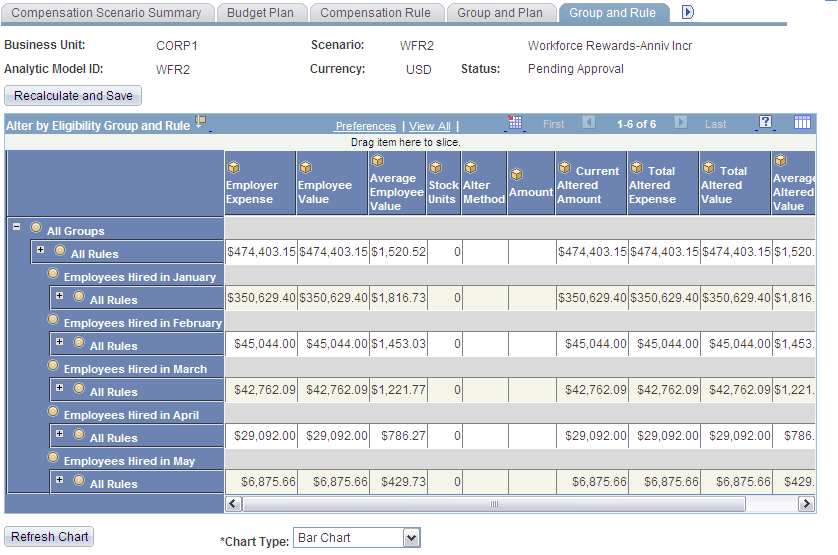
Image: Group and Rule page 2 of 2
This example illustrates the fields and controls on the Group and Rule page 2 of 2. You can find definitions for the fields and controls later on this page.
The Group and Rule page displays budget plan rule level data about the scenario compensation costs. The compensation costs are categorized as either an Employer Expense or an Employee Value. For each budget plan the system also displays the monetary amounts for the Average Value, Current Altered Amount, Altered Employee Value, Total Altered Employer Expense, and Average Altered Value.
You can also alter the amounts on this page using the Alter Method and Amount cells, when available.
Department and Plan Page
Use the Department and Plan page (WA_CP_ACE_BDDP_ALT) to review and alter the compensation allocations in the scenario across the department and budget plan dimensions.
Image: Department and Plan page
This example illustrates the fields and controls on the Department and Plan page. You can find definitions for the fields and controls later on this page.
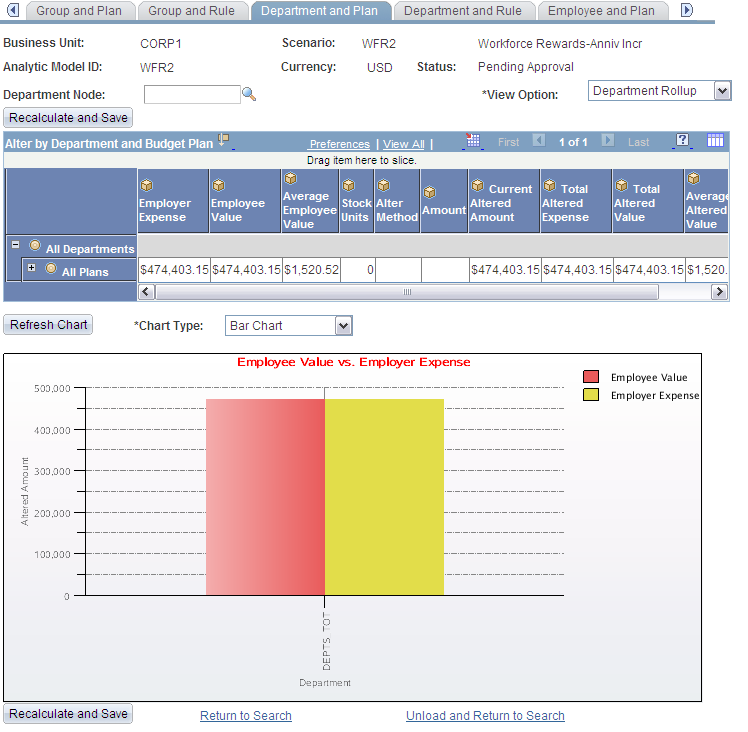
The Department and Plan page displays budget plan rule level data about the scenario compensation costs. The compensation costs are categorized as either an Employer Expense or an Employee Value. For each budget plan the system also displays the monetary amounts for the Average Value, Current Altered Amount, Altered Employee Value, Total Altered Employer Expense, and Average Altered Value.
This page enables you to view the department data by departmental roll-up totals or for one department only. You can also alter the amounts on this page using the Alter Method and Amount cells, when available.
Department and Rule Page
Use the Department and Rule page (WA_CP_ACE_RUDP_ALT) to review and alter the compensation allocations in the scenario across the department and compensation rule dimensions.
Image: Department and Rule page
This example illustrates the fields and controls on the Department and Rule page. You can find definitions for the fields and controls later on this page.
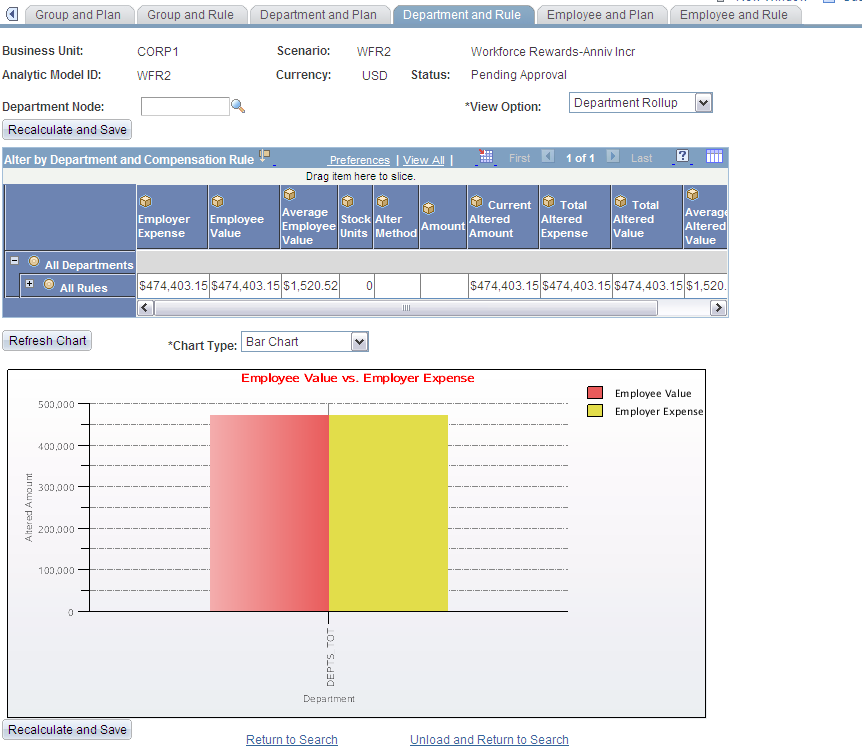
The Department and Rule page displays budget plan rule level data about the scenario compensation costs. The compensation costs are categorized as either an Employer Expense or an Employee Value. For each budget plan the system also displays the monetary amounts for the Average Value, Current Altered Amount, Altered Employee Value, Total Altered Employer Expense, and Average Altered Value.
You can also alter the amounts on this page using the Alter Method and Amount cells, when available.
Employee and Plan Page
Use the Employee and Plan page (WA_CP_ACE_BDEM_ALT) to review and alter the compensation allocations in the scenario across the employee and budget plan dimensions.
Image: Employee and Plan page
This example illustrates the fields and controls on the Employee and Plan page. You can find definitions for the fields and controls later on this page.
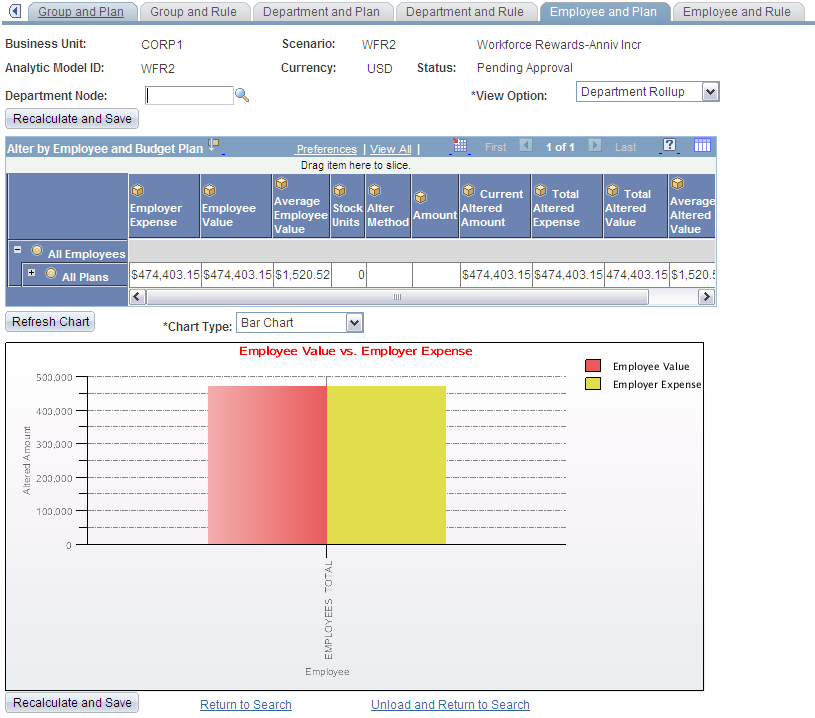
The Employee and Plan page displays budget plan rule level data about the scenario compensation costs. The compensation costs are categorized as either an Employer Expense or an Employee Value. For each budget plan the system also displays the monetary amounts for the Average Value, Current Altered Amount, Altered Employee Value, Total Altered Employer Expense, and Average Altered Value.
This page enables you to view the department data by departmental roll-up totals or for one department only. You can also see simulated employees belonging to a selected department. To select an individual employee you can drag the employee dimension to the slicer You can also alter the amounts on this page using the Alter Method and Amount cells, when available.
Employee and Rule Page
Use the Employee and Rule page (WA_CP_ACE_RUEM_ALT) to review and alter the compensation allocations in the scenario across the employee and compensation rule dimensions.
Image: Employee and Rule page
This example illustrates the fields and controls on the Employee and Rule page. You can find definitions for the fields and controls later on this page.
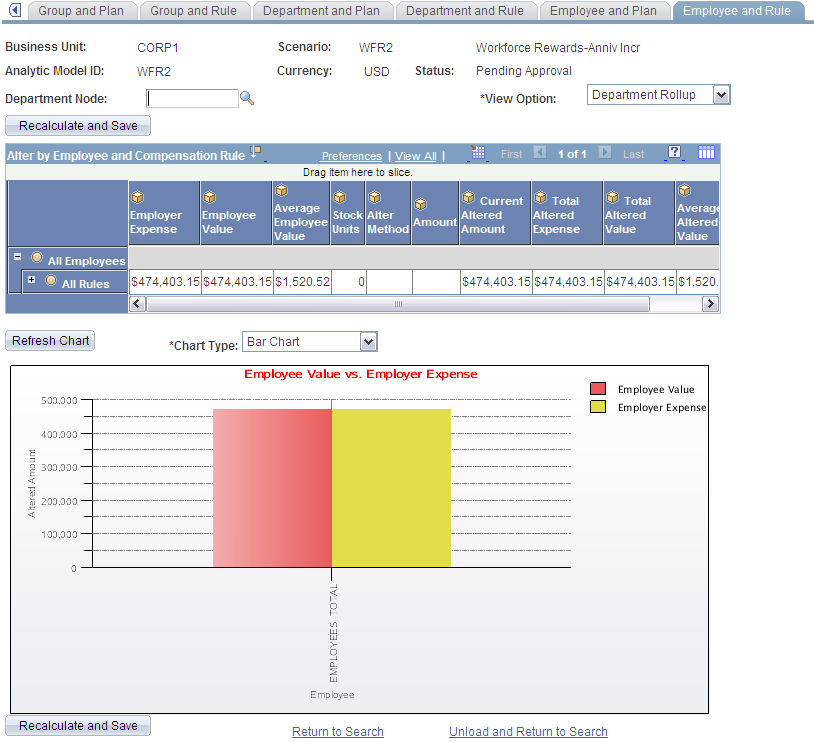
The Employee and Rule page displays budget plan rule level data about the scenario compensation costs. The compensation costs are categorized as either an Employer Expense or an Employee Value. For each budget plan the system also displays the monetary amounts for the Average Value, Current Altered Amount, Altered Employee Value, Total Altered Employer Expense, and Average Altered Value.
You can also alter the amounts on this page using the Alter Method and Amount cells, when available.