| Oracle® Fusion Middleware Oracle Reports User's Guide to Building Reports 11g Release 1 (11.1.1) Part Number B32122-02 |
|
|
PDF · Mobi · ePub |
| Oracle® Fusion Middleware Oracle Reports User's Guide to Building Reports 11g Release 1 (11.1.1) Part Number B32122-02 |
|
|
PDF · Mobi · ePub |
This part of the manual explains the different kinds of report layouts.
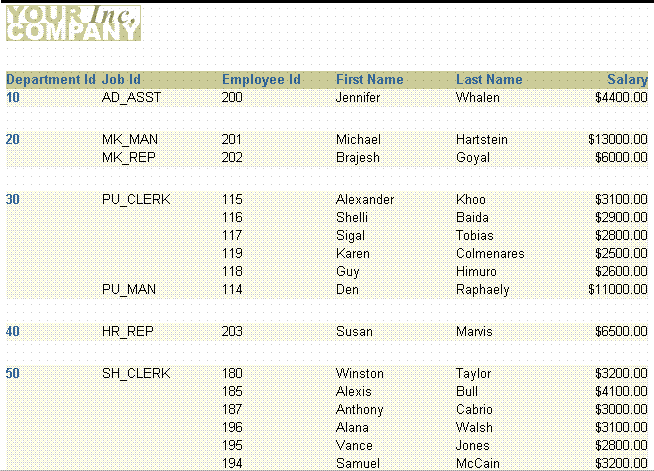
In this example, you will build a simple group left report using one query.
Group left and group above reports divide the rows of a report into "sets," based on common values in one or more of the columns, such as the department number in the preceding example. In the sample output below, notice that each department number prints only once. If the report above was not a group report, the department number would print once for each employee in the department rather than just once for the whole department.
Figure 3-7 Final output of the single-query group report example

For more information on building this example, refer to Chapter 10, "Building a Single-Query Group Report".
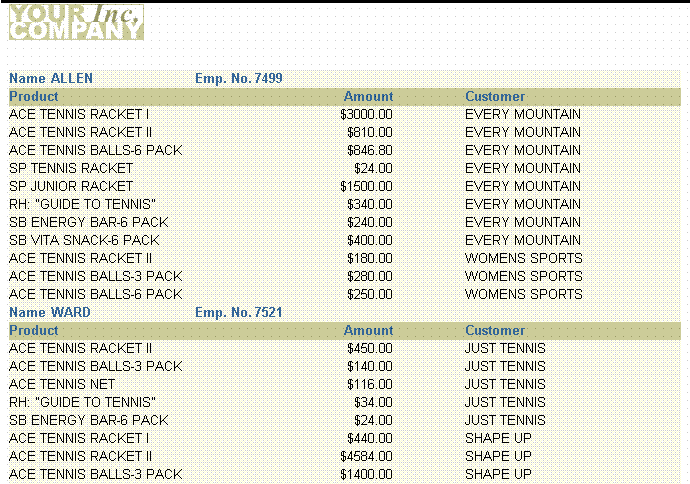
In this example, you will build a group above report using two queries.
A two-query group report appears much the same as a single-query group report. Performance is the key issue when contrasting single-query and multiple-query group reports. In most cases, single-query reports will run faster than multiple-query reports. Multiple-query reports are, however, sometimes easier to understand conceptually and easier to maintain. For example, if you are in a situation where only a few users run the report and the report returns a relatively small number of records, you might want to use multiple queries to simplify maintenance and make the data model easier to understand. If you have many users and the report is quite large, then you should try to use a single-query report.
Figure 3-8 Final output of the two-query group report example

For more information on building this example, refer to Chapter 11, "Building a Two-Query Group Report".
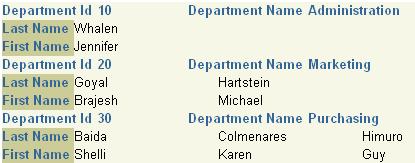
In this example, you will build an across group report that prints the values of a database column across the page instead of down.
Figure 3-9 Final output of the across group report example

For more information on building this example, refer to Chapter 12, "Building an Across Group Report".
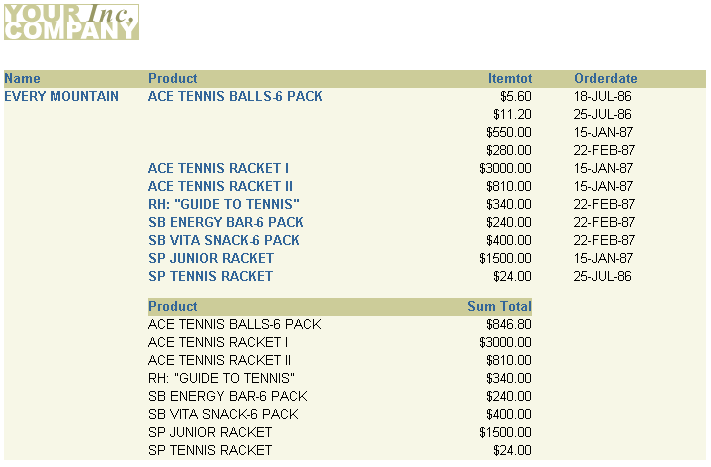
In this example, you will build a summary report that groups the summaries on the left in the report output.
This report consists of master records (Name, at the upper left of the figure below), detail records (Product, Itemtot, and Orderdate, to the upper right), and summary records (Product, and Sum Total). The summary calculates totals for the details under each master record. Notice that the column Product appears twice. With Reports Builder, you can display columns any number of times.
Figure 3-10 Final output of the group left summary report example

For more information on building this example, refer to Chapter 13, "Building a Group Left Summary Report".
In this example, you will use the Report Wizard to set up your report and write the one query that selects all the necessary database columns. You will then manually create the two formula columns to calculate tax and order totals for each customer, then add the formula columns to your report. You will use a Group Left style report to make the data in the report easy to read.
Figure 3-11 Final output of the group left formula report example

For more information on building this example, refer to Chapter 14, "Building a Group Left Formula Report".