2 Administering Oracle Big Data Appliance
This chapter provides information about the software and services installed on Oracle Big Data Appliance. It contains these sections:
2.1 Monitoring a Cluster Using Oracle Enterprise Manager
An Oracle Enterprise Manager plug-in enables you to use the same system monitoring tool for Oracle Big Data Appliance as you use for Oracle Exadata Database Machine or any other Oracle Database installation. With the plug-in, you can view the status of the installed software components in tabular or graphic presentations, and start and stop these software services. You can also monitor the health of the network and the rack components.
2.1.1 Using the Enterprise Manager Web Interface
After opening Oracle Enterprise Manager web interface, logging in, and selecting a target cluster, you can drill down into these primary areas:
-
InfiniBand network: Network topology and status for InfiniBand switches and ports. See Figure 2-1.
-
Hadoop cluster: Software services for HDFS, MapReduce, and ZooKeeper.
-
Oracle Big Data Appliance rack: Hardware status including server hosts, Oracle Integrated Lights Out Manager (Oracle ILOM) servers, power distribution units (PDUs), and the Ethernet switch.
Figure 2-1 shows a small section of the cluster home page.
Figure 2-1 Cluster Home in Oracle Enterprise Manager
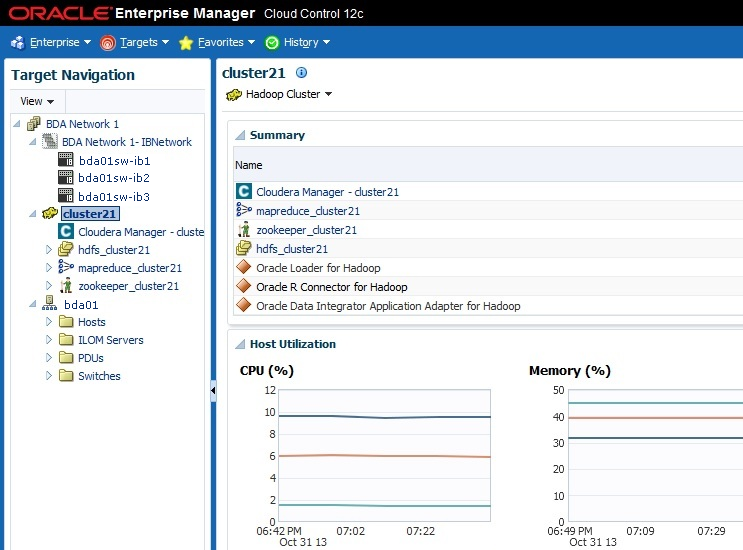
Description of "Figure 2-1 Cluster Home in Oracle Enterprise Manager"
To monitor Oracle Big Data Appliance using Oracle Enterprise Manager:
-
Download and install the plug-in. See Oracle Enterprise Manager System Monitoring Plug-in Installation Guide for Oracle Big Data Appliance.
-
Log in to Oracle Enterprise Manager as a privileged user.
-
From the Targets menu, choose Big Data Appliance to view the Big Data page. You can see the overall status of the targets already discovered by Oracle Enterprise Manager.
-
Select a target cluster to view its detail pages.
-
Expand the target navigation tree to display the components. Information is available at all levels.
-
Select a component in the tree to display its home page.
-
To change the display, choose an item from the drop-down menu at the top left of the main display area.
See Also:
Oracle Enterprise Manager System Monitoring Plug-in Installation Guide for Oracle Big Data Appliance for installation instructions and use cases.2.1.2 Using the Enterprise Manager Command-Line Interface
The Enterprise Manager command-line interface (emcli) is installed on Oracle Big Data Appliance along with all the other software. It provides the same functionality as the web interface. You must provide credentials to connect to Oracle Management Server.
To get help, enter emcli help.
2.2 Managing CDH Operations Using Cloudera Manager
Cloudera Manager is installed on Oracle Big Data Appliance to help you with Cloudera's Distribution including Apache Hadoop (CDH) operations. Cloudera Manager provides a single administrative interface to all Oracle Big Data Appliance servers configured as part of the Hadoop cluster.
Cloudera Manager simplifies the performance of these administrative tasks:
-
Monitor jobs and services
-
Start and stop services
-
Manage security and Kerberos credentials
-
Monitor user activity
-
Monitor the health of the system
-
Monitor performance metrics
-
Track hardware use (disk, CPU, and RAM)
Cloudera Manager runs on the JobTracker node (node03) and is available on port 7180.
To use Cloudera Manager:
-
Open a browser and enter a URL like the following:
http://bda1node03.example.com:7180
In this example,
bda1is the name of the appliance,node03is the name of the server,example.comis the domain, and7180is the default port number for Cloudera Manager. -
Log in with a user name and password for Cloudera Manager. Only a user with administrative privileges can change the settings. Other Cloudera Manager users can view the status of Oracle Big Data Appliance.
See Also:
Cloudera Manager Monitoring and Diagnostics Guide ator click Help on the Cloudera Manager Help menu
2.2.1 Monitoring the Status of Oracle Big Data Appliance
In Cloudera Manager, you can choose any of the following pages from the menu bar across the top of the display:
-
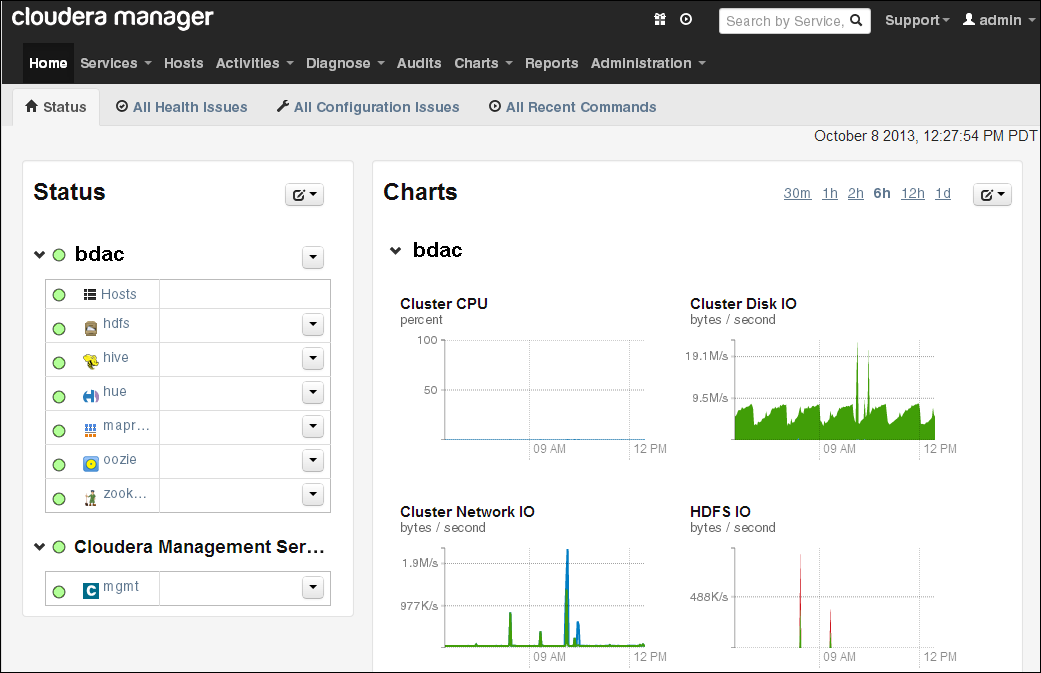
Home: Provides a graphic overview of activities on the cluster, and links to all services controlled by Cloudera Manager. See Figure 2-2.
-
Services: You can choose All Services from the Services menu for a top-level view of the status and health of services running on Oracle Big Data Appliance. Or you can choose a particular service for detailed information.
-
Hosts: Monitors the health, disk usage, load, physical memory, swap space, and other statistics for all servers in the cluster.
-
Activities: Monitors all MapReduce jobs running in the selected time period.
-
Diagnose: You can view events or logs from the Diagnose menu. Cloudera Manager collects historical information about the systems and services. You can search for a particular phrase for a selected server, service, and time period. You can also select the minimum severity level of the logged messages included in the search: TRACE, DEBUG, INFO, WARN, ERROR, or FATAL.
-
Audits: Displays the audit history log for a selected time range. You can filter the results by user name, service, or other criteria, and download the log as a CSV file.
-
Charts: Displays metrics from the Cloudera Manager time-series data store. You can choose from a variety of chart types, such as line and bar.
-
Reports: Generates reports on demand for disk and MapReduce use.
-
Administration: Select from a variety of options on the Administration menu, including Settings, Alerts, Users, and Kerberos.
Figure 2-2 shows the Cloudera Manager home page.
2.2.2 Performing Administrative Tasks
As a Cloudera Manager administrator, you can change various properties for monitoring the health and use of Oracle Big Data Appliance, add users, and set up Kerberos security.
To access Cloudera Manager Administration:
-
Log in to Cloudera Manager with administrative privileges.
-
Select the Administration tab.
2.2.3 Managing Services With Cloudera Manager
Cloudera Manager provides the interface for managing these services:
-
HDFS
-
Hive
-
Hue
-
MapReduce
-
Oozie
-
ZooKeeper
You can use Cloudera Manager to change the configuration of these services, stop, and restart them. Additional services are also available, which require configuration before you can use them. See "Unconfigured Software."
Note:
Manual edits to Linux service scripts or Hadoop configuration files do not affect these services. You must manage and configure them using Cloudera Manager.2.3 Using Hadoop Monitoring Utilities
Users can monitor MapReduce jobs without providing a Cloudera Manager user name and password.
2.3.1 Monitoring the JobTracker
Hadoop Map/Reduce Administration monitors the JobTracker, which runs on port 50030 of the JobTracker node (node03) on Oracle Big Data Appliance.
To monitor the JobTracker:
-
Open a browser and enter a URL like the following:
http://bda1node03.example.com:50030
In this example,
bda1is the name of the appliance,node03is the name of the server, and50030is the default port number for Hadoop Map/Reduce Administration.
Figure 2-3 shows part of a Hadoop Map/Reduce Administration display.
Figure 2-3 Hadoop Map/Reduce Administration
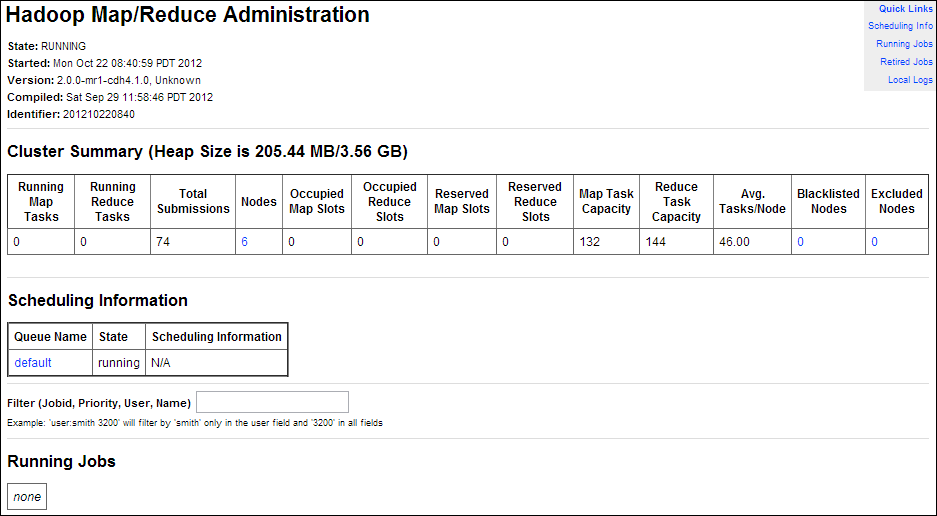
Description of "Figure 2-3 Hadoop Map/Reduce Administration"
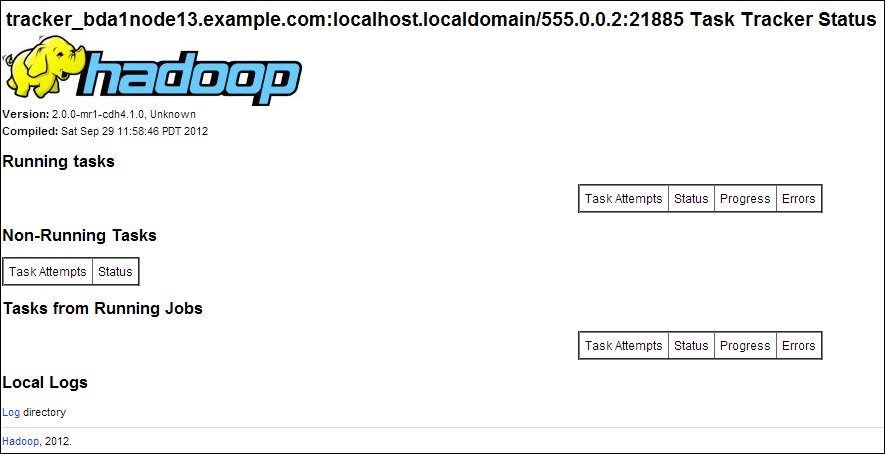
2.3.2 Monitoring the TaskTracker
The Task Tracker Status interface monitors the TaskTracker on a single node. It is available on port 50060 of all noncritical nodes (node04 to node18) in Oracle Big Data Appliance. On six-node clusters, the TaskTracker also runs on node01 and node02.
To monitor a TaskTracker:
-
Open a browser and enter the URL for a particular node like the following:
http://bda1node13.example.com:50060
In this example,
bda1is the name of the rack,node13is the name of the server, and50060is the default port number for the Task Tracker Status interface.
Figure 2-4 shows the Task Tracker Status interface.
2.4 Using Cloudera Hue to Interact With Hadoop
Hue runs in a browser and provides an easy-to-use interface to several applications to support interaction with Hadoop and HDFS. You can use Hue to perform any of the following tasks:
-
Query Hive data stores
-
Create, load, and delete Hive tables
-
Work with HDFS files and directories
-
Create, submit, and monitor MapReduce jobs
-
Monitor MapReduce jobs
-
Create, edit, and submit workflows using the Oozie dashboard
-
Manage users and groups
Hue runs on port 8888 of the JobTracker node (node03).
To use Hue:
-
Open Hue in a browser using an address like the one in this example:
http://bda1node03.example.com:8888In this example,
bda1is the cluster name,node03is the server name, andexample.comis the domain. -
Log in with your Hue credentials.
Oracle Big Data Appliance is not configured initially with any Hue user accounts. The first user who connects to Hue can log in with any user name and password, and automatically becomes an administrator. This user can create other user and administrator accounts.
-
Use the icons across the top to open a utility.
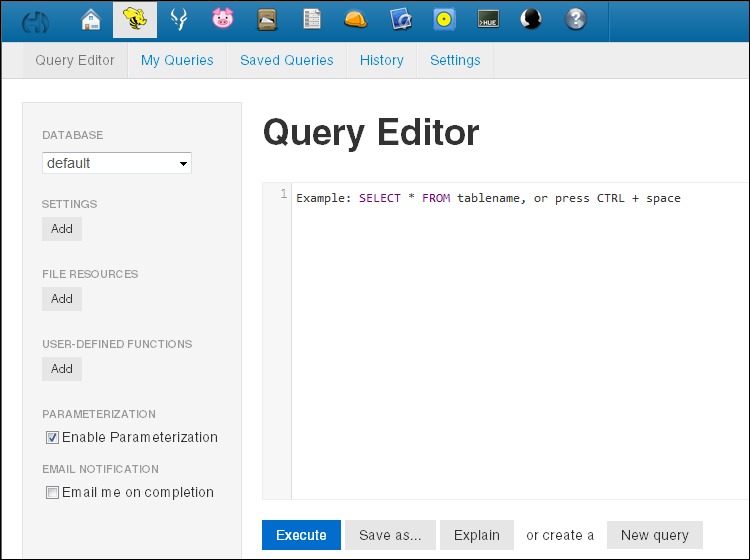
Figure 2-5 shows the Beeswax Query Editor for entering Hive queries.
See Also:
Hue Installation Guide for information about using Hue, which is already installed and configured on Oracle Big Data Appliance, at2.5 About the Oracle Big Data Appliance Software
The following sections identify the software installed on Oracle Big Data Appliance and where it runs in the rack. Some components operate with Oracle Database 11.2.0.2 and later releases.
2.5.1 Software Components
These software components are installed on all servers in the cluster. Oracle Linux, required drivers, firmware, and hardware verification utilities are factory installed. All other software is installed on site. The optional software components may not be configured in your installation.
Note:
You do not need to install additional software on Oracle Big Data Appliance. Doing so may result in a loss of warranty and support. See the Oracle Big Data Appliance Owner's Guide.Base image software:
-
Java HotSpot Virtual Machine 7 version 25 (JDK 7u25)
-
Oracle R Distribution 3.0.1-2
-
MySQL Database 5.5.17 Advanced Edition
-
Puppet, firmware, utilities
Mammoth installation:
-
Cloudera's Distribution including Apache Hadoop Release 4 Update 4 (4.4)
-
Oracle NoSQL Database Community Edition or Enterprise Edition 12c Release 1 (optional)
-
Oracle Big Data Connectors 2.3 (optional):
See Also:
Oracle Big Data Appliance Owner's Guide for information about the Mammoth utilityFigure 2-6 shows the relationships among the major components.
Figure 2-6 Major Software Components of Oracle Big Data Appliance
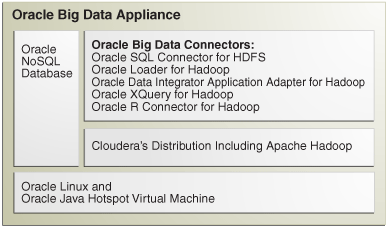
Description of "Figure 2-6 Major Software Components of Oracle Big Data Appliance"
2.5.2 Logical Disk Layout
Each server has 12 disks. The critical operating system is stored on disks 1 and 2.
Table 2-1 describes how the disks are partitioned.
2.6 About the CDH Software Services
This section contains the following topics:
2.6.1 Monitoring the CDH Services
You can use Cloudera Manager to monitor the CDH services on Oracle Big Data Appliance.
To monitor the services:
-
In Cloudera Manager, click the Services tab, and then the name of a service to see its Status page.
-
Click a subtab for the information you want to view, such as Status, Instances, Commands, Configuration, or Audits.
2.6.2 Where Do the CDH Services Run?
All services are installed on all nodes in a CDH cluster, but individual services run only on designated nodes. There are slight variations in the location of the services depending on the configuration of the cluster.
2.6.2.1 Service Locations on a Single Rack
Table 2-2 identifies the services in CDH clusters configured within a single rack, including starter racks and clusters with six nodes. Node01 is the first server in the cluster (server 1, 7, or 10), and nodexx is the last server in the cluster (server 6, 9, 12, or 18).
Table 2-2 Service Locations for One or More CDH Clusters in a Single Rack
| Node01 | Node02 | Node03 | Node04 | Node05 to nn |
|---|---|---|---|---|
|
Balancer |
||||
|
Hive, Hue, Oozie |
||||
|
Cloudera Manager Agent |
Cloudera Manager Agent |
Cloudera Manager Agent |
Cloudera Manager Agent |
Cloudera Manager Agent |
|
Cloudera Manager Server |
||||
|
DataNode |
DataNode |
DataNode |
DataNode |
DataNode |
|
Failover Controller |
Failover Controller |
Failover Controller |
Failover Controller |
|
|
JournalNode |
JournalNode |
JournalNode |
||
|
MySQL Backup |
MySQL Primary |
|||
|
NameNode 1 |
NameNode 2 |
|||
|
Oracle Data Integrator Agent |
||||
|
Puppet |
Puppet |
Puppet |
Puppet |
Puppet |
|
Puppet Master |
||||
|
JobTracker 1 |
JobTracker 2 |
|||
|
Task TrackerFoot 1 |
Task TrackerFootref 1 |
TaskTracker |
TaskTracker |
TaskTracker |
|
ZooKeeper Server |
ZooKeeper Server |
ZooKeeper Server |
Footnote 1 Starter racks and six-node clusters only
2.6.2.2 Service Locations in Multirack Clusters
When multiple racks are configured as a single CDH cluster, some critical services are moved to the first server of the second rack.
Critical services on the first server of the second rack:
-
Balancer
-
Failover Controller
-
Journal Node
-
NameNode 1
-
ZooKeeper Server
The DataNode, Cloudera Manager agent, and Puppet services also run on this server.
Table 2-3 identify the location of services on the first rack of a multirack cluster.
Table 2-3 Service Locations in the First Rack of a Multirack CDH Cluster
| Node01 | Node02 | Node03 | Node04 | Node05 to nnFoot 1 |
|---|---|---|---|---|
|
Cloudera Manager Agent |
Cloudera Manager Agent |
Cloudera Manager Agent |
Cloudera Manager Agent |
Cloudera Manager Agent |
|
Cloudera Manager Server |
||||
|
DataNode |
DataNode |
DataNode |
DataNode |
DataNode |
|
Failover Controller |
Failover Controller |
Failover Controller |
||
|
Hive, Hue, Oozie |
||||
|
JournalNode |
JournalNode |
|||
|
MySQL Backup |
MySQL Primary |
|||
|
NameNode 2 |
||||
|
Oracle Data Integrator agent |
||||
|
Puppet |
Puppet |
Puppet |
Puppet |
Puppet |
|
Puppet Master |
||||
|
JobTracker 1 |
JobTracker 2 |
|||
|
TaskTracker |
TaskTracker |
TaskTracker |
TaskTracker |
|
|
ZooKeeper Server |
ZooKeeper Server |
Footnote 1 nn includes the servers in additional racks.
2.6.3 Automatic Failover of the NameNode
The NameNode is the most critical process because it keeps track of the location of all data. Without a healthy NameNode, the entire cluster fails. Apache Hadoop v0.20.2 and earlier are vulnerable to failure because they have a single name node.
Cloudera's Distribution including Apache Hadoop Version 4 (CDH4) reduces this vulnerability by maintaining redundant NameNodes. The data is replicated during normal operation as follows:
-
CDH maintains redundant NameNodes on the first two nodes. One of the NameNodes is in active mode, and the other NameNode is in hot standby mode. If the active NameNode fails, then the role of active NameNode automatically fails over to the standby NameNode.
-
The NameNode data is written to a mirrored partition so that the loss of a single disk can be tolerated. This mirroring is done at the factory as part of the operating system installation.
-
The active NameNode records all changes to the file system metadata in at least two JournalNode processes, which the standby NameNode reads. There are three JournalNodes, which run on the first three nodes of each cluster.
-
The changes recorded in the journals are periodically consolidated into a single fsimage file in a process called checkpointing.
Note:
Oracle Big Data Appliance 2.0 and later releases do not support the use of an external NFS filer for backups and do not use NameNode federation.Figure 2-7 shows the relationships among the processes that support automatic failover of the NameNode.
Figure 2-7 Automatic Failover of the NameNode on Oracle Big Data Appliance
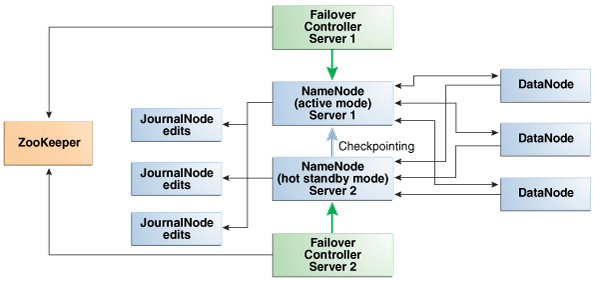
Description of "Figure 2-7 Automatic Failover of the NameNode on Oracle Big Data Appliance"
2.6.4 Automatic Failover of the JobTracker
The JobTracker distributes MapReduce tasks across the cluster. Like the NameNode, the JobTracker is a critical point of failure for the node. If the JobTracker fails, then all jobs stop running.
Oracle Big Data Appliance 2.2 and later releases support JobTracker High Available in CDH4 to reduce this vulnerability.
CDH maintains redundant JobTracker services on node03 and -04. One of the services is in active mode, and the other service is in hot standby mode. Failover controllers on the two nodes monitor the health of the services. If the active service fails, then the role of active JobTracker automatically fails over to the standby service.
Figure 2-7 shows the relationships among the processes that support automatic failover of the NameNode.
Figure 2-8 Automatic Failover of the JobTracker on Oracle Big Data Appliance
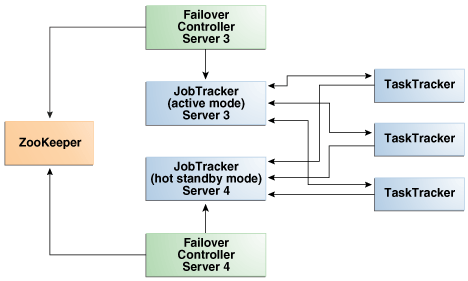
Description of "Figure 2-8 Automatic Failover of the JobTracker on Oracle Big Data Appliance"
2.6.5 Unconfigured Software
The RPM installation files for the following tools are available on Oracle Big Data Appliance, and they are included in the Oracle Big Data Appliance license. Do not download them from the Cloudera website. However, you must install and configure them.
You can find the RPM files on the first server of each cluster in /opt/oracle/BDAMammoth/bdarepo/RPMS/noarch.
See Also:
CDH4 Installation and Configuration Guide for configuration procedures at2.6.6 Map and Reduce Resource Configuration
Each node in a cluster has a maximum number of map and reduce tasks that are allowed to run simultaneously. Table 2-4 shows the default configuration of resources for the MapReduce service on Oracle Big Data Appliance X4-2 and X3-2.
Table 2-4 Maximum Map and Reduce Tasks on Oracle Big Data Appliance X3-2
| Node | 6-Node Cluster | Larger ClustersFoot 1 |
|---|---|---|
|
Node01 and Node02 |
14 map 8 reduce |
None |
|
Node03 and Node04 |
10 map 6 reduce |
10 map 6 reduce |
|
Node05 to Nodenn |
20 map 13 reduce |
20 map 13 reduce |
Footnote 1 9 or more nodes
Table 2-5 shows the default configuration of resources for the MapReduce service on Oracle Big Data Appliance Sun Fire X4270 M2-based racks.
Table 2-5 Maximum Map and Reduce Tasks on Sun Fire X4270 M2-Based Racks
| Node | 6-Node Cluster | Larger ClustersFoot 1 |
|---|---|---|
|
Node01 and Node02 |
10 map 6 reduce |
None |
|
Node03 and Node04 |
7 map 4 reduce |
7 map 4 reduce |
|
Node05 to Nodenn |
15 map 10 reduce |
15 map 10 reduce |
Footnote 1 9 or more nodes
2.7 Effects of Hardware on Software Availability
The effects of a server failure vary depending on the server's function within the CDH cluster. Oracle Big Data Appliance servers are more robust than commodity hardware, so you should experience fewer hardware failures. This section highlights the most important services that run on the various servers of the primary rack. For a full list, see "Where Do the CDH Services Run?."
Note:
In a multirack cluster, some critical services run on the first server of the second rack. See "Service Locations in Multirack Clusters."2.7.1 Critical and Noncritical Nodes
Critical nodes are required for the cluster to operate normally and provide all services to users. In contrast, the cluster continues to operate with no loss of service when a noncritical node fails.
On single-rack clusters, the critical services are installed initially on the first four nodes of the cluster. The remaining nodes (node05 up to node18) only run noncritical services. If a hardware failure occurs on one of the critical nodes, then the services can be moved to another, noncritical server. For example, if node02 fails, then you might move its critical services node05. Table 2-2 identifies the initial location of services for clusters that are configured on a single rack.
In a multirack cluster, some critical services run on the first server of the second rack. See "Where Do the CDH Services Run?."
Moving a critical node requires that all clients be reconfigured with the address of the new node. The other alternative is to wait for the failed server to be repaired. You must weigh the loss of services against the inconvenience of reconfiguring the clients.
Table 2-6 Critical Service Locations
| Node Name | Initial Node Position | Critical Functions |
|---|---|---|
|
First NameNode |
Node01 |
ZooKeeperFoot 1 , first NameNodeFootref 1, failover controllerFootref 1, balancerFootref 1, puppet master |
|
Second NameNode |
Node02 |
ZooKeeper, second NameNode, failover controller, MySQL backup server |
|
First JobTracker Node |
Node03 |
ZooKeeper, first JobTracker, failover controller, Cloudera Manager server, MySQL primary server |
|
Second JobTracker Node |
Node04 |
Second JobTracker, failover controller, Oracle Data Integrator agent, Hue, Hive, Oozie |
Footnote 1 In multirack clusters, this service is initially installed on the first server of the second rack.
2.7.2 First Namenode
One instance of the NameNode initially runs on node01. If this node fails or goes offline (such as a restart), then the second NameNode (node02) automatically takes over to maintain the normal activities of the cluster.
Alternatively, if the second NameNode is already active, it continues without a backup. With only one NameNode, the cluster is vulnerable to failure. The cluster has lost the redundancy needed for automatic failover.
The puppet master also runs on this node. The Mammoth utilities use Puppet, and so you cannot install or reinstall the software if, for example, you must replace a disk drive elsewhere in the rack.
Note:
In multirack clusters, the NameNode service is installed on the first server of the second rack.2.7.3 Second NameNode
One instance of the NameNode initially runs on node02. If this node fails, then the function of the NameNode either fails over to the first NameNode (node01) or continues there without a backup. However, the cluster has lost the redundancy needed for automatic failover if the first NameNode also fails.
The MySQL backup database also runs on this node. MySQL Database continues to run, although there is no backup of the master database.
2.7.4 First JobTracker
One instance of the JobTracker initially runs on node03. If this node fails or goes offline (such as a restart, then the second JobTracker (node04) automatically takes over to distribute MapReduce tasks to specific nodes across the cluster.
Alternatively, if the second JobTracker is already active, it continues without a backup. With only one JobTracker, the cluster is vulnerable to failure. The cluster has lost the redundancy needed for automatic failover.
These services are also disrupted:
-
Cloudera Manager: This tool provides central management for the entire CDH cluster. Without this tool, you can still monitor activities using the utilities described in "Using Hadoop Monitoring Utilities".
-
MySQL Master Database: Cloudera Manager, Oracle Data Integrator, Hive, and Oozie use MySQL Database. The data is replicated automatically, but you cannot access it when the master database server is down.
2.7.5 Second JobTracker
One instance of the JobTracker initially runs on node04. If this node fails, then the function of the JobTracker either fails over to the first JobTracker (node03) or continues there without a backup. However, the cluster has lost the redundancy needed for automatic failover if the first JobTracker also fails.
These services are also disrupted:
-
Oracle Data Integrator: This service supports Oracle Data Integrator Application Adapter for Hadoop. You cannot use this connector when the JobTracker node is down.
-
Hive: Hive provides a SQL-like interface to data that is stored in HDFS. Most of the Oracle Big Data Connectors can access Hive tables, which are not available if this node fails.
-
Hue: This administrative tool is not available when the JobTracker node is down.
-
Oozie: This workflow and coordination service runs on the JobTracker node, and is unavailable when the node is down.
2.7.6 Noncritical Nodes
The noncritical nodes (node05 to node18) are optional in that Oracle Big Data Appliance continues to operate with no loss of service if a failure occurs. The NameNode automatically replicates the lost data to maintain three copies at all times. MapReduce jobs execute on copies of the data stored elsewhere in the cluster. The only loss is in computational power, because there are fewer servers on which to distribute the work.
2.8 Security on Oracle Big Data Appliance
You can take precautions to prevent unauthorized use of the software and data on Oracle Big Data Appliance.
This section contains these topics:
2.8.1 About Predefined Users and Groups
Every open-source package installed on Oracle Big Data Appliance creates one or more users and groups. Most of these users do not have login privileges, shells, or home directories. They are used by daemons and are not intended as an interface for individual users. For example, Hadoop operates as the hdfs user, MapReduce operates as mapred, and Hive operates as hive.
You can use the oracle identity to run Hadoop and Hive jobs immediately after the Oracle Big Data Appliance software is installed. This user account has login privileges, a shell, and a home directory.
Oracle NoSQL Database and Oracle Data Integrator run as the oracle user. Its primary group is oinstall.
Note:
Do not delete or modify the users created during installation, because they are required for the software to operate.Table 2-7 identifies the operating system users and groups that are created automatically during installation of Oracle Big Data Appliance software for use by CDH components and other software packages.
Table 2-7 Operating System Users and Groups
| User Name | Group | Used By | Login Rights |
|---|---|---|---|
|
|
Flume parent and nodes |
No |
|
|
|
HBase processes |
No |
|
|
|
No |
||
|
|
No |
||
|
|
Hue processes |
No |
|
|
|
JobTracker, TaskTracker, Hive Thrift daemon |
Yes |
|
|
|
|
Yes |
|
|
|
Oozie server |
No |
|
|
Oracle NoSQL Database, Oracle Loader for Hadoop, Oracle Data Integrator, and the Oracle DBA |
Yes |
||
|
|
Puppet parent (puppet nodes run as |
No |
|
|
|
Sqoop metastore |
No |
|
|
Auto Service Request |
No |
||
|
|
ZooKeeper processes |
No |
2.8.2 About User Authentication
Oracle Big Data Appliance supports Kerberos security as a software installation option. See Chapter 3 for details about setting up clients and users to access a Kerberos-protected cluster.
2.8.3 Port Numbers Used on Oracle Big Data Appliance
Table 2-8 identifies the port numbers that might be used in addition to those used by CDH.
To view the ports used on a particular server:
-
In Cloudera Manager, click the Hosts tab at the top of the page to display the Hosts page.
-
In the Name column, click a server link to see its detail page.
-
Scroll down to the Ports section.
See Also:
For the full list of CDH port numbers, go to the Cloudera website at2.8.4 About Puppet Security
The puppet node service (puppetd) runs continuously as root on all servers. It listens on port 8139 for "kick" requests, which trigger it to request updates from the puppet master. It does not receive updates on this port.
The puppet master service (puppetmasterd) runs continuously as the puppet user on the first server of the primary Oracle Big Data Appliance rack. It listens on port 8140 for requests to push updates to puppet nodes.
The puppet nodes generate and send certificates to the puppet master to register initially during installation of the software. For updates to the software, the puppet master signals ("kicks") the puppet nodes, which then request all configuration changes from the puppet master node that they are registered with.
The puppet master sends updates only to puppet nodes that have known, valid certificates. Puppet nodes only accept updates from the puppet master host name they initially registered with. Because Oracle Big Data Appliance uses an internal network for communication within the rack, the puppet master host name resolves using /etc/hosts to an internal, private IP address.
2.9 Auditing Oracle Big Data Appliance
You can use Oracle Audit Vault and Database Firewall to create and monitor the audit trails for HDFS and MapReduce on Oracle Big Data Appliance.
This section describes the Oracle Big Data Appliance plug-in:
2.9.1 About Oracle Audit Vault and Database Firewall
Oracle Audit Vault and Database Firewall secures databases and other critical components of IT infrastructure in these key ways:
-
Provides an integrated auditing platform for your enterprise.
-
Captures activity on Oracle Database, Oracle Big Data Appliance, operating systems, directories, file systems, and so forth.
-
Makes the auditing information available in a single reporting framework so that you can understand the activities across the enterprise. You do not need to monitor each system individually; you can view your computer infrastructure as a whole.
Audit Vault Server provides a web-based, graphic user interface for both administrators and auditors.
You can configure CDH/Hadoop clusters on Oracle Big Data Appliance as secured targets. The Audit Vault plug-in on Oracle Big Data Appliance collects audit and logging data from these services:
-
MapReduce: Who runs MapReduce jobs that correspond to file access.
-
Hive DDL: Who makes Hive database changes.
-
Oozie workflows: Who runs workflow activities.
The Audit Vault plug-in is an installation option. The Mammoth utility automatically configures monitoring on Oracle Big Data Appliance as part of the software installation process.
See Also:
For more information about Oracle Audit Vault and Database Firewall:http://www.oracle.com/technetwork/products/audit-vault-and-database-firewall/overview/index.html
2.9.2 Setting Up the Oracle Big Data Appliance Plug-in
The Mammoth utility on Oracle Big Data Appliance performs all the steps needed to setup the plug-in, using information that you provide.
To set up the Audit Vault plug-in for Oracle Big Data Appliance:
-
Ensure that Oracle Audit Vault and Database Firewall Server Release 12.1.1 is up and running on the same network as Oracle Big Data Appliance.
-
Complete the Audit Vault Plug-in section of Oracle Big Data Appliance Configuration Generation Utility.
-
Install the Oracle Big Data Appliance software using the Mammoth utility. An Oracle representative typically performs this step.
When the software installation is complete, the Audit Vault plug-in is installed on Oracle Big Data Appliance, and Oracle Audit Vault and Database Firewall is collecting its audit information. You do not need to perform any other installation steps.
See Also:
Oracle Big Data Appliance Owner's Guide for using Oracle Big Data Appliance Configuration Generation Utility2.9.3 Monitoring Oracle Big Data Appliance
After installing the plug-in, you can monitor Oracle Big Data Appliance the same as any other secured target. Audit Vault Server collects activity reports automatically.
The following procedure describes one type of monitoring activity.
To view an Oracle Big Data Appliance activity report:
-
Log in to Audit Vault Server as an auditor.
-
Click the Reports tab.
-
Under Built-in Reports, click Audit Reports.
-
To browse all activities, in the Activity Reports list, click the Browse report data icon for All Activity.
-
Add or remove the filters to list the events.
Event names include ACCESS, CREATE, DELETE, and OPEN.
-
Click the Single row view icon in the first column to see a detailed report.
Figure 2-9 shows the beginning of an activity report, which records access to a Hadoop sequence file.
Figure 2-9 Activity Report in Audit Vault Server
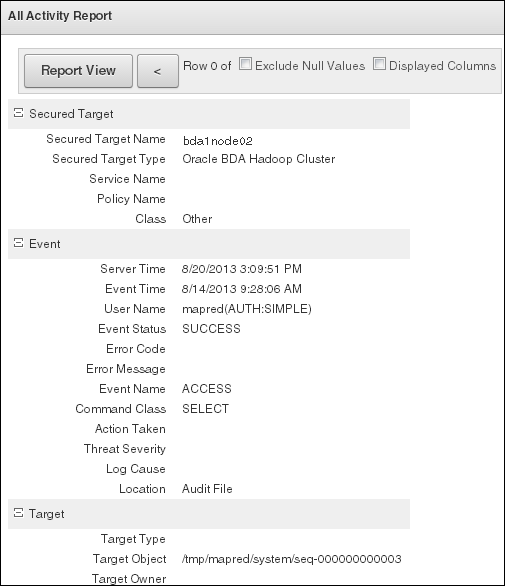
Description of "Figure 2-9 Activity Report in Audit Vault Server"
2.10 Collecting Diagnostic Information for Oracle Customer Support
If you need help from Oracle Support to troubleshoot CDH issues, then you should first collect diagnostic information using the bdadiag utility with the cm option.
To collect diagnostic information:
-
Log in to an Oracle Big Data Appliance server as
root. -
Run
bdadiagwith at least thecmoption. You can include additional options on the command line as appropriate. See the Oracle Big Data Appliance Owner's Guide for a complete description of thebdadiagsyntax.# bdadiag cm
The command output identifies the name and the location of the diagnostic file.
-
Go to My Oracle Support at
http://support.oracle.com. -
Open a Service Request (SR) if you have not already done so.
-
Upload the bz2 file into the SR. If the file is too large, then upload it to
sftp.oracle.com, as described in the next procedure.
To upload the diagnostics to ftp.oracle.com:
-
Open an SFTP client and connect to
sftp.oracle.com. Specify port 2021 and remote directory /support/incoming/target, where target is the folder name given to you by Oracle Support.See Example 2-1 if you are using a command-line SFTP client.
-
Log in with your Oracle Single Sign-on account and password.
-
Upload the diagnostic file to the new directory.
-
Update the SR with the full path and the file name.
Example 2-1 shows the commands to upload the diagnostics using the SFTP command interface.
Example 2-1 Uploading Diagnostics Using FTP
$ sftp -o port=2021 my.user.name@oracle.com@sftp.oracle.com
Connecting to sftp.oracle.com...
     .
     .
     .
Enter password for my.user.name@oracle.com
Password: password
sftp> cd support/incoming/SR123456
sftp> put /tmp/bdadiag_bda1node01_1216FM5497_2013_07_18_07_33.tar.bz2
Uploading bdadiag_bda1node01_1216FM5497_2013_07_18_07_33.tar.bz2 to //support/incoming/create_table.sql
bdadiag_bda1node01_1216FM5497_2013_07_18_07_33.tar.bz2 to support/incoming/create_table.sql                  100%  311     0.3KB/s   00:00
sftp> exit
$
See Also:
My Oracle Support Note 549180.1 at