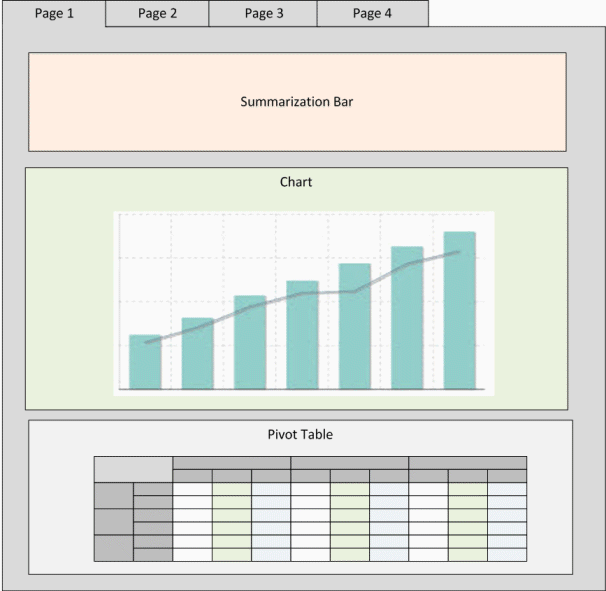
This type of layout is designed to present end users with a quick summary of key data points, to allow them to monitor changes to the data over time.

The Summarization Bar component is used to highlight important details in the data such as key performance indicators.
The Chart component provides a visual display of key data.
The Pivot Table component provides a broader set of data.
