Here is an example of a basic line chart.
This chart shows the number of cases sold for each booking year for each demographic.
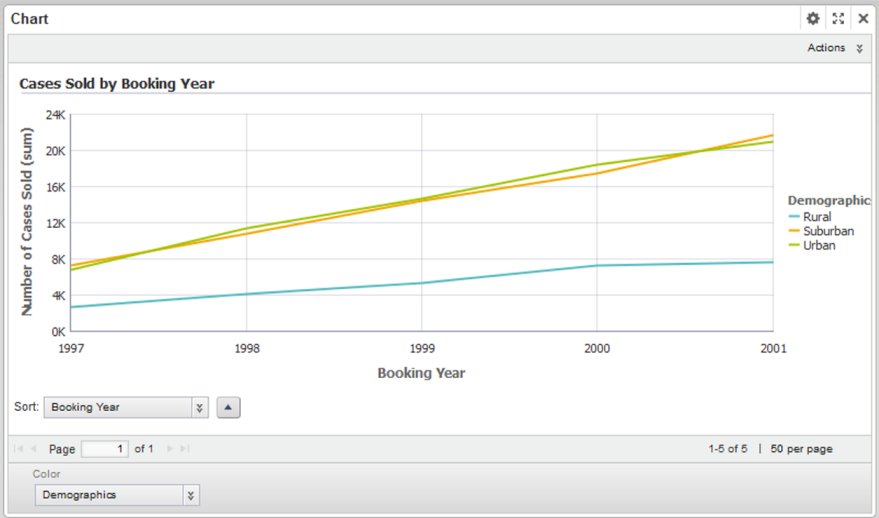
The configuration for this chart is:
| Chart Setting | Value |
|---|---|
| Chart type (Subtype) | Line |
| Series metric (aggregation) | Number of Cases Sold (sum) |
| Group dimension | Booking Year |
| Series dimension | Demographics |
| Sorting | Group dimension A to Z |
