Here is an example of a pie chart.
This chart shows the number of cases sold for each business type. This is good for an overview of the relative market share for each business type, rather than comparing the exact number of cases.
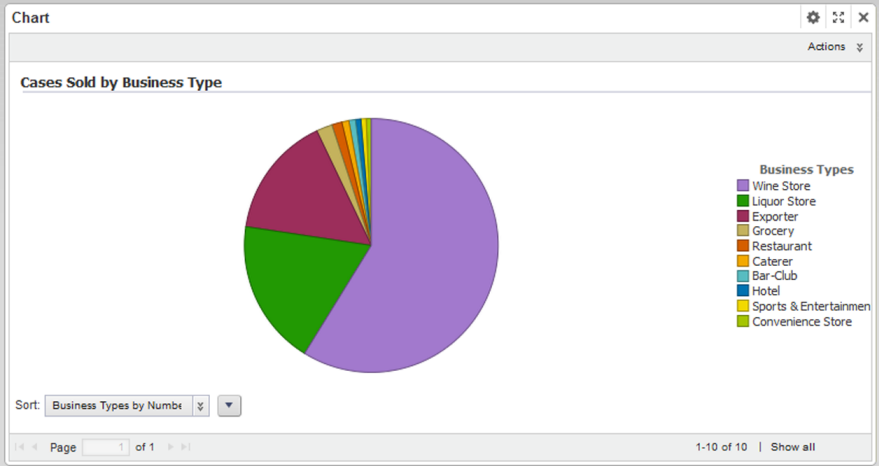
The configuration for this chart is:
| Chart Setting | Value |
|---|---|
| Chart type (Subtype) | Pie |
| Series metric (aggregation) | Number of Cases Sold (sum) |
| Group dimension | Business Types |
| Sorting | Metric value high to low |
