Here is an example of a single axis bar-line chart.
This chart shows the suggested and actual price for each varietal.
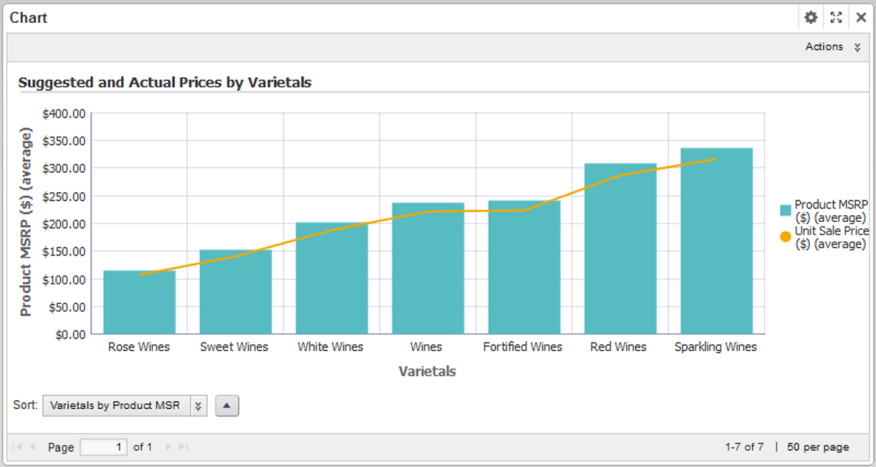
The configuration for this chart is:
| Chart Setting | Value |
|---|---|
| Chart type (Subtype) | Bar-Line (Single axis) |
| Bar series metric (aggregation) | Product MSRP ($) (average) |
| Line series metric (aggregation) | Unit Sale Prices ($) (average) |
| Group dimension | Varietals |
| Sorting | First bar metric low to high |
