Here is an example of a stacked bar chart.
The chart shows the total gross sales for the last several years. The gross sales figures are subdivided by business type. This stacked bar allows users to compare the totals across the years.
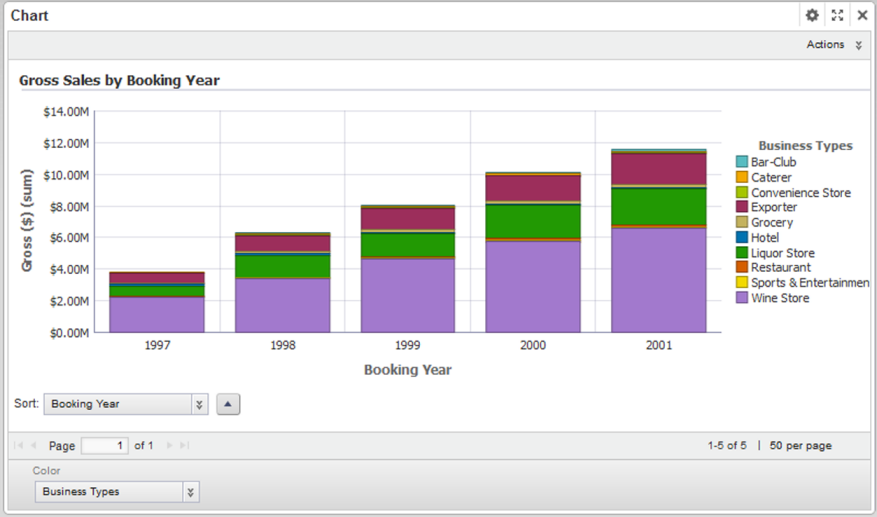
The configuration for this chart is:
| Chart Setting | Value |
|---|---|
| Chart type (Subtype) | Bar (Stacked Vertical) |
| Series metric (aggregation) | Gross ($) (sum) |
| Group dimension | Booking Year |
| Series dimension | Business Types |
| Sorting | Group dimension A to Z |
