Configuring general chart display

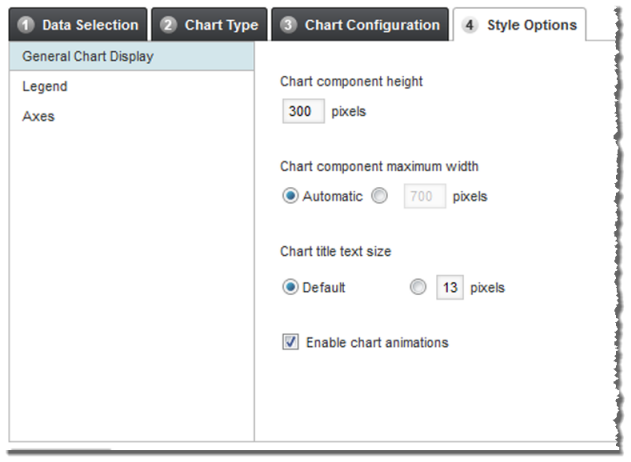
The chart edit view includes settings to configure the size of the Chart component, the size of the chart title text, and whether to animate the chart display.

On the Style Options tab, to configure the chart size options:

  1. Click the General Chart Display section heading.
    General Chart Display section of the Style Options tab on the chart edit view
  2. In the Chart component height field, type the height in pixels for the component.
  3. Under Chart component maximum width, to set the maximum width for the component:
    • To have the size set automatically, click the Automatic radio button.
    • To set a custom maximum size, click the other radio button, then in the field, type the size in pixels.
  4. Under Chart title text size, to set the size of the chart title text:
    • To use the default size, click the Default radio button.
    • To set a custom size, click the other radio button, then in the field, type the size in pixels.
  5. The Enable chart animations checkbox determines whether the end user view uses animations to display the chart. For example, for a bar chart, the bars can rise up from the category axis.

    To enable these animations, check the checkbox.

    To disable the animations, uncheck the checkbox.