For each chart, you can determine the default display order for the chart results and whether to limit the number of results displayed at one time. If the number of results displayed is limited, you can allow end users to page through the chart results.
The chart types have the following sorting options and pagination behavior:
| Chart Type | Available Items to Sort By | How Paging Works |
|---|---|---|
| Bar | Group dimension value
First metric value |
Paging is scrolling left/right (for vertical charts) or up/down (for horizontal charts) to show the previous/next set of bars. |
| Line/Area | Group dimension value
First metric value |
Paging is scrolling left/right to see the previous/next portion of the line or shared area. |
| Bar/Line | Group dimension value
First bar metric value First line metric value |
Paging is scrolling left/right to show the previous/next bars and line portions. |
| Pie | Dimension value
Metric value |
No paging available.
Users can only use the sort option to see the top or bottom set of values. |
| Bubble | Size metric values
If there is no bubble size metric, then end users cannot change the sort order. |
No paging available.
If the number of values displayed is limited, users can only use the sort option to see the top or bottom set of bubbles. |
| Scatter | No sorting available | No paging available |
To configure the sorting and pagination for a chart:
-
From the default sort drop-down list, select the default sort
order. The default includes both the item to sort by and whether to sort in
ascending or descending order.
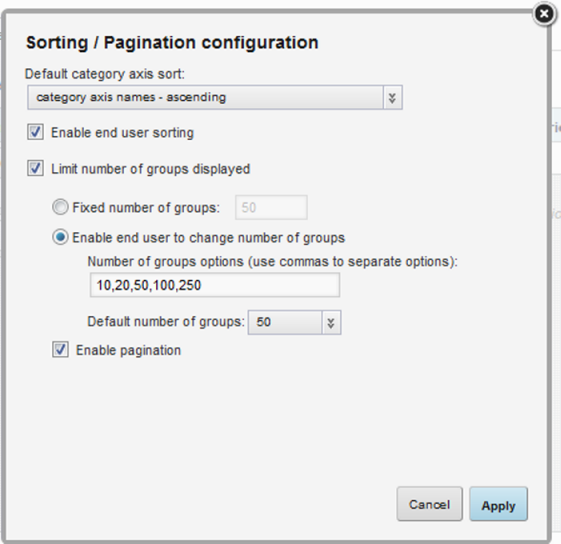
Note that for bubble charts, the drop-down list is only enabled if you are limiting the number of bubbles to display. If you do not limit the number of bubbles, then the chart is automatically sorted using the size metric value in descending order.
