Each chart may be configured with multiple options for the specific metrics and dimensions to display on the chart.
To select the data to display on the current view:
-
If the category axis consists of date/time values, then you can
use the date gap toggle to determine whether to include date/time values for
which the corresponding metric value is NULL.
For example, if you are looking at values over time for each month, then you may want to see all of the months in order, including the months for which there is no value.
The toggle does not display for pie, scatter, and bubble charts.
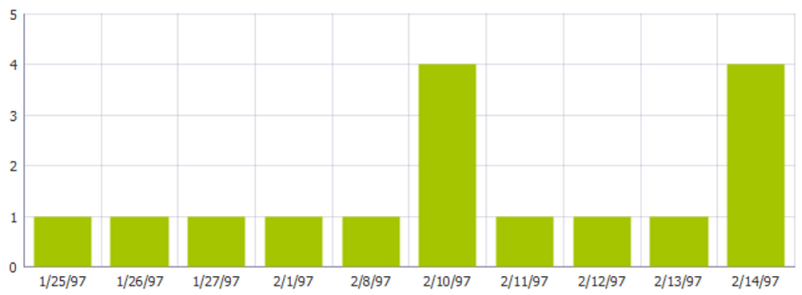
By default, the gaps are displayed. Here is an example of a chart with the gaps displayed:
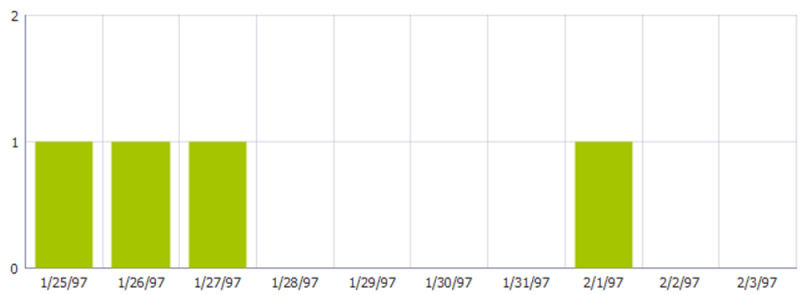
And here is the same chart with the gaps hidden: