| Oracle® Argus Mart Administrator's Guide Release 1.0 E38589-01 |
|
|
PDF · Mobi · ePub |
| Oracle® Argus Mart Administrator's Guide Release 1.0 E38589-01 |
|
|
PDF · Mobi · ePub |
Once you run an ETL process, there are certain tasks that you can execute to monitor the progress of the ETL process.
For information on the steps to Start, Stop, and Restart Initial and Incremental ETL, refer to Chapter 7 of the AM Installation Guide.
This section comprises the following sub-sections:
This section describes the steps required to monitor the ETL process using the Database Integrator Studio.
This section comprises the following sub-sections:
Before executing the Initial ETL, you can view the list of steps of the Load Plan for the Initial as well as the Incremental ETL.
To view the list of steps before and during the ETL process, execute the following steps:
Open the Oracle Data Integrator Studio and click Connect To Repository.
Log on to the ODI Work Repository using the ODI User credentials.
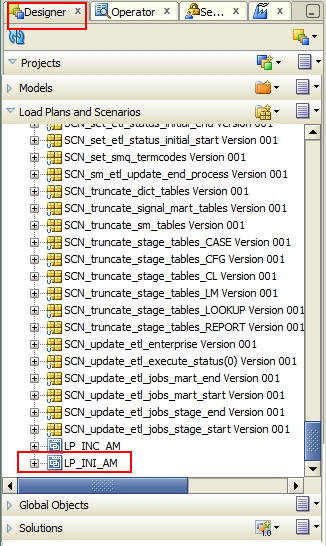
Select the Designer tab and expand the Load Plans and Scenarios section, as shown in the following figure:
Double-click the LI_INI_AM load plan.
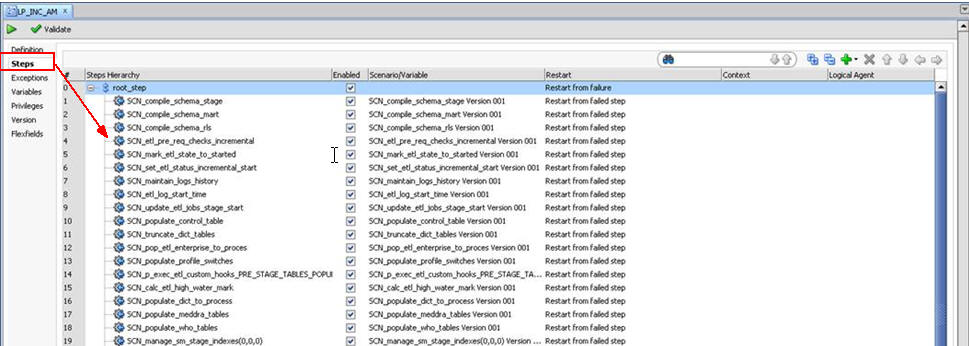
Select the Steps option in the right pane. This displays all the steps of the Load Plan, as depicted in the following figure:
Similarly, you can also view the steps for the Incremental Load Plan by double-clicking the LP_INC_AM Load Plan from the Load Plans and Scenarios section of the Designer tab.
To monitor the progress of the initial ETL after executing the LP_INI_AM Load Plan, execute the following steps:
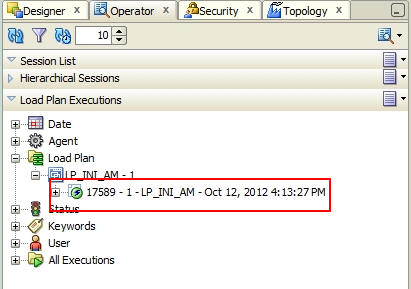
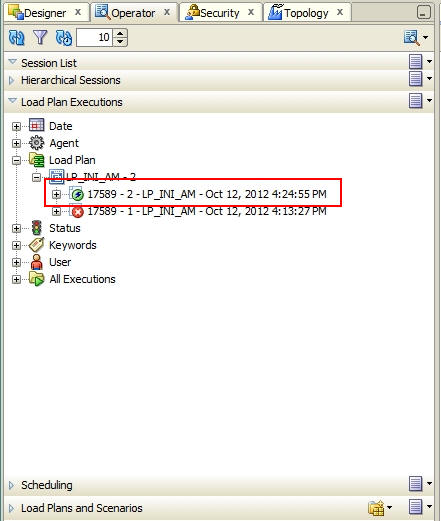
Select the Operator tab and expand the Load Plan folder in the Load Plan Executions section.
Expand the LP_INI_AM load plan to view the ETL process in progress. You can view a tilted s in Green color, which signifies that the process is running properly, as depicted in the following figure:
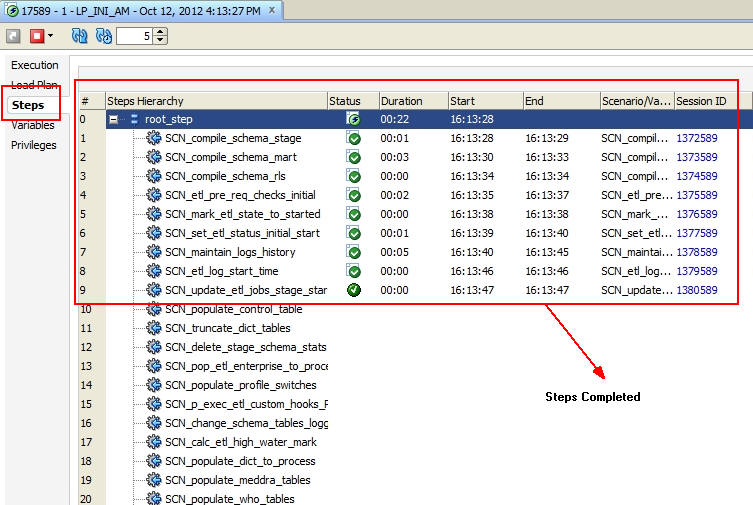
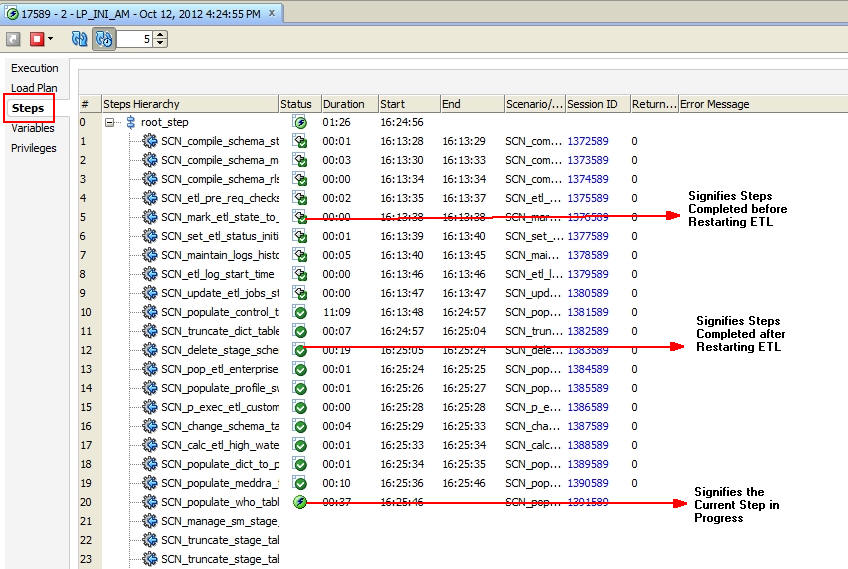
Double-click the ETL session, highlighted in the figure above, and select Steps in the right pane. This displays the list of steps for the Load Plan. It also displays the steps that have been completed successfully, as depicted in the following figure:
You can view the step where the ETL process failed and also view the error message related to the ETL process failure, using the following procedure:
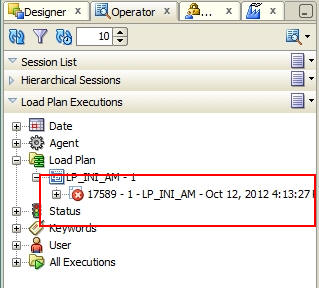
In the Operator tab, expand the Load Plan folder in the Load Plan Executions section to view the current status of the ETL process, as shown in the following figure:
You can view the status of the Load Plan in Red color with the X symbol, which signifies that the ETL session is not in progress.
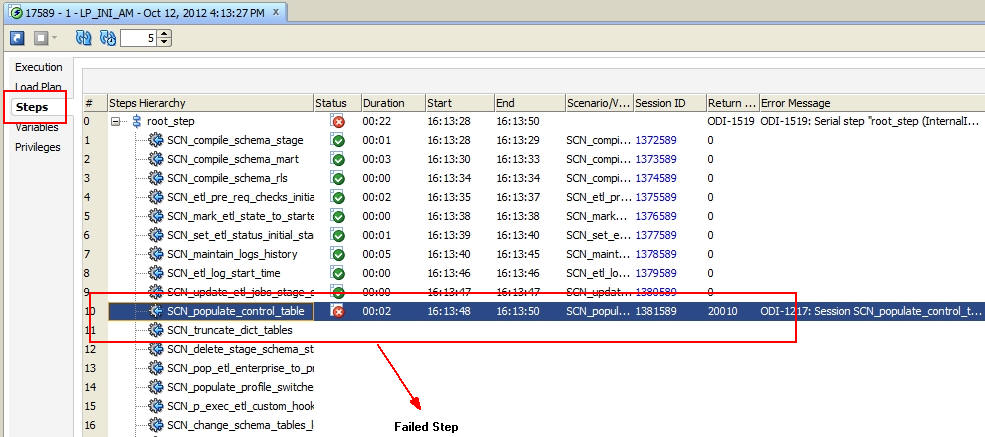
Double-click the Load Plan and select Steps. This displays the list of steps for the Load Plan in the right pane. The step because of which the ETL process has failed, is highlighted in Red color with the X symbol, as highlighted in the following figure:
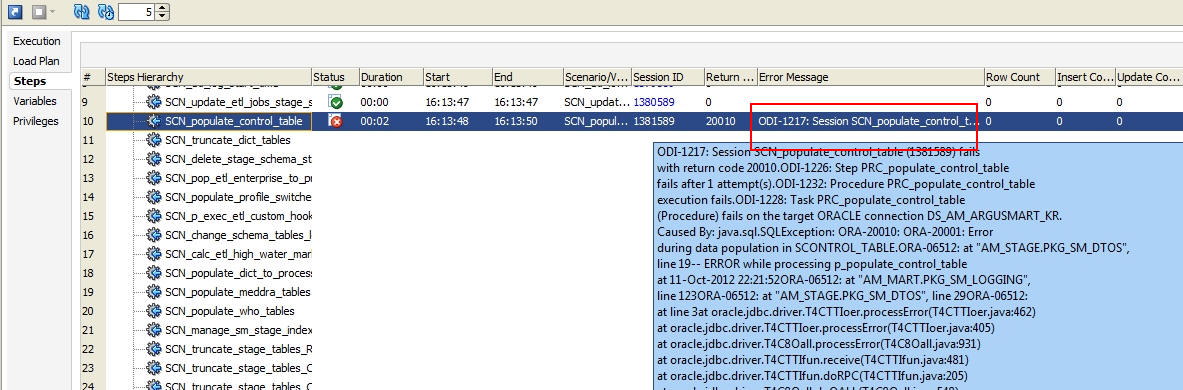
You can move the mouse cursor over the error message to view the complete message, as shown in the following figure:
You can also select Execution for more information about the error message, as depicted in the following figure:
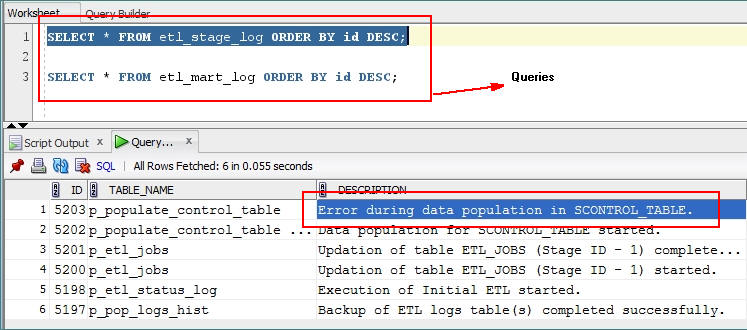
You can also log on to the Oracle SQL Developer using the Argus ETL user credentials and execute the queries to view the error message, as shown in the following figure:
The following are the queries that you can use to view the location of the error:
SELECT * FROM etl_stage_log ORDER BY id DESC;
If you are not able to view any error message after executing this query, you can execute the query mentioned in point 2.
SELECT * FROM etl_mart_log ORDER BY id DESC;
Once you have restarted a stopped ETL process, you can view the status of the process using the following procedure:
In the Operator tab, expand the Load Plan folder in the Load Plan Executions section to view the current status of the ETL process, as shown in the following figure:
This restarted ETL Process is in Green color with a tilted s, which signifies that the ETL is in progress again.
You can view the status of the remaining steps in the process by double-clicking the Load Plan in the LP_INI_AM folder and selecting Steps, as depicted in the following figure:
The AM.zip file is configured with one incremental ETL run by default. This ETL run is in Inactive mode. You can activate and schedule the Load Plan according to the requirements.
To schedule a Load Plan, execute the following steps:
In the Designer tab, navigate to Load Plans and Scenarios section and expand LP_INI_AM (Load Plan for Initial ETL).
Right-click Scheduling and select New Scheduling, as depicted in the following figure:
This displays the Load Plan Scheduling dialog box, as depicted in the following figure:
You can set options given in the Status and Execution sections, according to the requirements to schedule the Load Plan.
This section describes the steps required to monitor the ETL process using the Database Integrator Console.
This section comprises the following sub-sections:
Before executing the Initial ETL, you can view the list of steps of the Load Plan for the Initial as well as the Incremental ETL.
To view the list of steps before and during the ETL process, execute the following steps:
Log on the Oracle Data Integrator Console and select the Management tab.
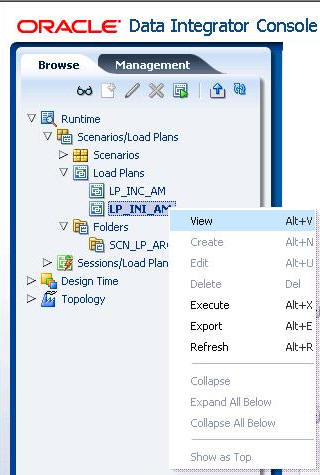
Navigate to Runtime > Scenarios/Load Plans > Load Plans.
Right-click LP_INI_AM (Load Plan for Initial ETL) or LP_INC_AM (Load Plan for Incremental ETL) and select View, as shown in the following figure:
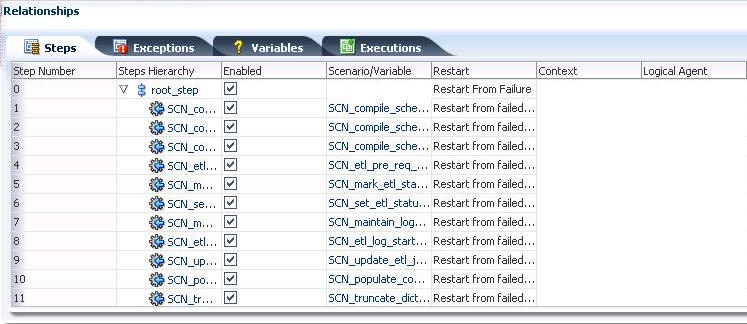
This displays the steps for the Load Plan in the Relationships section in the right pane, as depicted in the following figure:
To monitor the progress of the initial ETL after executing the LP_INI_AM Load Plan, execute the following steps:
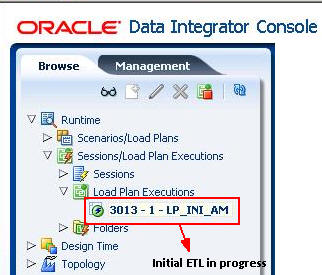
Select the Management tab and navigate to Runtime > Sessions/Load Plan Executions > Load Plan Executions.
You can view a tilted s in Green color, which signifies that the ETL process is running properly, as depicted in the following figure:
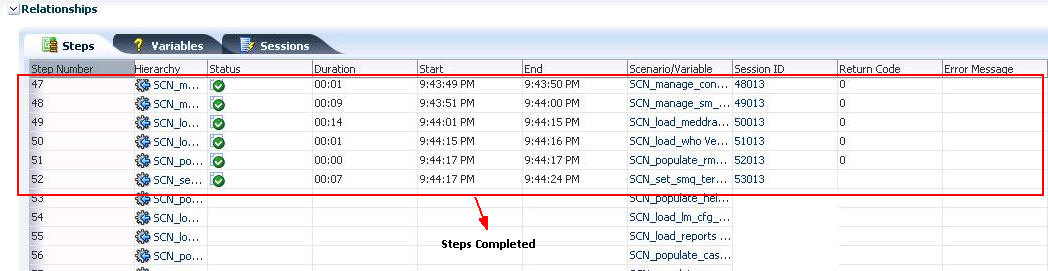
Double-click the session to view the list of steps in the Relationships section in the right pane. It also displays the list of steps that have been completed, as depicted in the following figure:
You can view the step where the ETL process failed and also view the error message related to the ETL process failure, using the following procedure:
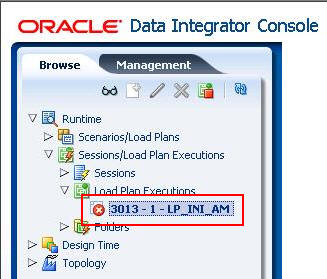
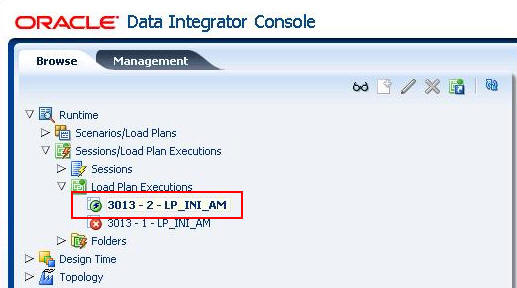
In the Management tab, navigate to Runtime > Sessions/Load Plan Executions > Load Plan Executions, to view the current status of the ETL process, as shown in the following figure:
You can view the status of the Load Plan in Red color with the X symbol, which signifies that the ETL session is not in progress.
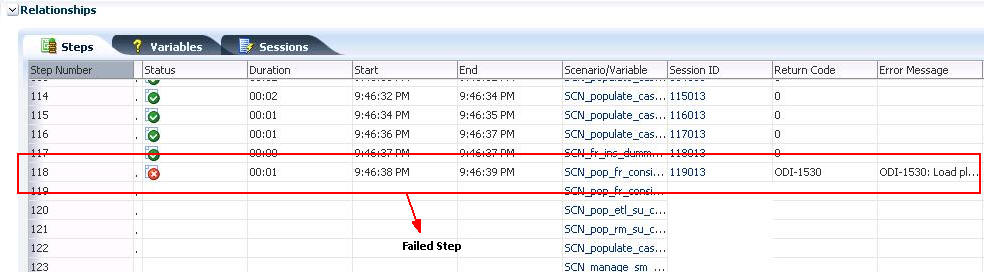
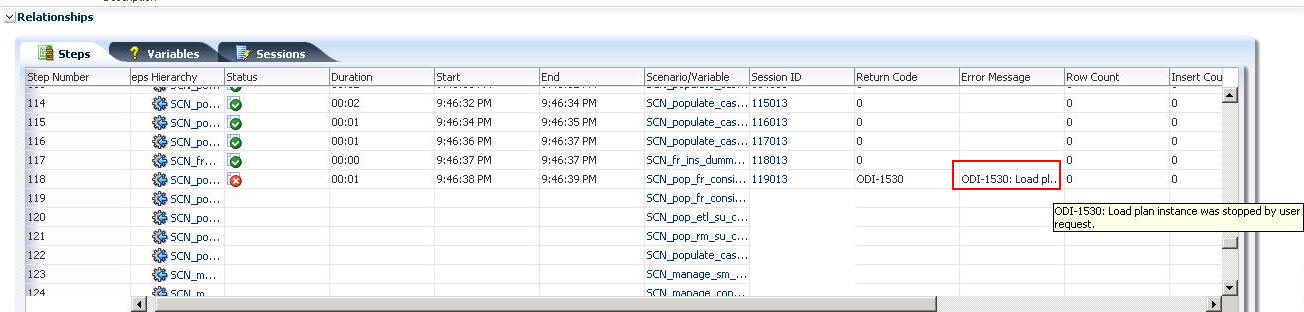
Double-click the Load Plan. This displays the list of steps for the Load Plan in the Relationship section in the right pane. The step because of which the ETL process has failed, is highlighted in Red color with the X symbol, as highlighted in the following figure:
You can move the mouse cursor over the error message to view the complete message, as shown in the following figure:
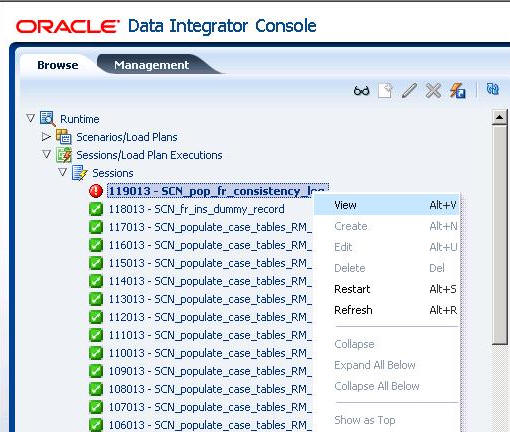
You can also navigate to Runtime > Sessions/Load Plan Executions > Sessions, right-click the stopped session, highlighted in Red color with the ! symbol, and select View, as depicted in the following figure:
This displays the error details in the right pane, as depicted in the following figure:
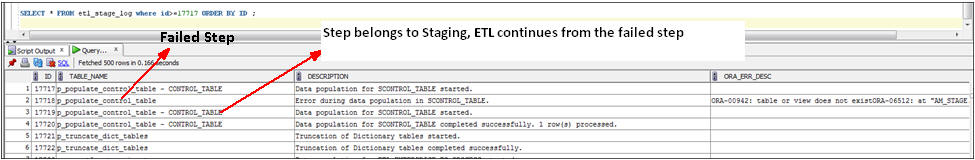
You can also log on to the Oracle SQL Developer using the Argus ETL user credentials and execute the queries to view the error message, as shown in the following figure:
The following are the queries that you can use to view the location of the error:
SELECT * FROM etl_stage_log ORDER BY id DESC;
If you are not able to view any error message after executing this query, you can execute the query mentioned in point 2.
SELECT * FROM etl_mart_log ORDER BY id DESC;
Once you have restarted a stopped ETL process, you can view the status of the process using the following procedure:
In the Management tab, navigate to Runtime > Sessions/Load Plan Executions > Load Plan Executions section, to view the current status of the ETL process, as shown in the following figure:
This restarted ETL Process is in Green color with a tilted s, which signifies that the ETL is in progress again.
You can view the status of the steps completed before restarting the ETL and the steps after restarting the ETL, by double-clicking the session in progress.
The steps display in the Relationship section in the right pane, as depicted in the following figure:
The complete ETL process is divided into two major phases: Staging and Mart. The Mart phase starts only when the Staging phase is complete.
This section explains the behavior of the ETL process if you choose to resume the Incremental ETL from the failed or stopped point.
If the last execution step of the failed or stopped ETL belongs to the Staging phase, the ETL resumes from the failed or stopped point, as shown in the following figure:
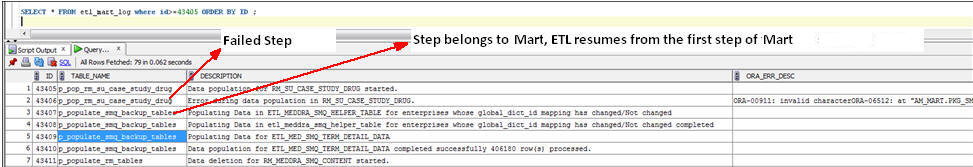
However, if the last execution step of the failed or stopped ETL belongs to the Mart phase, the ETL resumes from the first step of the Mart phase and not from the failed or stopped point, as depicted in the following figure:
|
Copyright © 2011, 2013, Oracle and/or its affiliates. All rights reserved. Legal Notices |
|