Oracle®
Agile Product Lifecycle Management for Process
Reporting Guide
Extensibility Pack 3.6
E50226-01
October 2013
![]()
Reporting Guide
Extensibility Pack 3.6
E50226-01
October 2013
![]()
Agile Product Lifecycle Management for Process
Copyright © 1995, 2013, Oracle and/or its affiliates. All rights reserved.
This software and related documentation are provided under a license agreement containing restrictions on use and disclosure and are protected by intellectual property laws. Except as expressly permitted in your license agreement or allowed by law, you may not use, copy, reproduce, translate, broadcast, modify, license, transmit, distribute, exhibit, perform, publish, or display any part, in any form, or by any means. Reverse engineering, disassembly, or decompilation of this software, unless required by law for interoperability, is prohibited.
The information contained herein is subject to change without notice and is not warranted to be error-free. If you find any errors, please report them to us in writing.
If this is software or related documentation that is delivered to the U.S. Government or anyone licensing it on behalf of the U.S. Government, the following notice is applicable:
U.S. GOVERNMENT END USERS: Oracle programs, including any operating system, integrated software, any programs installed on the hardware, and/or documentation, delivered to U.S. Government end users are "commercial computer software" pursuant to the applicable Federal Acquisition Regulation and agency-specific supplemental regulations. As such, use, duplication, disclosure, modification, and adaptation of the programs, including any operating system, integrated software, any programs installed on the hardware, and/or documentation, shall be subject to license terms and license restrictions applicable to the programs. No other rights are granted to the U.S. Government.
This software is developed for general use in a variety of information management applications. It is not developed or intended for use in any inherently dangerous applications, including applications which may create a risk of personal injury. If you use this software in dangerous applications, then you shall be responsible to take all appropriate fail-safe, backup, redundancy, and other measures to ensure the safe use of this software. Oracle Corporation and its affiliates disclaim any liability for any damages caused by use of this software in dangerous applications.
Oracle and Java are registered trademarks of Oracle and/or its affiliates. Other names may be trademarks of their respective owners.
Intel and Intel Xeon are trademarks or registered trademarks of Intel Corporation. All SPARC trademarks are used under license and are trademarks or registered trademarks of SPARC International, Inc. AMD, Opteron, the AMD logo, and the AMD Opteron logo are trademarks or registered trademarks of Advanced Micro Devices. UNIX is a registered trademark of The Open Group.
This software and documentation may provide access to or information on content, products, and services from third parties. Oracle Corporation and its affiliates are not responsible for and expressly disclaim all warranties of any kind with respect to third-party content, products, and services. Oracle Corporation and its affiliates will not be responsible for any loss, costs, or damages incurred due to your access to or use of third-party content, products, or services.
Contents
Configuring
the CustomReportExtensions.xml File
Configuring
Report Parameter Types
Configuring
Contextual Reporting
Adding
Custom Reports to Supplier Portal
Setting
Up Contextual Custom Reports in Supplier Portal
PLM
for Process Reporting Database Layer
Installing
a PLM for Process Reference Implementation Report Pack
Configuring
the Proper Data Model – Oracle or SQL Server
Copy
Reference Reports to another Directory for Customization
Report
is Called using PLM for Process Reporting Application
BI
Publisher Report is Called Directly either through a Link or the BI Publisher
UI
Calling
a BI Publisher Report Directly from a Link in PLM for Process
Creating
Links within a Report
Use
of Workflow Tags in PQM Report Pack
Individual
Supplier Quality (PQM)
Individual
Supplier Quality – Supplier Portal (PQM)
Appendix A – Creating Custom Report Parameter Types
Appendix B – Applying Security to Reports
UserRoleBasedSecurityPluginFactory
UserPropertyBasedSecurityPluginFactory
UserGroupBasedSecurityPluginFactory
Appendix C – Object Loader URLs
Appendix D – Third Party External Application Integration
Implementing
IReportGenerationService
Implementing
IReportGenerationService
Appendix E – BI Publisher Reports and Corresponding
Analytics
Individual
Supplier Quality Report
Individual
Supplier Quality – Supplier Portal Report
Open
Issues by Supplier Report
Supplier
Rationalization Report
Supplier
Compliance Report – CF Report
Supplier
Compliance Report – SA Report
Supplier
Compliance Report – SP Report
This guide is intended for client programmers involved with integrating Oracle Agile Product Lifecycle Management for Process. Information about using Oracle Agile PLM for Process resides in application-specific user guides. Information about administering Oracle Agile PLM for Process resides in the Oracle Agile Product Lifecycle Management for Process Administrator User Guide.
Descriptions and illustrations of the Agile PLM for Process user interface included in this manual may not match your installation. The user interface of Agile PLM for Process applications and the features included can vary greatly depending on such variables as:
§ Which applications your organization has purchased and installed
§ Configuration settings that may turn features off or on
§ Customization specific to your organization
§ Security settings as they apply to the system and your user account
For information about Oracle's commitment to accessibility, visit the Oracle Accessibility Program website at http://www.oracle.com/pls/topic/lookup?ctx=acc&id=docacc.
Oracle customers have access to electronic support through My Oracle Support. For information, visit http://www.oracle.com/pls/topic/lookup?ctx=acc&id=info or visit http://www.oracle.com/pls/topic/lookup?ctx=acc&id=trs if you are hearing impaired.
Oracle Software Delivery Cloud (OSDC) provides the latest copy of the core software. Note the core software does not include all patches and hot fixes. Access OSDC at:
http://edelivery.oracle.com.
This guide describes how to configure custom reports for the Oracle Agile Product Lifecycle Management (PLM) for Process Reporting module.
The Reporting application allows client to organize, configure, secure, and launch custom reports. The configuration is managed in the CustomerReportExtensions.xml located in the \Config\Extensions\ directory. Clients can configure custom reports, specify the categorization of the reports, configure visibility rules via custom classes, and define the various report parameters to display.
Reports are categorized by two grouping levels: Report Contexts and Report Groups, each of which can be secured by configuring security classes.
Report parameters can use existing pop-ups found throughout the application, or use custom-defined parameters. The parameter values are then sent to a reporting service, such as Oracle BI Publisher or SQL Server Reporting Services, which process the parameters to make custom SQL queries to produce the report output. The reporting service then returns the results to the user.
For details on configuring the reporting service, see the Agile Product Lifecycle Management for Process Configuration Guide.
The report generation screen allows users to select an available report, enter report parameters, select an output format, and launch the report.
Figure 1. Sample Report Generation Screen
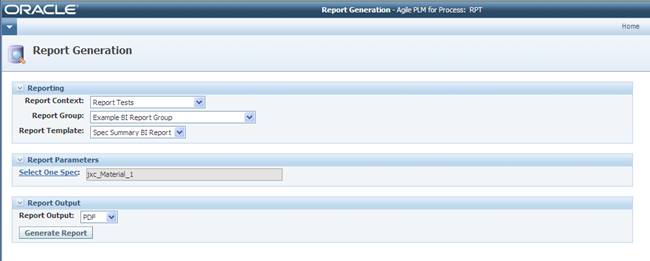
The Report Generation screen is comprised of three main sections:
1. Reporting--Provides a way to organize, categorize, and secure reports.
2. Report Parameters—Presents parameter input and options for each report.
3. Report Output—Presents the possible reporting output formats, such as XML and PDF.
The data that is displayed to users is driven from the CustomerReportExtensions.xml file. This guide explains how to configure this file for custom reporting needs.
Customizing the report configuration primarily consists of defining any new report parameters types that will be available to the reports, and configuring the custom reports. Any changes to the CustomerReportExtensions.xml file will require the ProdikaReporting web application to be restarted.
Common objects, such as report parameter input types and common reports are defined in the ServiceConfig section. The reports, their categorization, security, and parameter details are defined in the ReportContexts section. The Contextual Reporting section defines ways to launch specific reports from the various web applications (such as GSM, SCRM) based on several criteria.
A high-level outline of the Report Contexts and ServiceConfig hierarchies found in the CustomerReportExtensions.xml file follows:
§ ServiceConfig
o
ParameterTypes
§
ParameterType
o
CommonReports
§ ReportContexts
o
ReportContext
§
ContextCriteria
§
ReportGroup
§ Parameters
§ Reports
o
Report
§
AllowedOutputTypes
Reports are categorized by two grouping levels: Report Contexts and Report Groups.
§ Report Contexts represent the highest level of report organization, and contains multiple report groups. These are displayed in the Report Context drop-down list.
§ Report Groups provide a way to group multiple reports that all use the same report parameters. The parameters types specified for each ReportGroup are defined in a separate section called ServiceConfig.
The following sections contain detailed information on how to configure each of these nodes.
All report parameter types that are used by the reports must be defined in the \ServiceConfig\ParameterTypes section. These parameters may then be referenced by the reports defined in the \ReportContexts section. Several predefined report parameters are available for use, but you may also create their own custom parameter types.
There are three different types of report parameters:
1. Simple type parameters – Parameter input types, such as a string or date field input
2. DataSource parameter types – Classes that are responsible for retrieving data lists for display
3. Models – Predefined Oracle Agile PLM data retrievers that are already used in the application
Each parameter type must specify a user interface element that will be used to display the report parameter to the user. DataSource and Model report parameter types must also specify the method used to retrieve the data to display.
The following report parameters are automatically passed in and available to each report server request:
1. paramCurrentUser – The current user’s PKID (40 character unique identifier string)
2. paramCurrentLanguage – The current user’s language ID setting (see SupportedLanguages table)
Note: Currently these are only passed to Microsoft SQL Server Reporting Services.
Note: Using DataSources and Models requires detailed technical knowledge of the Oracle Agile PLM for Process application and may require writing custom classes. See Appendix A – Creating Custom Report Parameter Types for details.
The ParameterTypes node contains a list of ParameterType nodes. Each ParameterType defines an input parameter that may then be used to display selection criteria for reports.
|
Attribute Name |
Description |
Required? |
|
N/A |
|
|
§ <ParameterType>
§ <ServiceConfig>
The ParameterType node defines an input parameter that may then be used to display selection criteria for reports. Each Parameter Type must also declare the user interface control to use for displaying the report parameter to the user. The child nodes required are based on the specified web control.
|
Attribute
Name |
Description |
Required? |
|
type |
Unique identifier for this parameter type. This value will be used to refer to the parameter type when configuring which parameters are used for each report in a Report Group. |
Yes |
|
webControl |
The name of one of the following available web controls, or a custom control: § ReportingControls/StringInput.ascx – An input box that allows alphanumeric entry § ReportingControls/DateInput.ascx – A date picker control preset to the current date § ReportingControls/MonthYearInput.ascx – A month selection control and a year input control § ReportingControls/LookupInputSingleSelect.ascx – An drop-down input allowing a single selection from data specified by a DataSource § ReportingControls/LookupInputMultiSelect.ascx – A pop up control allowing multiple selections from data specified by a DataSource § ReportingControls/TreeViewInput.ascx – A pop up control for nested hierarchies, allowing a single or multiple selections from data specified by a DataSource § ReportingControls/EQTInput.ascx – A pop up control with differing behavior based on which existing EQT View is used The following controls are available in the ReportingExtensions package § ~/WebCommon/Extensions/Reporting/ConstantValueParameter.ascx – A hidden control that is set to some constant value, to be passed in automatically to the report. § ~/WebCommon/Extensions/Reporting/SessionParamCurrentSupplierUser.ascx – A hidden control that is set to a specific property of the current supplier user (such as the supplier rep PKID, email, etc), if used via SupplierPortal § ~/WebCommon/Extensions/Reporting/SessionParamCurrentUgmUser.ascx – A hidden control that is set to a specific property of the current UGM user (such as the user PKID, email, etc). § ~/WebCommon/Extensions/Reporting/SecuredObjectControl.ascx – A hidden control that retrieves a given PKID from the Request, using the supplied RequestParameterName (such as SpecID, CompanyID, etc), and checks the user’s security of the object specified by the PKID. The security check is performed by the specified SecurityHandler class. Several SecurityHandler classes are provided, but custom classes can be created using the Oracle.PLM4P.ReportingExtensions.Security.IHostObjectSecurityHandler interface See Appendix A – Creating Custom Report Parameter Types for more details on how each web control functions. |
Yes |
The possible child nodes will depend on which web control is used:
§ StringInput, DateInput: No child controls
§ MonthYearInput : Allows for customizing the parameter names for the month and year controls
o <MonthParamNameExtension> – InnerText should be set to the name extension
o <YearParamNameExtension> – InnerText should be set to the name extension
§ LookupInputSingleSelect, LookupInputMultiSelect:
o <DataSource>
§ TreeViewInput:
o <DataSource>
o
<MultiSelect> – InnerText should be ‘Yes’
to enable selection of multiple entries, or
‘No’ for single selection.
§ EQTInput:
o <Model>
§ <ParameterTypes>
The DataSource element is used to specify a class that will retrieve data to be used in the given web control. Existing DataSources may be used to retrieve data, or custom DataSource classes may be created to fulfill more specific requirements.
|
Attribute Name |
Description |
Required? |
|
className |
The full path of the DataSource class to use, along with any parameters. Format should be in the form of an Object Loader URL. Please see Appendix C – Object Loader URLs for details. Example: Class:Xeno.Web.UI.Controls.DataSources.LookupServiceListViewDataSource,XenoWebControls$Allergens|Allergens |
Yes |
§ N/A
§ <ParameterType>
The Model element is used to specify an existing search model (EQTModel) that will retrieve data to be used in the given EQTInput web control. The searches available through the EQT models may be much more detailed and allow the user to specify exact search criteria.
|
Attribute Name |
Description |
Required? |
|
displayVariableIndex |
Indicates which return value from the EQT popup selection should be displayed. When an EQT view returns a value for display, the /DisplayColumns/ColumnInfo element (from the Model node) includes an attribute provideInSelectJS="true". If multiple display columns in the EQT Model have the provideInSelectJS="true" attribute, the displayVariableIndex attribute determines which one should be displayed to the user. For Models that only return one display value, the displayVariableIndex attribute should be set to “1”. |
Yes |
§ The path to the EQT Model. See Appendix A – Creating Custom Report Parameter Types for more details.
§ N/A
§ <ParameterType>
The ReportContext node is used to group and secure related Report Groups together. All available Report Contexts are displayed to the user in the Report Context drop-down list of the Report Generation Screen.
|
Attribute Name |
Description |
Required? |
|
Name |
The name of the report context that will be displayed to the user in the Report Generation screen. |
Yes |
|
SecurityFactoryRef |
The security plug-in to use to limit access to this Report Context. See Appendix B – Applying Security to Reports for more details. |
No |
§ <ReportGroup>
§ <ContextCriteria>
§ <ReportContexts>
This node is currently not used.
§ <Parameters>
§ <ReportContext>
The ReportGroup node is used to group and secure related Report Groups together. All available Report Contexts are displayed to the user in the Report Context drop-down list of the Report Generation Screen.
|
Attribute
Name |
Description |
Required? |
|
name |
Used to uniquely identify this report group in the configuration files. |
Yes |
|
label |
The display name that will appear to users or the translation lookup key. See isLabelTranslatable below. |
Yes |
|
isLabelTranslatable |
true – Will use the value of the label attribute to look up the report group name in the translation caches, using the translationCache attribute, and return the translation. false – Will use the value of the label attribute as the display name of the report group. |
No |
|
translationCache |
The name of the translation cache used to look up the translation for the label value, if the isLabelTranslatable attribute is set to true. |
Yes if isLabelTranslatable is true |
|
securityFactoryRef |
The security plugin to use to limit access to this Report Context. The value must be a valid Object Loader URL. See Appendix B – Applying Security to Reports for more details. |
No |
|
serviceLocation |
If present, will use the given value as the web service location to use to process all reports in this report group; otherwise, will use the serviceLocation attribute value in the\ServiceConfig\ReportingService element. |
No |
|
reportEngineName |
If present this will specify which report engine all reports within that group will use. The options are: § SQLReportingService § OracleBIPublisher10_1_3_3 § OracleBIPublisher10_1_3_4 § OracleBIPublisher11_1_1_5 Refer to the Install/Upgrade Guide for setting the report engine configuration entries. If no report engine is specified it will use the default report engine: SQLReportingService Note: the default report engine can be changed in the
EnvironmentSettings.config file, by setting the default=”true” attribute to
the desired reportEngine entry in the /ProdikaReporting/ServiceConfig child
nodes. |
No |
§
Parameters
§ Reports
§ <ReportContext>
The Parameters node contains a list of Parameter nodes. Each Parameter will be used as input criteria for the reports in the current ReportGroup.
|
Attribute Name |
Description |
Required? |
|
N/A |
|
|
§ Parameter
§ <ReportGroup>
The Parameter node will be used as an input criterion for the reports in the current ReportGroup. The parameter declared here uses a Parameter Type that must be defined in the ServiceConfig section of the configuration.
|
Attribute
Name |
Description |
Required? |
|
name |
The name of the parameter that will be passed to the Report Server. Must be unique within the <Parameters> node. |
Yes |
|
label |
The display name that will appear to users or the translation lookup key. See isLabelTranslatable below. |
Yes |
|
isLabelTranslatable |
true – Will use the value of the label attribute to look up the parameter name in the translation cache of the parent ReportGroup and return the translation. false – Will use the value of the label attribute as the display name of the parameter. |
No – Will use false if not specified |
|
type |
The name of the ParameterType from the \ServiceConfig\ParameterTypes list. |
Yes |
|
Required |
true – This parameter will be a required criterion for launching the report. false – This parameter will be an optional criterion for launching the report. |
No – Will use false if not specified |
§ N/A
§ <Parameters>
The Reports node contains a list of Report elements. Each Report will use the same Report Parameters as input criteria in the current ReportGroup.
|
Attribute Name |
Description |
Required? |
|
N/A |
|
|
§ <Report>
§ <ReportGroup>
The Report node represents an individual report that can be launched using the report parameters defined by the current report group. Reports can reference previously declared common reports and use the attribute values defined for that original report.
|
Attribute
Name |
Description |
Required? |
|
id |
Used to uniquely identify reports that can be reused throughout the reporting configuration. If any other report in the configuration matches the id value, an error is thrown. See the Configuring Common Reports section on page 17. |
No |
|
idref |
May be used to reference a previously declared Common Report entry. The idref value must match the unique id value of the desired report. If a matching reference report is found, no other attributes from this element are used. If no matching report is found, an error is thrown. See the Configuring Common Reports section on page 17. |
No |
|
name |
Used to uniquely identify this report in the configuration files within the report group. |
Yes, unless id attribute is used |
|
label |
The display name that will appear to users or the translation lookup key. See isLabelTranslatable below. |
Yes |
|
isLabelTranslatable |
true – Will use the value of the label attribute to look up the report name in the translation cache of the parent ReportGroup and return the translation. false – Will use the value of the label attribute as the display name of the report. |
No – Will use false if not specified |
|
reportPath |
Path to the individual report on the reporting server. |
Yes |
|
serviceLocation |
If present, will use the given value as the web service location to use to process this report; otherwise, will use the ReportGroup’s value. |
No |
|
translationCache |
If present, will use the given value as the name of the translation cache to use to process this report’s label; otherwise, will use the ReportGroup’s value. |
No |
|
SecurityFactoryRef |
The security plug-in to use to limit access to this report. The value must be a valid Object Loader URL. See |
No |
|
template |
The name of the BI Publisher layout template to use for the report output. |
Yes if using BI Publisher for report generation; No otherwise |
|
reportEngineName |
If present this will specify which report engine this report will use. The options are: § SQLReportingService § OracleBIPublisher10_1_3_3 § OracleBIPublisher10_1_3_4 § OracleBIPublisher11_1_1_5
If no report engine is specified it will use the default report engine: SQLReportingService Note: the default report engine can be changed in the
EnvironmentSettings.config file, by setting the default=”true” attribute to
the desired reportEngine entry in the /ProdikaReporting/ServiceConfig child
nodes. |
No |
§ <AllowedOutputTypes>
§ <Reports>
The AllowedOutputTypes node contains a list of OutputType nodes indicating the possible output formats available for the report. Individual reports therefore restrict the full list of allowed output types defined in the \ServiceConfig\ActiveReportOutputTypes node.
|
Attribute Name |
Description |
Required? |
|
N/A |
|
|
§ AllowedOutputType
§ <Report>
The AllowedOutputType node indicates a possible output format available for the given report. Entries are limited to values defined in the reporting framework’s list, such as EXCEL, PDF.
|
Attribute
Name |
Description |
Required? |
|
key |
Unique identifier for the output type |
Yes |
|
value |
The display name |
Yes |
|
extension |
File extension (ex: “.pdf”) |
Yes |
§ N/A
§ <AllowedOutputTypes>
A <Report> node may also be defined in the /ServiceConfig/CommonReports section of the configuration and then referenced in other report groups. This allows a report to be defined once, but used multiple times. If, for instance, a particular report exists in multiple report groups, it would be beneficial to define the report in this section, and then reference it in those report groups.
For example, the following section declares a common report that can then be used anywhere else in the configuration:
<CommonReports configChildKey="name" >
<Report id="ExampleCommonReport" label="Example Common
Report" isLabelTranslatable="false"
reportPath="/ExampleReport/ExampleCommonReport">
<AllowedOutputTypes configChildKey="key">
<OutputType
key="PDF" value="PDF" extension=".pdf"/>
</AllowedOutputTypes>
</Report>
</CommonReports>
The id attribute represents the unique key that will need to be referenced if this report is to be included elsewhere. To include this report in a ReportGroup, simply declare the Report node with the idref attribute assigned to the above id. For example, the following ReportGroup declares a new report and also includes the ExampleCommonReport from the CommonReports section:
<Reports configChildKey="name">
<Report
name="ExampleReportA" label="Example Report A "
isLabelTranslatable="false"
reportPath="/ExampleReport/ExampleReportA">
</Report>
<Report idref="ExampleCommonReport" />
</Reports>
|
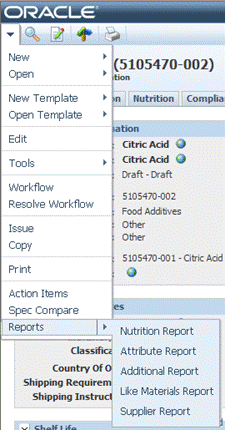
Individual Reports can be launched from most locations throughout the application suite (GSM, SCRM, NPD, PQS, CACS, NSM, CC, eQ Admin) by using Contextual Reporting. Report links are added by extending the Action Navigation and adding new menu item nodes. Each new menu item entry specifies which report context, report group, and individual report should be loaded, and can send specific data to the reporting application to pre-populate specific report parameters. The visibility of each report link can be configured easily, such as specifying that the report link is only available when the user is on a Packaging specification and if the user is a member of group “Packaging Reports.” See the Navigation Extensibility Guide for more information around how to add new navigational items and configure their visibility. Clicking the report link will launch the Reporting application in a popup window, allowing the user to maintain their current context. |
|
You
can display the active object’s name inside your report parameter fields. For
example, if the user is on the Cajun Spice Blend specification and the report
takes in a specification parameter, the string “Cajun Spice Blend” can appear
in the specification parameter field as a pre-selected value. For SpecInstanceReport items, the target
Report must contain a Parameter with name="paramObjectPKID"
using a parameter
type that is one of the pop‐up parameter types. Setting the parameter
type this way will allow for the name of the object to be displayed. Setting
the parameter type to a parameter type string will simply display the PKID
itself.
For Contextual Reporting, the new navigation item must be assigned an XML attribute, called ClientSideCommand, which is configured with the following possible behaviors:
1. Launching reports using the report parameter screen, which allows users to select other report parameters
a.
LaunchSpecificObjectPKIDReport
– will launch the specified report,
sending the current business object’s PKID and name to the Reporting
Application. If the specified report has a report parameter with a
name=”paramObjectPKID”, it will be pre-filled with the object’s name for
display, and the object’s PKID for the value.
Required parameters:
i. report context name
ii.
report group name
iii.
report name
Example:
If you have a NLEA Fact Panel (report name: NLEAPanel) report inside the context Material Reports (context name: Material) and group Nutritional Reports (group name: Nutritional) and you want to call that report using contextual reporting you would use the following function:
LaunchSpecificObjectPKIDReport('Material', 'Nutritional', 'NLEAPanel');
If you want to show the navigation item on a material specification when it’s in read mode, the menu item node would look something like this:
<MenuItem ID="GSMNavSpec" configChildKey="ID">
<MenuItem ID="NLEAPAnel" DisplayText="NLEA Panel" ClientSideCommand="LaunchSpecificObjectPKIDReport('Material', 'Nutritional', 'NLEAPanel');" Visible="eval:${ObjectType}==1004 && ${IsInReadMode}" />
</MenuItem>
b.
LaunchObjectTypeReport
– will launch the specified report, sending
the current business object’s 4-digit object Type value to the Reporting
Application. If the specified report has a report parameter with a
name=”paramObjectType”, it will be pre-filled with the object’s 4-digit type
for the parameter value.
Required parameters:
i. report context name
ii. report group name
iii. report name
2. Automatically
launching reports with no further user entry. This feature requires the
ReportingExtensions package, available in the Utils folder, and contains a
report launch page and various report parameter controls.
To launch a report automatically, the ClientSideCommand specifies the
following:
a. Open a new popup window using a URL pointing to the /Reporting/WebCommon/Extensions/Reporting/AutoReportLauncher.aspx, available in the ReportingExtensions package.
b. the report context, group, and report name using a pipe delimiter and assigning it to the ReportConfig parameter
i. For example: ReportConfig=Material|Nutritional|NLEAPanel
c. the current object’s parameter name and assigning it to the Javascript function GetObjectHeader_ObjectPKID()
i. For example: . . . &SpecID=' + GetObjectHeader_ObjectPKID()
d. The popup window properties
For example:
<MenuItem ID="GSMNavSpec" DisplayText="**GSM" IsInEditMode="${IsInEditMode}" >
<MenuItem ID="lblOpenIssuesBySpec" Text="Open Issues By Spec Report"
ClientSideCommand="var win = window.open('/Reporting/WebCommon/Extensions/Reporting/AutoReportLauncher.aspx?ReportConfig=PQM Reports|OpenIssues|OpenIssuesbySpec&SpecID=' + GetObjectHeader_ObjectPKID(),'Reporting', 'height=600,width=800,status=no,toolbar=no,menubar=no,location=no,dependent=yes,scrollbars=yes,resizable=1');win.focus();" />
</MenuItem>
Note that for auto launching reports, all report parameters for the given report must be configured using the IsHidden xml element. For instance, the sample report, Open Issues By Spec, is configured using two report parameters, IssueSpecific and SpecID:
<ReportGroup name="OpenIssues" label="Open
Issues by Spec" isLabelTranslatable="false"
translationCache="Reporting">
<Parameters configChildKey="name">
<Parameter name="IssueSpecific" label="IssueSpecific" isLabelTranslatable="false" type="Constant_IssueSpecific" Required="true"/>
<Parameter name="SpecID"
label="SpecID" isLabelTranslatable="false"
type="SecuredSpec"
Required="true"/>
</Parameters>
<Reports configChildKey="name">
<Report
name="OpenIssuesbySpec"
ReportEngine="OracleBIPublisher11_1_1_5" label="Open
Issues by Spec" isLabelTranslatable="false"
reportPath="/PLMforProcess_Reference/PQM/Reports/Open Issues by
Spec.xdo" template="Open Issues">
<AllowedOutputTypes
configChildKey="key"><OutputType key="PDF"
value="PDF"
extension=".pdf"/></AllowedOutputTypes>
</Report>
</Reports>
</ReportGroup>
There report parameters use the Constant_IssueSpecific and the SecuredSpec report Parameter Types, defined as follows:
<ParameterType type="Constant_IssueSpecific" webControl="~/WebCommon/Extensions/Reporting/ConstantValueParameter.ascx" >
<Value>True</Value>
<IsHidden>true</IsHidden>
</ParameterType>
<ParameterType type="SecuredSpec" webControl="~/WebCommon/Extensions/Reporting/SecuredObjectControl.ascx" >
<SecurityHandler>Class:Oracle.PLM4P.ReportingExtensions.Security.UGMUserSpecSecurityHandler,ReportingExtensions</SecurityHandler>
<RequestParameterName>SpecID</RequestParameterName>
<IsHidden>true</IsHidden>
</ParameterType>
Note that the
RequestParameterName (SpecID) in the SecuredSpec ParameterType must match the
parameter name assigned to the GetObjectHeader_ObjectPKID() function in
the URL above.
You can now provide links to custom reports in Supplier Portal.
Important Note: Remember security should be the primary concern when providing reports to suppliers. If the supplier can select parameters, only allow them to select objects they have access to.
You set up a supplier portal report in the same way as any
other custom report. See the example
below for a specific example. Notice the
name “SupplierReports”.
<ReportContext name="SupplierReports" configChildKey="name">
<ReportGroup name="QualityReports" label="Quality Reports Group" isLabelTranslatable="false" translationCache="Reporting">
<Parameters configChildKey="name">
<Parameter name="paramSpecID" label="Select One Spec" isLabelTranslatable="false" type="SupplierQuality" Required="true"/>
</Parameters>
<Reports configChildKey="name">
<Report name="QualitytBIReport" label="Quality BI Report" isLabelTranslatable="false" reportPath="/PLM for Process Sample Reports/Sample Spec Summary Report/Sample Spec Summary Report.xdo" template="ExampleLayout">
<AllowedOutputTypes configChildKey="key">
<OutputType key="PDF" value="PDF" extension=".pdf"/>
<OutputType key="EXCEL" value="EXCEL" extension=".xls"/>
</AllowedOutputTypes>
</Report>
</Reports>
</ReportGroup>
</ReportContext>
However, SupplierPortal does not use the Reporting web application to launch reports.
You can add a link to the report using the following format:
<MenuItem ID="lblSampleReport" Text="Sample Report" ClientSideCommand="var win = window.open('/SupplierPortal/Popups/SimplePopup.aspx?ContentKey=SupplierReporting&ReportConfig=<REPORT_CONTEXT_NAME>|<REPORT_GROUP_NAME>|<REPORT_NAME>','Prodika_SupplierReporting','titlebar=no,width=800,height=450,left='+(((screen.width-10-800)/2)+0)+',top='+(((screen.height-35-450)/2)+0));win.focus();" />
NOTE: The “ReportConfig” should be a
combination of the report context, group name and report name using the pipe delimiter
(|).
<MenuItem ID="SpecificationAndDocumentsListing" configChildKey="ID">
<MenuItem ID="lblQualityReports" Text="Quality Reports" configChildKey="ID">
<MenuItem ID="lblSampleReport" Text="Sample Report" ClientSideCommand="var win = window.open('/SupplierPortal/Popups/SimplePopup.aspx?ContentKey=SupplierReporting&ReportConfig=SupplierReports|QualityReports|QualitytBIReport','Prodika_SupplierReporting','titlebar=no,width=800,height=450,left='+(((screen.width-10-800)/2)+0)+',top='+(((screen.height-35-450)/2)+0));win.focus();" />
</MenuItem>
</MenuItem>
You can add custom report command to object navigation also. To achieve this, please add the menu item config as the following format:
<MenuItem ID="lblSampleReport" ClientSideCommand="var win = window.open('/SupplierPortal/Popups/SimplePopup.aspx?ContentKey=SupplierReporting&ReportConfig=<REPORT_CONTEXT_NAME>|<REPORT_GROUP_NAME>|<REPORT_NAME>& SpecId=${SpecID}','Prodika_SupplierReporting','titlebar=no,width=800,height=450,left='+(((screen.width-10-800)/2)+0)+',top='+(((screen.height-35-450)/2)+0));win.focus();" />
This difference with primary navigation is that you should supply one more parameter: SpecId=${SpecID}
<MenuItem ID="1004">
<MenuItem ID="lblSampleReport" ClientSideCommand="var win = window.open('/SupplierPortal/Popups/SimplePopup.aspx?ContentKey=SupplierReporting&ReportConfig=SupplierReports|QualityReports|QualitytBIReport&SpecId=${SpecID}','Prodika_SupplierReporting','titlebar=no,width=800,height=450,left='+(((screen.width-10-800)/2)+0)+',top='+(((screen.height-35-450)/2)+0));win.focus();" />
</MenuItem>
Customers that want to execute custom reports using Oracle BI Publisher are able to do so. Starting from Agile PLM for Process Extensibility Pack 3.1, there are BI Publisher reports available as a reference implementation, known as Report Packs. This section discusses how to use the reference implementations and develop new reports with BI Publisher.
To facilitate reporting, database objects such as views, stored procedures and tables were created and are part of what is called the PLM for Process Reporting Database Layer. The Reporting Database Layer is a prerequisite for the Report Packs. Installation instructions and a description of the Reporting Database Layer can be found in the Extensibility Pack starting with release 3.1, in the ReferenceImplementations\ReportingDBLayer directory. Follow the installation instructions found there.
It is recommended to always install the latest BI Publisher release with all the patches. BI Publisher documentation can be found here: http://www.oracle.com/technetwork/middleware/bi-foundation/documentation/bi-pub-096318.html
Because it is believed that reports delivered by Oracle will be customized for each implementation, the reports are delivered as a reference implementation. The reports are intended to be copied to another BI Publisher directory where they can then be customized. If they are modified in the original directory then they might be overwritten with the installation of the next version of the Report Pack.
The Report Packs are found in the Extensibility Pack starting with release 3.1, in the ReferenceImplementations\ReferenceReportPacks. They are created by PLM for Process Module and can be installed one at a time.
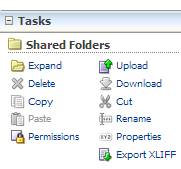
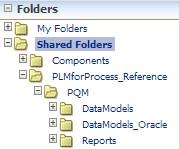
There is one .xdrz file per Reporting Pack. This file is a BI Publisher binary file which is the folder containing all the reports and the BI Publisher Data Models for both Oracle and SQL Server. This file should be uploaded to the ‘Shared Folders’ directory in BI Publisher. To upload this file you will need to go to: ‘http://{host}:{port}/xmlpserver/servlet/catalog’ where {host} and {port} are those of your BI Publisher installation. When you use this URL, the ‘Upload’ functionality becomes available in the lower left panel as shown here:
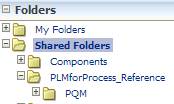
After uploading this file, there should be a new folder under ‘Shared Folders’ called ‘PLMforProcess_Reference’. Under this folder there will be one folder per Report Pack. The following image shows the example of the PQM Report Pack installed. If not uploaded to this location the reports will not function.
Out of the box, under the Reporting Pack folder such as ‘PQM’, there are 2 Data Model folders, one for Oracle and one for SQL Server. They are named ‘DataModels_’ with either ‘Oracle’ or ‘SQL Server’ appended to it. You will need to rename the one you want to use to just ‘DataModels’. If you like you can delete the other one. Below is an example of the Data Models configured to use SQL Server.
All the reports in the Report Packs are reference implementations and should not be modified directly. Create another directory and copy the Report Pack directory into it.
In order for the reports to use the intended BI Publisher Data Models (the one in the new folder), each report will have to be update to point to the Data Model in the newly created folder. If this is not done then the reports will be using the Data Models in the reference implementation.
There are different types of security that can be applied depending on how the report is called.
1. Report level: The report itself can be secured by using the UserGroupBasedSecurityPluginFactory or the UserRoleBasedSecurityPluginFactory explained in Appendix B – Applying Security to Reports
2. Parameter Level: PLM for Process can perform security verification on the parameters passed to the report using the SecuredObjectControl.ascx, described above.
1. Report level: BI Publisher roles can be used to secure access to the report. See BI Publisher documentation for more detail.
2. Parameter Level:
§ For SQL Server – A query can be executed in the report which then calls a function to validate if the user has access to the parameter. If the user does not have access then the query should generate an exception which will not return any data for the report.
§
For
Oracle – A BI Publisher ‘Before Data’ Event Trigger could be used to call
an Oracle function that validates if the user has access to the parameter.
There are some examples of this in the PQM Reporting Pack. One report is
‘OpenIssuesWithActions_BySpec’. You can see how the specification is secured by
looking at the event trigger and the function that is called.
When a user does not have access to the parameters there will be no data
returned for the report. They will not receive a message that the user does not
have access.
To help the report writer test and debug the security functionality, they can
turn on security debugging which is explained in the Reporting Database Layer
documentation which can be found in the ReferenceImplementations\ReportingDBLayer
of the Extensibility Pack.
If accessing the report through BI Publisher directly, the users must login in order to take advantage of the security options. If securing the parameters the user’s name will have to match that in PLM for Process, since that is what is being used to check authorization. It is recommended that a Single Sign On solution be used between PLM for Process and BI Publisher.
There are two aspects to multilingual support.
1. Labels: The report labels are controlled by the user’s setting in BI Publisher. By setting the Report Locale and UI Language in ‘My Account’ within BI Publisher, the report labels can be translated. In the reference implementation there are no translation files, so customers will have to translate the labels if needed.
2. Data: The data that is returned from PLM for Process can be multilingual. The Reporting Packs are enabled for this for Oracle only. BI Publisher provides the ability to call an Oracle function when the database connection is established. The Reporting Packs use this feature to enable multilingual data. The function that is called, sets a database session variable to the language ID of the PLM for Process user. The queries executed will then take advantage of this variable. The views in the Oracle Reporting DB Layer are designed to use this. The PLM for Process user will have to have the same login name as the BI Publisher user. The function that is called is configured in the ‘Pre Process Function’ field within the BI Publisher Data Source.
Calling a BI Publisher report directly from a link, allows
users to take advantage of the BI
Publisher Interactive output format. The interactive format allows for report
filtering by selecting components of charts and lists. See the BI Publisher
documentation for more information about the interactive output format.
Another advantage is that is that configuration is simpler. In other words a
report does not need to be configured in the PLM for Process Report
Application.
The disadvantage is that in order to secure the report and parameters a Single Sign On solution will need to be used in order to maintain a consistent user across the applications.
To configure a link within PLM for Process, please see the Agile PLM for Process Navigation Configuration Guide. This guide shows how to access contextual data depending on the active object. For instance if the link is on a Specification, it is possible to access the Spec Type and Spec ID and if on a Facility the Facility ID can be accessed. This data can be passed to a report. To construct the report URL to be called follow the below steps:
1. Execute a report which takes parameters, directly in BI Publisher
2. Pull down the menu from the Actions icon on the top right side of the report as shown below.
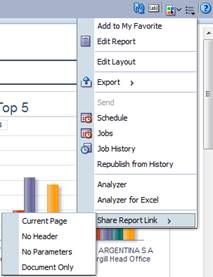
3. Select ‘Share Report Link’ and then choose one of the child menu items, depending on what you want.
4. A popup will then display the URL to access the report. Copy this URL and paste it into a text editor.
5. Replace the parameters values with the proper JavaScript functions or variables explained in the Navigation Extensibility Guide.
6. Convert the URL to a valid ASCII format i.e. URL Encoding
For example a report taking the CompanyID as a parameter could be launched from a Company profile within SCRM. The CompanyID could be retrieved and inserted as a parameter in a URL by first getting the data using the GetObjectHeader_ObjectPKID() JavaScript function and then constructing the URL with it. The URL would look like this after URL Encoding:
http://mysBIPServer:7001/xmlpserver/PLMforProcess/PQM/Individual%20Supplier%20Quality.xdo?_xpf=&_xpt=0&_xdo=%2FPLMforProcess%2FPQM%2FSupplierManagement%2FIndividual%20Supplier%20Quality.xdo&_xmode=2&xdo%3Axdo%3A&xdo%3Axdo%3A&xdo%3Axdo%3A&_paramsCompanyID='+GetObjectHeader_ObjectPKID()+'&_xt=Action%20List%20RTF&_xf=html&
This link holds display options such as the output format and whether or not the parameters should appear.
Once this link is configured and it appears on a Company page, a user can click it and they will be taken to the report. If Single Sign On is set up, the report will be launched with the same user name that they were logged into PLM for Process with.
If Single Sign On is not configured, the user will either be presented with a BI Publisher login screen or if the report is configured for ‘Guest’ access they will be taken to the report.
BI Publisher reports support http links typically in a cell within a table. The link is able to be constructed based on values being returned in the report. For instance if a table displays a list of Material specifications, a link can be constructed for each row of the table to open the specification in PLM for Process. It is helpful to have the host name of the server generated dynamically based on a configuration. This way when moving between environments the reports do not have to change. Also if the server changes all that needs to change is the configuration.
The configuration for all the host names is stored in a single row of a table called ‘ApplicationURLs’, which is part of the Reporting DB Layer. In this table you can set the host name for the following applications:
§ BI Publisher
§ GSM
§ SCRM
§ NPD
§ PQM
Examples of using this table to create links in a report can be found in the Reporting Pack Reference Implementations. The reports are built using the BI Publisher layouts. The URL is specified by clicking on a column in a table and then in the left hand pain opening the ‘Properties’ section. At the bottom there is a URL property that can be populated to construct the URL as shown below.
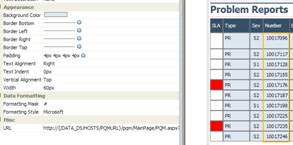
An example of a PQM URL would be the following.
http://{/DATA_DS/HOSTS/PQMURL}/pqm/MainPage/PQM.aspx?ContentKey=Issue&PQMItemID={/DATA_DS/ISS/IID}&InitialLoad=true
The information inside the curly braces is the path to the data elements as defined by the BI Publisher Data Model. It is case sensitive so remember to use upper case. This example shows how to dynamically create the host for the URL as well as the Item ID for the PQM Issue.
Starting from Agile PLM for Process Extensibility Pack 3.1, there are “out of the box” BI Publisher reports available as a reference implementation, known as Report Packs. This section discusses several features of BI Publisher and describes the intent of each released report. For specific information on the report analytics, please refer to Appendix E – BI Publisher Reports and Corresponding Analytics.
All of the reports are deployed using Oracle BI Publisher and once installed these reports can be accessed through BI Publisher or within Agile PLM for Process utilizing Navigation Extensibility points, PQM Extension Library (Object Notifications or Action Menu Icons), as well as, Agile PLM for Process Reporting application.
Please refer the following documentation for more information regarding Navigation Extensibility points, PQM Extension Library Object Notifications, PQM Extension Library Action Menu Icons and the Custom Reporting application:
§
Oracle
Agile Product Lifecycle Management for Process Extensibility Guide
§
Oracle
Agile Product Lifecycle Management for Process PQM Extension Library Solution
Pack
§
Oracle
Agile Product Lifecycle Management for Process Custom Report Configuration
Guide
The following report packs with associated reports have been released:
PQM Report Pack
§ Individual Supplier Quality
§ Alternate Supplier
§ Individual Supplier Quality – Supplier Portal
§ Quality Analyst
§ Quality Manager
§ Audits by Spec
§ Audits by Suppliers
§ Open Issues by SAC
§ Open Issues by Spec
§ Open Issues by Supplier
§ UGM Access Report
§ UGM Access Details
§ Basic Statistics
§ eQ Dashboard
§ eQ Dashboard - SP
§ Material Cost Matrix
§ Spec Lineage History
§ Sourcing Approval Risk
§ Supplier Rationalization
§ Supplier Compliance Report – CF
§ Supplier Compliance Report – SA
§ Supplier Compliance Report – SP
All Report Packs are released as reference implementations. These reports should be copied to another folder before using. It is expected that they will then be customized to meet specific user requirements.
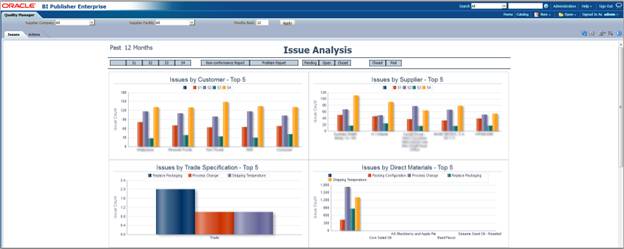
Parameters are essentially global filters for a BI Publisher report. Once a parameter(s) are selected and applied, the report refreshes and only displays data specific to the applied parameters. For example, the Quality Analyst reports uses two parameters: Company and Facility.
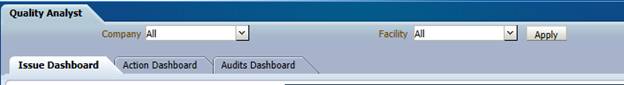
The user can choose a specific company or a facility to execute against the report, or the user has the option to execute the report against “All” companies or facilities. Parameters can be hidden, and under certain circumstances should be hidden to meet specific security requirements.
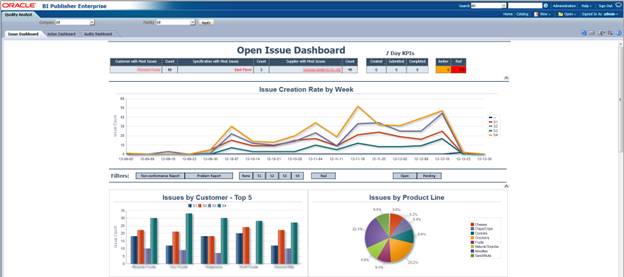
Interactive filters are configurable filters within a specific BI Publisher report. When the interactive filter is selected, specific analytics (as defined within the report) will update. For example, the Quality Analyst report has an interactive filter for severity. When the user clicks S1, the chart will update to reveal only the information associated to “S1” severity.
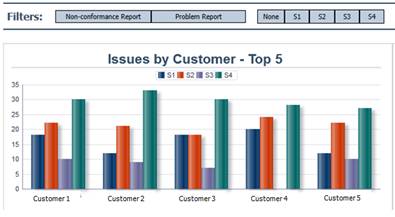
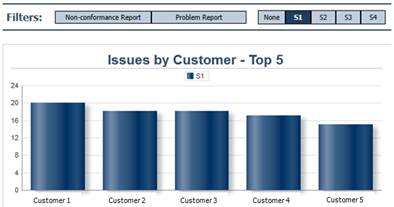
The user can apply and remove multiple interactive filters with a report with ease, enabling the user to dive deep into the analytics without additional reports.
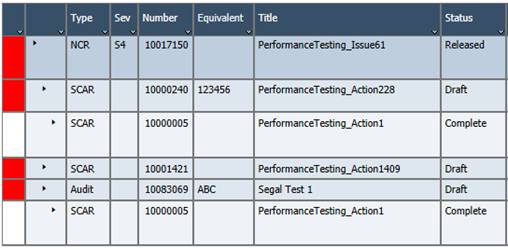
Another powerful feature with Oracle BI Publisher is conditional formatting. Conditional formatting can be used to format against any data field in the data model with wide a range of operators to conditional format fonts, background colors and indentations. This feature is used throughout the PQM reports. In the following example, conditional formatting is used to color the first column to correspond to the SLA state of the PQM object; red, green, amber or no color if object is “closed”. Conditional formatting was also used to indent the arrow in column 2, and color the rows differently depending on the level defined the by PQM object relationships. Conditional formatting greatly enhances the usability of the reports by visually focusing the end user to PQM objects that need attention.
Workflow Tags are used extensively in PQM Reporting to drive many of the analytics. The following workflow tags have been created for the PQM module:
§ Cancelled
§ Complete
§ Pending
§ Released
§ Review
§ Submitted
In many of the reports, a simplified status was used to identify PQM objects that are Cancelled, Closed, Pending or Open. The following table shows the mapping of the Workflow tags to corresponding simplified status.
|
Workflow Tag Name |
Simplified Status |
|
Cancelled |
Cancelled |
|
Complete |
Closed |
|
Pending |
Pending |
|
Released |
Open |
|
Review |
Open |
|
Submitted |
Open |
The BI Publisher data models that pull the information for PQM Reporting use this mapping in many of the reports to determine a particular PQM object’s simple status. For example, many analytics only want to return “Open” PQM objects, if the workflow status is “tagged” with Released, Review, or submitted, the PQM Report analytic only displays open PQM objects. The use of these workflow tags allows end users to create custom workflows and still allows the out-of-the box reports to work.
The following are descriptions of all the reports and brief explanations of the intended purpose of each report. For specific information on the report analytics, please refer to Appendix E – BI Publisher Reports and Corresponding Analytics.
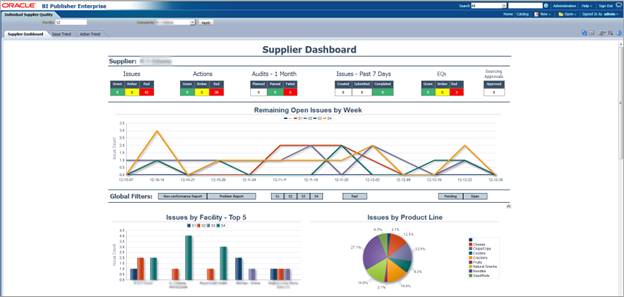
The Individual Supplier Quality report focuses on PQM Issues, Actions and Audits for a specific Supplier (Company). This report is intended to be used by personnel responsible for ensuring Suppliers are addressing quality related issues in timely manner and/or for helping better understand risks associated with a Supplier. The report contains two parameters: Months and Companies. The report contains three tabs (or views): Supplier Dashboard, Issues Trend, and Action Trend.
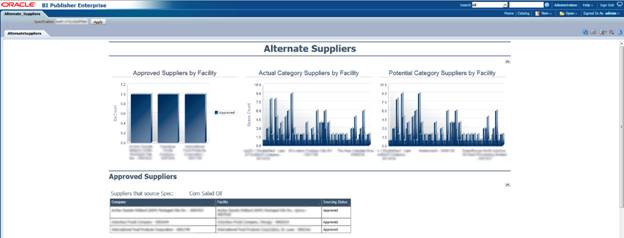
Note: The Alternate Supplier report can be launched from the Individual Supplier Quality report from a defined column within tables on both the Issues Trend and Actions Trend tab.
The Alternate Suppliers report focuses on aiding users to locate an alternate supplier for a GSM specification. The Alternate Supplier report was designed to be launched from within the Individual Supplier Quality report from a defined column within tables on both the Issues Trend and Actions Trend tab. The report has one parameter that is used to pass the specification PKID from the Individual Supplier report to pull the appropriate report information. This report contains one tab (or view) called Alternate Suppliers.
Note: The Individual Supplier Quality report can be launched from defined columns within tables on Alternate Suppliers. This feature allows user to perform a side-by-side comparison of two different suppliers via the Individual Supplier Quality report.
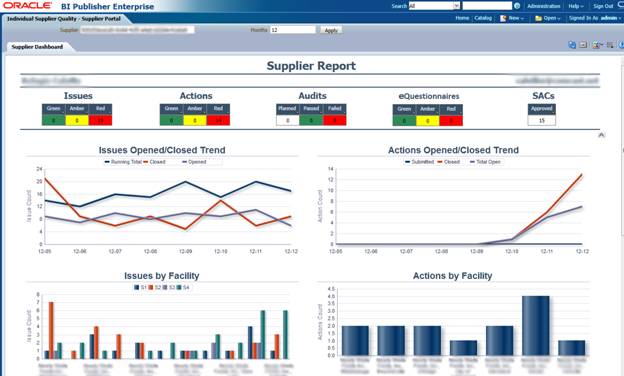
The Individual Supplier Quality – Supplier Portal report focuses on PQM Issues, Actions and Audits for a specific Supplier (SCRM Company) that is accessible to the supplier through Supplier PQM. This report is intended to be used by the supplier to self evaluate their quality performance. The report only returns issues that are related to SCRM Company to which the user is associated. The report has two parameters, Supplier and Months. The report also contains one tab (or view) called Supplier Report.
The Quality Analyst report focuses on open PQM Issues, Actions and Audits and is intended to be used by personnel responsible for ensuring these PQM objects are being addressed by the appropriate personnel in a timely manner. The report has two parameters, Company and Facility. The report also contains three tabs (or views): Issues Dashboard, Action Dashboard, and Audit Dashboard.
The Quality Manager report focuses on all PQM Issues, Actions and Audits and is intended to be used by personnel responsible for reviewing and analyzing PQM data to identify possible areas in the quality landscape that need improvement or attention. The report has three parameters, Company, Facility and Months Back. The report also contains two tabs (or views): Issues and Actions.
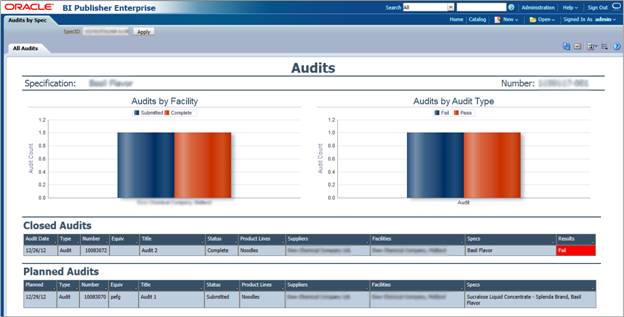
The Audits by Spec report focuses on all PQM Audits related to a specific GSM specification. This report is intended to be launched from a GSM specification from a navigation extension action menu icon to grant the user easy access to the quality audit results for the GSM specification. The report has one parameter (SpecID) that is used to pass the specification PKID from the Action Menu Icon to pull the appropriate report information. The report contains one tab (or view), All Audits.
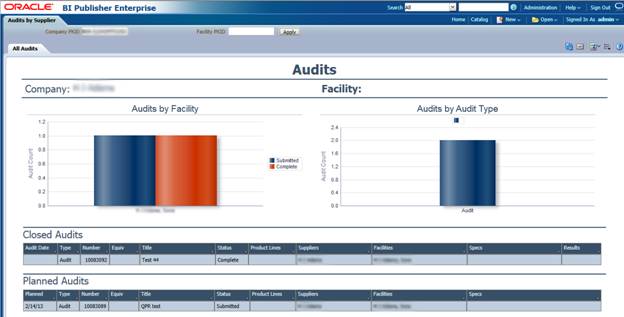
The Audits by Supplier report focuses on all Audits related to a specific SCRM Company or Facility. This report is intended to be launched from a SCRM Company or Facility from a navigation extension action menu icon to grant the user easy access to the quality audit results for the SCRM Company or Facility. The report has two parameters (Company PKID and Facility PKID) that are used to pass the PKID from the Action Menu Icon on the SCRM Company or Facility to pull the appropriate report information. The report contains one tab (or view), All Audits.
 .
.
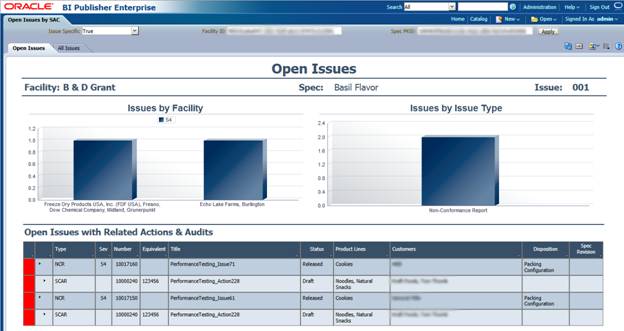
The Open Issues by SAC report focuses on open PQM issues related to a specific SCRM sourcing approval. This report is intended to be launched from a SCRM sourcing approval from a navigation extension action menu icon to grant the user easy access to the open quality issues for the GSM specification associated to the sourcing approval. The report has three parameters: Issue Specific, Facility ID and Spec PKID. The Issue Specific parameter can be use to make the report specification “issue” specific or not. The Facility ID and Spec PKID parameters are used to pass the PKIDs from the Action Menu Icon on the sourcing approval to pull the appropriate report information. The report contains two tabs (or views); Open Issues and All Issues.
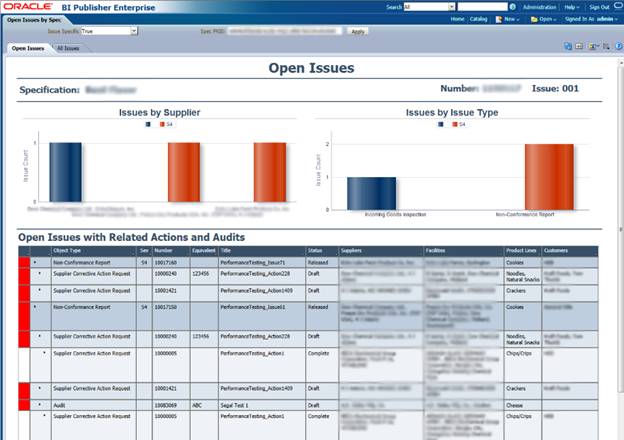
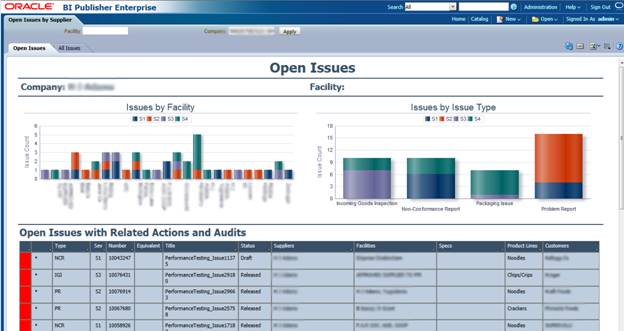
The Open Issues by Spec report focuses on all PQM issues related to a specific GSM specification. This report is intended to be launched from a navigation extension action menu icon on a GSM specification to grant the user easy access to the quality issues for that GSM specification. The report has two parameters: Issue Specific and Spec PKID. The Issue Specific parameter can be use to make the report specification “issue” specific or not, while the and Spec PKID parameter is used to pass the PKID from the Action Menu Icon on the GSM specification to pull the appropriate report information. The report contains two tabs (or views): Open Issues and All Issues.
The Open Issues by Supplier report focuses on all PQM issues related to a specific SCRM Company or Facility. This report is intended to be launched from a SCRM company or facility from a navigation extension action menu icon to grant the user easy access to the quality issues for that SCRM Company or Facility. The report has two parameters (Facility and Company) that are used to pass the PKID from the Action Menu Icon on the SCRM Company or Facility to pull the appropriate report information. The report contains two tabs (or views): Open Issues and All Issues.
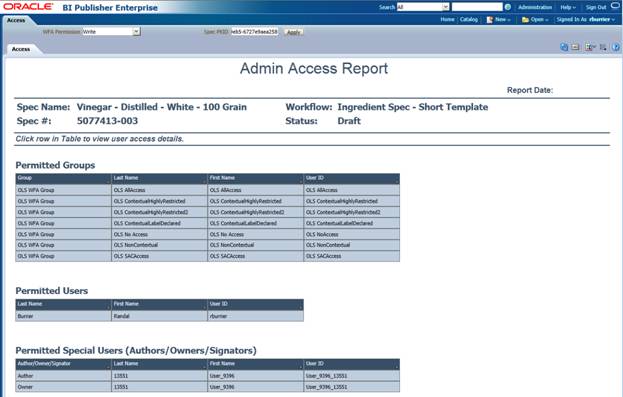
The Access
Report is intended to be granted to specific system admin users responsible for
UGM and/or WFA security. This report is
designed to be launched from a GSM specification from a navigation extension or
action menu icon that is only exposed to the system admin. This report pulls all UGM Groups, permitted
users, and special permitted users (i.e. Authors, Owners or Signators) that
have access to the GSM specification on a specific workflow at a specific
status. The report has two parameters:
WFA Permission and Spec Name. The spec PKID is passed to the report via
navigation extension and is exposed as the Spec Name in the parameter. WFA
Permission has three values: Read, Write, and Workflow. The report contains
only one tab (or view) called Access.
This report is intended to work with the UGM Access Detail report, as
the Access Detail report can be launched from within this report to expose more
security detail for a specific user.
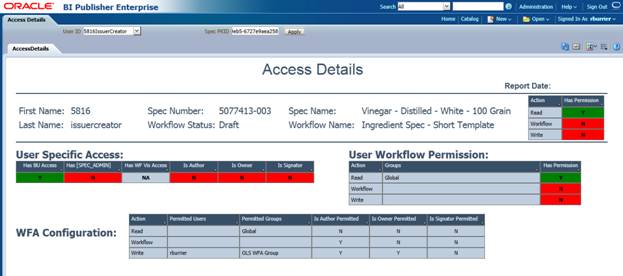
UGM Access Details (ADMN)
The Access Detail report is intended to be launched from a
hyperlink within the Access report, providing the access detail for the
specified specification and user from which the report was launched. This report pulls user specific security
access such as BU Access, [SPEC_ADMIN] role assignment, Workflow Visibility
access, Workflow permission, special access (Author, Owner and Signator) and
summarizes the Read, Workflow, and Write permissions. At a glance, the System Admin can determine
if a user has Read, Write, or Workflow permission and view details that allows
or denies the user access to the specification. The report contains only one tab (or view)
called Access Details.
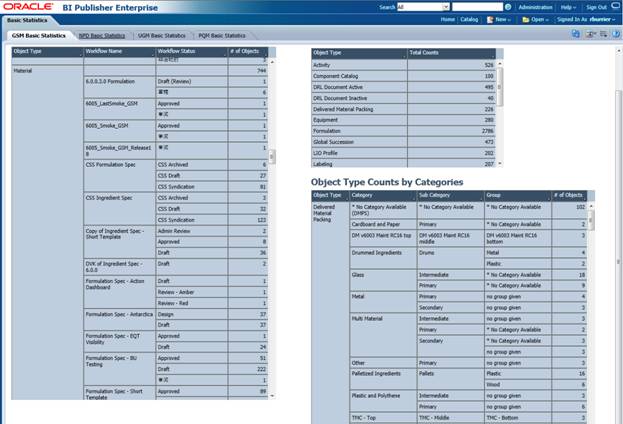
Basic Statistics (ADMN)
The Basic Statistics report is intended to be launched from a navigation extension. The report could be used by System Executives that would like to have a high level understanding of the utilization of the PLM4P application, which will lead to a better understanding of the impact that the PLM4P application (and investment) has on their business. This report pulls all basic counts of active users, approved suppliers, GSM specifications (by workflow, spec type and Category), NPD objects (Projects, Strategic Briefs and Innovation Sales Pipelines) and PQM objects (Issues, Actions and Audits). The report contains four tabs (or views): GSM Basic Statistics, NPD Basic Statistics, UGM Basic Statistics, and PQM Basic Statistics.
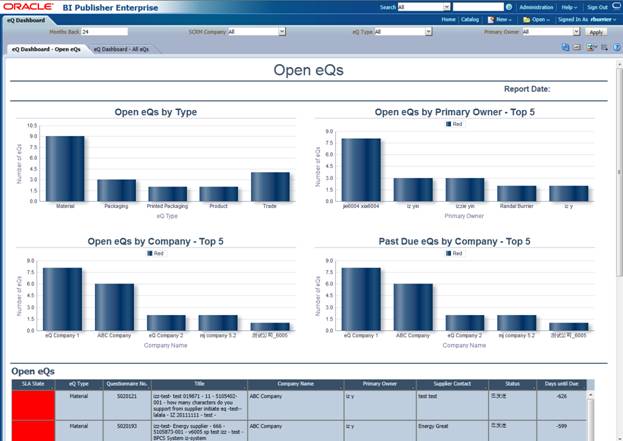
eQ Dashboard (eQ)
The eQ Dashboard is intended to be launched from a
navigation extension and could be utilized by any eQ user or administrator. This
report enables a view into open and completed eQs across eQ owners, suppliers
and eQ types. The eQ Dashboard also
exposes trending information on supplier response times and total open eQ
counts by supplier. This report helps better manage the eQ business process by
exposing vital eQ information across eQ users and Suppliers. This report has
four parameters: Month Back, SCRM Company, eQ Type and Primary Owner. The report
contains 2 tabs (or views): Open eQs and All eQs.
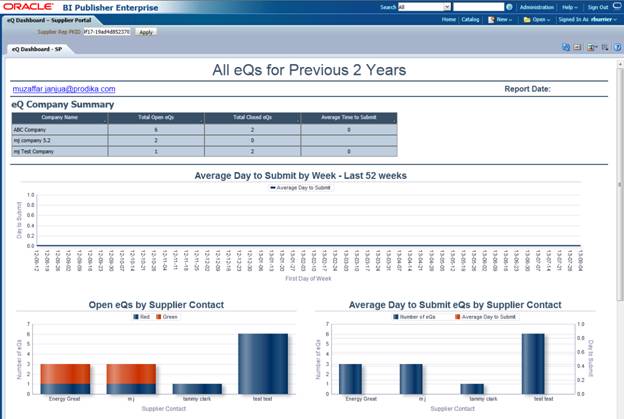
eQ Dashboard – SP (ADMN)
The eQ Dashboard Supplier Portal (SP) report is intended
to be launched from a navigation extension in Supplier Portal and utilized by a
supplier eQ user. This report enables a supplier to view open and completed eQs
across supplier contacts and also exposes trending information on supplier
response times and total open eQ counts. This report helps the supplier better
manage the eQ business process by exposing vital eQ information. This report
has one parameter called Supplier PKID, which should be hidden prior to
releasing this report. As with all Supplier Portal reports, this report should
be released in pdf format.
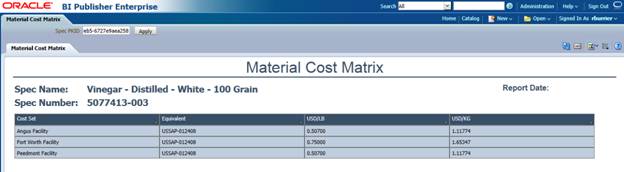
Material Cost Matrix (GSM)
This report was designed to be launched from navigation
extension from a material or packaging specification. The report returns cost
book information associated to the GSM object.
If the cost book is populated, this report can be utilized by
formulators to quickly view the cost information for a specific GSM objects
across all Cost Sets (or Facilities). This report contains one parameter, Spec
PKID. The spec PKID is passed to the
report via navigation extension. This report contains one tab (or
view) called Material Cost Matrix.
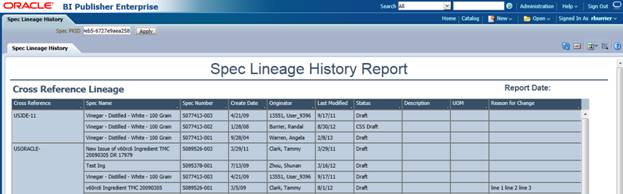
Spec Lineage History (GSM)
The Spec Lineage History report was designed to be launched from a navigation extension or an action menu icon from a specification. This report can be utilized by spec administrators that would like to be able to view a specification’s complete lineage history with cross reference information to help understand a specification’s history and corresponding cross reference information. The report uses the Spec PKID as a parameter to be passed from the specification in context to the report, which pulls the specification’s Lineage History information grouped by the cross reference’s equivalent number. This report contains one tab (or view) called Spec Lineage History.
Sourcing Approval Risk (SCRM)
The
Sourcing Approval Risk report was intended to be launched from a navigation
extension from within PLM4P and utilized by purchasing personnel to identity packaging
material specifications, printed packaging specifications, and material specifications
that have only “approved” sourcing approvals from one supplier (Company), or no
sourcing approvals at all. The report has four parameters: Spec Type, Category,
Subcategory, and Group. This report contains one tab (or view) called Sourcing
Approval Risk.

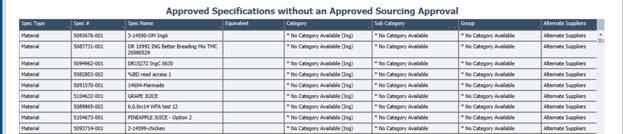
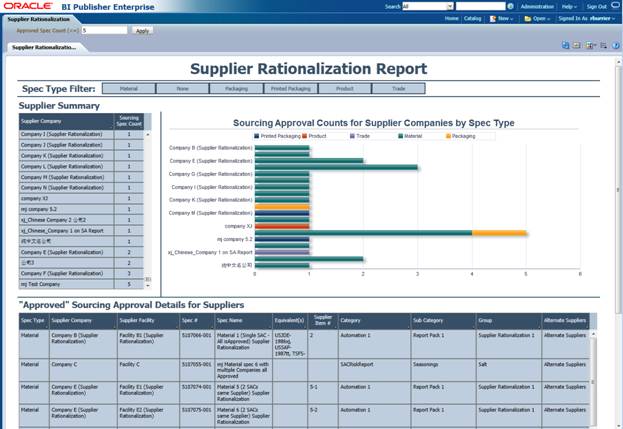
Supplier Rationalization (SCRM)
The Supplier Rationalization report was intended to be launched from a navigation extension from within PLM4P and utilized by purchasing personnel to identity suppliers that have limited approved sourcing approvals for GSM specifications. The report has one parameter called “Approved Spec Count (<=)”, and when the user enters a number into parameter, the report pulls all suppliers that have a total number of approved specifications with an approved sourcing approval “equal to” or “less than” the parameter value entered. This report contains one tab (or view) called Supplier Rationalization.
Supplier Compliance Report – CF (SCRM)
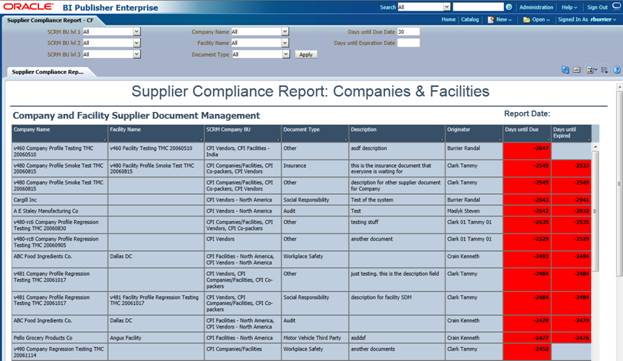
The” Supplier Compliance Report: Companies and Facilities” was designed to be launched from a navigation extension from within PLM4P and to be utilized by users that manage supplier documents that are attached to companies or facilities. When this report is executed, it pulls all “Non-Archived” SDM Documents for Companies and Facilities and exposes details about supplier documents including Days until Due and Days until Expired. The report has eight parameters: SCRM BU lvl 1, SCRM BU lvl 2, SCRM BU lvl 3, Company Name, Facility Name, Document Type, Days until Due Date and Days until Expiration Date. This report contains one tab (or view) called Supplier Compliance Report – Companies and Facilities.
Note: The SCRM BU parameters were by designed limited to three levels. If there are more levels defined in a specific implementation, the report still pulls documents from lower levels, but you will not be able to limit the report by the lower BU levels without modifying the report.
Supplier Compliance Report – SA (SCRM)
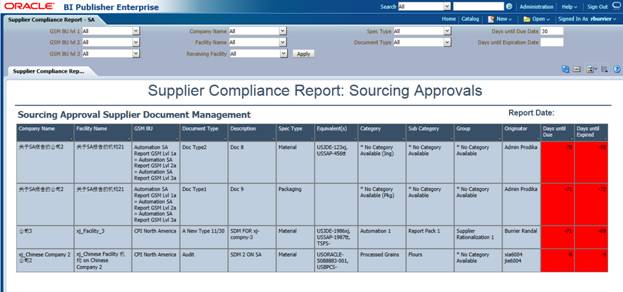
The” Supplier Compliance Report: Sourcing Approval” was designed to be launched from a navigation extension from within PLM4P and to be utilized by users that manage supplier documents that are attached to sourcing approvals. When this report is executed, it pulls all “Non-Archived” SDM Documents for Sourcing Approvals and exposes details about supplier documents including Days until Due and Days until Expired. The report has ten parameters: SCRM BU lvl 1, SCRM BU lvl 2, SCRM BU lvl 3, Company Name, Facility Name, Receiving Facility, Spec Type, Document Type, Days until Due Date and Days until Expiration Date. This report contains one tab (or view) called Supplier Compliance Report – Sourcing Approvals.
Note: The SCRM BU parameters were by designed limited to three levels. If there are more levels defined in a specific implementation, the report will still pull documents from lower levels, but you will not be able to limit the report by the lower BU levels without modifying the report.
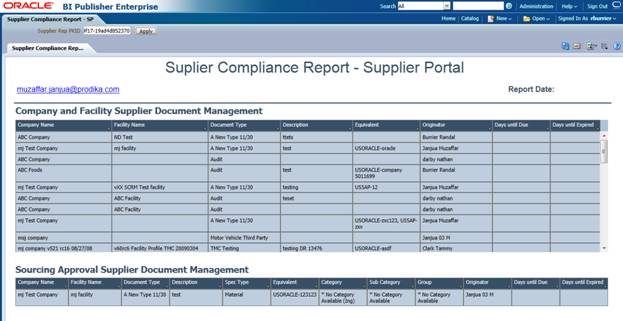
Supplier Compliance Report – SP (SCRM)
The Supplier Compliance Report – SP report was designed to be launched from a navigation extension from within Supplier Portal and to be utilized by suppliers that manage supplier documents that are attached to Companies, Facilities or Sourcing Approvals. When this report is executed, it pulls all “Non-Archived” SDM Documents for Companies, Facilities, and Sourcing Approvals and exposes details about supplier documents including Days until Due and Days until Expired. This report contains one tab (or view) called Supplier Compliance Report – SP. As with all supplier portal reports, this report should be released in pdf format.
Clients can create custom report parameter types by leveraging existing data searches found throughout the application (via EQT Models) or by calling data retriever classes (DataSources) to retrieve the necessary search data.
When specifying the report parameter type in the reporting configuration, a user interface control must also be declared. The web control that will display the parameter type will depend on which of the data retrieval approaches is used.
The Reporting module provides three web controls for DataSource parameters:
§ ReportingControls/LookupInputSingleSelect.ascx – A drop-down input allowing a single selection from data specified by a DataSource
§ ReportingControls/LookupInputMultiSelect.ascx – A pop up control allowing multiple selections from data specified by a DataSource
§ ReportingControls/TreeViewInput.ascx – A pop up control for nested hierarchies, allowing a single or multiple selections from data specified by a DataSource
The EQT Model parameters all use the following web control:
§ ReportingControls/EQTInput.ascx – A pop up control with differing behavior based on which existing EQT View is used
The Entity Query Toolkit (EQT) is an internal framework used in Oracle Agile PLM for Process for mapping existing internal data models to search parameters and search results. This mapping is declared in configuration files that are available for reference. EQT Models define how a search occurs, including which search parameters are available, which search parameters are mandatory (and therefore hidden and always used), what data is returned, and how returned data is displayed.
Most searches throughout the application use the EQT framework. The Reporting framework can therefore leverage some existing EQT searches to create search parameters for the desired reports. However, some EQT searches used in the application may not function as needed when leveraged in EQT. For instance, one SCRM facility search allows the selection of a facility based on some search parameters. When selecting the facility, however, the facility name may not populate the web control in the reporting screen properly, even though the facility’s unique ID (PKID) does get stored properly.
Caveat: The details of EQT are complex, difficult to interpret, and are comprised of many components. Additionally, EQT is an internal development tool only; although it may be leveraged in the Reporting module, it is not supported as a client facing tool. Therefore, a detailed review of EQT is beyond the scope of this document.
Oracle Consulting Services may be able to provide some assistance in leveraging EQT to meet reporting needs.
The main EQT configuration file, EqtUIModelDefinitions.xml, contains many of the EQT views accessible throughout the application. Some of the views may reference the views in the EqtUICommonModels.xml file. A reference version of each of these files is available by request.
To leverage an existing EQT search, the name of the searchable EQT view must first be identified. For searches that occur in a pop-up window, the view name may be found by looking at the search pop-up window’s properties listing (right click, select Properties) and examining the URL. The URL may include a parameter that references the name of the EQT view.
For instance, the URL of one popup includes the following parameter:
&DataSource=SearchableView:Config:ProdikaSettings/SearchableMultiSelectViews, PackagingSpecViewForProcessAndTradeSpecs
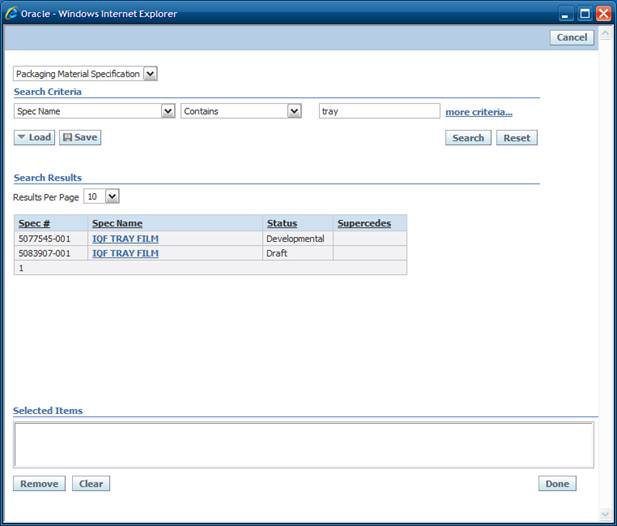
The EQT search view name used in this popup is PackagingSpecViewForProcessAndTradeSpecs.
Examining the EqtUIModelDefinitions.xml file and locating this view reveals some information that will be useful:
<PackagingSpecViewForProcessAndTradeSpecs
. . . >
<AllowedModels>
<Model active="true"
name="Packaging Specification" alias="lblType1009"
orderByColumns="-" captionColumn="1" primaryKeyColumnName="SpecID">
The attribute primaryKeyColumnName specifies which field is returned upon selection. In this instance, the SpecID property will be returned. This may be only partially informative, as the details of the model and its properties are hidden, but it generally can give an idea of what field value is returned.
The display columns that contain an attribute provideInSelectJS are returned and accessible to the report parameter, so that they can fill the input box upon selection.
<DisplayColumns>
. . .
<ColumnInfo width="200"
dataField="SpecName" dataFieldCaption="lblSpecName" provideInSelectJS="true"/>
The columns where provideInSelectJS are set to true are then used by the <Model> node’s displayVariableIndex attribute, representing the location/index of the desired property to display in the selected items input field. In this example, the SpecName field is returned as the only display item, and therefore its displayVariableIndex attribute would be set to 1.
![]()
<ParameterType
type="ExampleEQTInput_PackagingSpecView"
webControl="ReportingControls/EQTInput.ascx">
<Model displayVariableIndex="1">SearchableView:Config:ProdikaSettings/EQTConfiguration/SearchableMultiSelectViews,PackagingSpecViewForProcessAndTradeSpecs</Model></ParameterType>
While some EQT views can be identified by the URL of the pop-up, others views are harder to identify. Examining the EqtUIModelDefinitions.xml file and searching for the desired information may yield results.
Oracle Consulting Services may be able to provide more assistance in identifying a desired EQT model.
Currently, only the models in the following EqtUIModelDefinitions.xml sections are supported in the Reporting module:
§ Views in the models/ProdikaReporting node (via SearchableMultiSelectViews)
§ Views in the models/pqs node (via PQSSearchableMultiSelectViews)
For example, to create a report parameter to access the SpecSummaryView EQT view from ProdikaReporting, use the following entry:
<ParameterType
type="ExampleEQTInput_SpecSummary" webControl="ReportingControls/EQTInput.ascx">
<Model displayVariableIndex="1">SearchableView:Config:ProdikaSettings/EQTConfiguration/SearchableMultiSelectViews,SpecSummaryView</Model>
</ParameterType>
When configuring the Model node, the syntax above always begins with SearchableView:Config:ProdikaSettings/EQTConfiguration/ and is followed by either SearchableMultiSelectViews (for the models in the ProdikaReporting node) or PQSSearchableMultiSelectViews (for the models in the PQS node), then a comma, followed by the name of the Model.
An additional and possibly more straightforward approach to creating custom search parameters is by using DataSources.
DataSources are classes that implement a specific interface (discussed later) whose responsibility is to retrieve search result data for selection in a pop-up web control. Clients can leverage several existing DataSources, or implement their own classes and plug them in easily. DataSources are referenced by their full class name and package name. They may also include parameters in their declarations that are then used by the class to modify its behavior. Please see Appendix C – Object Loader URLs and some of the examples below for more details.
Here is a report parameter that uses an existing datasource (LookupServiceListViewDataSource):
<ParameterType
type="ExampleGenericLookup_Allergens"
webControl="ReportingControls/LookupInputMultiSelect.ascx">
<DataSource
className="Class:Xeno.Web.UI.Controls.DataSources.LookupServiceListViewDataSource,XenoWebControls$AllergensTitle|Allergens"/>
</ParameterType>
Several existing DataSources may be leveraged to retrieve data which only require parameters to customize their results. A few are outlined here.
There are many data lists throughout the application, such as Languages, NPDBrands, Allergens, etc. Most lists are managed through a service that uses the database table commonLookupServiceManagers to maintain each list and how the list is configured. The ManagerID column value of this table for the desired lookup data must be passed in as the second parameter and is used by the LookupServiceListViewDataSource class to retrieve that list.
See the Oracle Agile PLM Data Training for more details on how CommonLookups work.
In the example above, the DataSource used is as follows, and takes two parameters (“AllergensTitle|Allergens”), the first for the pop-up title, and the second for the lookupManagerID.
<DataSource
className="Class:Xeno.Web.UI.Controls.DataSources.LookupServiceListViewDataSource,XenoWebControls$AllergensTitle|Allergens"/>
Some lookup items are status aware, so
this Datasource allows for a third parameter to be passed in to indicate if
only Active items should be displayed ('ForSearching'), or all historically
valid items should be displayed ('StatusAwareConsumer').
This DataSource is used for specifying
a table and column to search on, and the return value for the selected item(s).
Rather than pass in the table name, however, this DataSource expects a class name
which it then uses to retrieve the table name (The tablename to classname
mapping can be found in the database table orclassmetainfo). To specify the column to retrieve, this DataSource
expects the class parameter name that will then be used to retrieve the column
name (The property to column name mapping can be found in the orpropertymetainfo table). To specify the return value column name, this
DataSource expects the class parameter name that will then be used to retrieve
the column name.
Example SQL to find the classname and
property name:
SELECT tablename FROM orclassmetainfo where classname='complieswith'
SELECT columnName, propertyName FROM orpropertymetainfo
where fkORClassMetaInfo = (select pkid from orclassmetainfo where
classname='complieswith')
An example of using the
GenericListSelectView DataSource for CompliesWith items, displays the Name of
the compliesWith item, and returns the PKID for the selected item(s).
<ParameterType
type="ExampleGenericTableLookup_CompliesWith"
webControl="ReportingControls/LookupInputMultiSelect.ascx">
<DataSource
className="Class:Xeno.Web.UI.DataSources.GenericListSelectView,XenoWebControls$|CompliesWith|Name|PKID"/>
</ParameterType>
This DataSource is used to load
multi-level taxonomies that are managed in the commonTaxonomyNamespace table.
It requires a namespaceid parameter and must use the TreeViewInput control.
There is also the option of making the selectable data a single- or
multi-select.
An example of using this DataSource to
display SCRM business units in a multi-select pop-up:
<ParameterType
type="ExampleGenericTaxonomy_SCRMBusinessUnit"
webControl="ReportingControls/TreeViewInput.ascx">
<DataSource
className="Class:Xeno.Web.UI.DataSources.TaxonomyXNodeTreeViewDataSource,XenoWebControls$SCRMBusinessUnit"
/>
<MultiSelect>true</MultiSelect>
</ParameterType>
Clients may also create a custom DataSource class to implement their own data retrieval operations. The class must implement the Xeno.Web.UI.Controls.IListView interface, and must include implementations of the following interfaces from the Xeno.Web.UI.Controls namespace:
The IListView interface returns an IListDataSource, which must enumerate through the results and return an IListItem for each entry.
public interface IListView
{
IListDataSource ListItemsByPrefix( String prefix );
IListDataSource ListAllItems();
String Title{ get; }
bool AllowAddNew{ get; }
void AddNewListItem( IListItem item );
}
public interface IListDataSource
{
IListItem Current{ get; }
bool Next();
}
public interface IListItem
{
String Value{ get; }
String DisplayValue{ get; }
}
The custom DataSource class must be compiled and placed into the Web\ProdikaReporting\bin directory.
The Reporting framework allows customers to configure security rules that govern if a Report or Report Group should be visible to the current user. The SecurityFactoryRef attribute of the Report and ReportGroup nodes can be declared with different security plug-ins using Object Loader syntax. Each security plug-in takes parameters in its declaration that determine the access restrictions for that Report or Report Group.
Because Report nodes are children of the ReportGroup node, security is enforced hierarchically. When considering access to a Report, the user must have access to the parent Report Group.
The following report security plug-ins are available:
This plug-in secures a Report, Report Group, or Report Context based on the roles to which a user belongs. The specified roles are evaluated using an OR relationship, meaning that if the user belongs to any of the roles listed, they allowed access. Negation is allowed through the use of the "!" (exclamation mark) operator as a prefix to a role name.
SecurityFactoryRef="Class:Xeno.Prodika.SecurityModel.Contextual.UserRoleBasedSecurityPluginFactory,ProdikaLib$[SCRM_COMPANY_READER]|[SCRM_FACILITY_READER] "
Note that the brackets surrounding the role name are required.
This plug-in secures a Report, Report Group, or Report Context based on the user’s application access. The specified applications listed are evaluated in an OR relationship. It is important to note that this type of security considers a user’s "HasAdminAccess" property, and if so, allows access regardless of the supplied permissions.
SecurityFactoryRef="Class:Xeno.Prodika.SecurityModel.Contextual.UserPropertyBasedSecurityPluginFactory,ProdikaLib$SCRM"
Note that this plug-in
is available in the Extensibility Pack, under the Handlers package. Be sure to
add the Handlers.dll file to the web\ProdikaReporting\bin directory.
This plug-in secures a Report, Report Group, or Report Context based on the user’s group access. The specified groups listed are evaluated in an OR relationship. There are several ways to specify the group: using the group name or the group PKID. Negation is allowed through the use of the "!" (exclamation mark) operator as a prefix to a group name or PKID. Additional options are detailed in the Extensibility Pack documentation.
SecurityFactoryRef="Class:Xeno.Prodika.SecurityModel.Contextual.UserGroupBasedSecurityPluginFactory,Handlers$Group123|Group456"
Object
Loader URLs are classpaths that are used to dynamically load objects. They are
used to declare the protocol to use when loading the class, the class path, and
optionally any parameters to pass to the class.
[Protocol] : [Path] $ [ [param1] | param2 ]
When loading an object, the loader first inspects the Protocol and using lazy loading, determines an appropriate protocol handler based on this protocol’s name. The "Class" protocol may refer to a class that accepts parameters during instantiation which are defined after a "$" and delimited by "|"s (pipes).
The most common usage of this class is in configuration files. Often a factory class is supplied in a configuration and the Object Loader bootstraps the factory, which in turn facilitates the use of the rest of the implementation. These implementations are easily swapped by simply providing a different factory in the configuration.
Class:Xeno.Prodika.Portal.WebUI.Util.Security.UserPropertyBasedSecurityPluginFactory,ProdikaLib$NPD
"Class" is the protocol, "NPD" is a parameter, and the rest of the string between the ":" and the "$" is the path as defined by the protocol. In this case, it is the class path of the object that is to be instantiated.
The Oracle Agile Product Lifecycle Management for Process application allows customers to integrate with reports that exist in an external reporting engine. Specifically, customers can configure the application suite to gather information from within the application and provide well-formatted reports that are generated in an external system.
Currently, the PLM for Process application supports only two reporting engines:
§ Oracle BI Publisher
§ SQL Server Reporting Service
This document outlines the steps necessary to integrate the PLM for Process application with any other third party external application that can provide similar functionality.
In order to achieve this integration, two classes must be created that conform to PLM for Process interfaces.
1. IServiceFactory
2. IReportGenerationService
The PLM for Process application expects all implementations of its report integration adapters to implement the IReportGenerationService interface:
namespace Xeno.Prodika.Services
{
public
interface IServiceFactory
{
IService
Create(IExecutionContext execContext, IBlockingResourcePool servicePool);
}
}
As the sample code illustrates, this class has two purposes:
i. Retrieve configuration information from the ReportingServiceConfig
ii. Initialize and return a Service that will be used to manage integration with a reporting engine (which in this case is called ParameterReportGenerationService)
public class ParameterReportGenerationServiceFactory :
IServiceFactory
{
private
ReportingServiceConfig _config;
public IService
Create(IExecutionContext execContext, IBlockingResourcePool servicePool)
{
ExtractConfiguration();
return new
ParameterReportGenerationService(_config);
}
private void
ExtractConfiguration()
{
if (_config
!= null)
return;
IXMLConfigurationManager cm = (IXMLConfigurationManager) AppPlatformHelper.ApplicationManager.EnvironmentManager.GetConfigManager("ReportingServiceConfig");
_config =
(ReportingServiceConfig) cm.GetConfig("ReportingServiceConfig");
if (_config
== null)
throw new
ProdikaConfigurationException("Could not read
ReportingServiceConfig");
}
}
The PLM for Process application expects all implementations of its report integration adapters to implement the IReportGenerationService interface:
namespace Xeno.Reporting.Service.ReportGenerationService
{
public
interface IReportGenerationService : IService
{
ReportingServiceConfig Config { get; }
ReportResults
GenerateReport(ReportConfig config, ITranslationCache translationCache, string
format, IDictionary parameters);
}
}
This interface provides two capabilities:
i. The ability to access configuration information
ii. A method that can be converts a request for a report into the result of a report invocation.
internal class ParameterReportGenerationService :
IReportGenerationService
{
private
readonly ReportingServiceConfig _config;
public
ParameterReportGenerationService(ReportingServiceConfig config)
{
_config =
config;
}
public
ReportResults GenerateReport(ReportConfig config, ITranslationCache translationCache,
string format, IDictionary parameters)
{
ReportResults
result = new ReportResults();
result.ReportContent = BuildParameterReport(parameters);
result.MimeType = format;
return
result;
}
private static
byte[] BuildParameterReport(IDictionary parameters)
{
StringBuilder
builder = new StringBuilder();
foreach
(DictionaryEntry parameter in parameters)
{
builder.AppendFormat("Parameter '{0}' has value:
'{1}'<br/>", parameter.Key, parameter.Value);
}
return new
ASCIIEncoding().GetBytes(builder.ToString());
}
public
ReportingServiceConfig Config
{
get { return
_config; }
}
public
IServiceContext ServiceContext
{
get { return
new ServiceContextAdapter(); }
set { ; }
}
}
In our example, the configuration information was passed into this class upon creation. All that needs to be done is to provide it back in order to fulfill the contract of the IReportGenerationService.
The generation is also reasonably straightforward. The following information is provided to the method that implements this behavior:
i. The ReportConfig, which contains information on which report is being requested as well as its service location
ii. The translation cache that has been configured for this particular report
iii. The format of the result
iv. All parameters that have been picked by a user and are being passed into the report
As can be seen, the sample code in question does not make a call to a reporting engine. Instead, it displays all parameters that have been provided to it in HTML.
A more realistic implementation would access the Name and ServiceLocation values off the ReportConfig object and then use that to drive which report needed to be invoked.
It should be noted that the approach taken by PLM for Process does not assume a specific protocol (SOAP/DB/etc). That is a decision best left up to the implementer.
In order for the PLM for Process application to use custom code for report integration, we must register it at the appropriate location. In this particular case, the correct location is the Config/Custom/CustomerSettings.config file.
For our sample implementation, the entry for SQLReportingService in the configuration file would be modified to this if the following assumptions about the class that implements IServiceFactory were true:
i. It is named ParameterReportGenerationServiceFactory and is in namespace ParameterReportingServiceAdapter
ii. It is contained in the ParameterReportingServiceAdapter.dll
iii. The DLL file is available to all web applications (i.e., it is present in each Web/*/bin directory)
<SQLReportingService refscope="Session"
factory="Class:ParameterReportingServiceAdapter.ParameterReportGenerationServiceFactory,ParameterReportingServiceAdapter"
configChildKey="name"
configAttributeOverrideModifier="Replace" > </SQLReportingService>
PLM for Process must be configured with the user name and password in order integrate properly. To set this value, please refer to the “Setup Assistant” section of the Agile Product Lifecycle Management for Process Configuration Guide.
This report has three tabs (or views): Supplier Dashboard, Issues Trend, and Action Trend.
The Supplier Dashboard tab contains the following analytics:
|
Analytic Name |
Description |
|
Total
Open Issues |
Table that contains total count of open PQM Issues in their corresponding workflow SLA State (green, amber, or red). |
|
Total
Open Actions |
Table that contains total count of open PQM Actions in their corresponding workflow SLA State (green, amber, or red). |
|
Total
Open Audits |
Table that contains total count of Audits that are Planned, Passed or Failed within the past month. |
|
Total Issues Create in Last 7 Days |
Table that contains the count of Created, Submitted, and Completed Issues in the last 7 days. |
|
Total Open eQuestionnaires (eQs) |
Table that contains total count of open eQs and their corresponding workflow SLA State (green, amber, or red). |
|
Total “Approved” Sourcing Approvals |
Table that contains total count of the specific companies “approved” sourcing approvals. |
|
Remaining Open Issues by Week |
Vertical line chart representing all remaining open issues by week based on issue severity. |
|
Issue by Facility – Top 5 |
Vertical bar chart displaying the top five facilities with the most Issues based on issue severity. |
|
Issues by Product Line |
Pie chart representing the percentage of issues based on product line. |
|
Open Issues by Affected Spec Quantity |
Vertical bar chart representing the total quantities of specific specifications that were affected by issues. |
|
Open Issues by Affected Spec Category – Top 5 |
Vertical stacked bar chart displaying the top five total issue counts by affected spec category based on issue severity. |
|
Open Issues with Related Actions and Audits |
Interactive table displaying specific information about open issues and all related actions and audits to those issues. Only actions and audit that are specifically related to open issues will display in this table. Note: Each row of the table is hyperlinked to the associated PQM object. |
|
Open Actions |
Interactive table displaying specific information about all open actions. All actions display in this table regardless if they are related to an issue or not. Note: Each row of the table is hyperlinked to the associated action. |
|
Planned and Recent Audits |
Interactive table displaying specific information about planned and recent audits. Note: Each row of the table is hyperlinked to the associated audit. |
The Issues Trend tab contains the following analytics:
|
Analytic Name |
Description |
|
Opened/Closed
Trend |
Vertical line chart representing the total counts of Opened, Closed, and Running Total issues by week. (Running Total represents the sum of all currently open issues.) |
|
Opened
By Severity |
Vertical stacked bar chart representing total issue counts created by week based on severity. |
|
Quantity
of Affected Specs by Week |
Vertical bar chart representing the total quantity of affected specifications that were impacted by Issues over time based on severity. |
|
Issues by Affected Spec Failure Type |
Vertical bar chart displaying issues counts by affected spec failure type. |
|
Issues Create in Last X Month(s) |
Interactive table displaying specific information about all issues over time as defined by the “Months” global parameter. Note: Each row of the table is hyperlinked to the associated issue, and if the issues have an “Affected Item” related to it, the “Alternate Suppliers” column will populate a link to another BI Publisher Report called Alternate Suppliers. |
The Actions Trend tab contains the following analytics:
|
Analytic Name |
Description |
|
Days
to Close Actions |
Vertical line chart representing the Days To Close [left Y-axis] an Action, as well as, the Number (of Actions) Created [right Y-axis] by week. |
|
Opened/Closed
Trend |
Vertical line chart representing total counts of actions submitted, closed and remaining open by week. |
|
Actions by Spec – Top 5 |
Vertical bar chart displaying the top five action count totals by specification. |
|
Actions by Product Line |
Pie chart representing the percentage of actions based on product line. |
|
Actions Create in Last X Month(s) |
Interactive table displaying specific information about all actions over time as defined by the “Months” global parameter. Note: Each row of the table is hyperlinked to the associated action, and if the actions have an “Affected Item” related to it, the “Alternate Suppliers” column will populate a link to another BI Publisher Report called Alternate Suppliers. |
This report has only one tab (or view) called the Alternate Suppliers which contains the following analytics:
|
Analytic Name |
Description |
|
Approved Suppliers by Facility |
Vertical bar chart displaying the number of “Approved” sourcing approvals for the Affected Spec by Supplier (Company). |
|
Actual
Category Suppliers by Facility |
Vertical bar chart displaying the number of specifications with the same “Existing Specification Categories” (defined on the Company’s Profile) as the spec category of the Affected Spec by Supplier (Company). |
|
Potential
Category Suppliers by Facility |
Vertical bar chart displaying the number of specifications with the same “Potential Specification Supply Categories” (defined on the Company’s Profile) as the spec category of the Affected Spec by Supplier (Company). |
|
Approved Suppliers |
Interactive table displaying companies/facilities with “Approved” sourcing approvals. Note: The Company column is hyperlinked to the Individual Supplier Report. |
|
Actual Category Suppliers |
Interactive table displaying companies/facilities that source the same spec category as defined on the “Existing Specification Categories” of the company’s profile. Note: The Company column is hyperlinked to the Individual Supplier Report. |
|
Potential Category Suppliers |
Interactive table displaying companies/facilities that source the same spec category as defined on the “Potential Specification Supply Categories” of the company’s profile. Note: The Company column is hyperlinked to the Individual Supplier Report. |
This report has only one tab (or view) called Supplier Report which contains the following analytics:
|
Analytic Name |
Description |
|
Total
Open Issues |
Table that contains total count of open PQM issues in their corresponding workflow SLA State (green, amber, or red). |
|
Total
Open Actions |
Table that contains total count of open PQM actions in their corresponding workflow SLA State (green, amber, or red). |
|
Total
Open Audits |
Table that contains total count of audits that are Planned, Passed or Failed within the past month. |
|
Total Open eQuestionnaires (eQs) |
Table that contains total count of open eQs and their corresponding workflow SLA State (green, amber, or red). |
|
Total “Approved” Sourcing Approvals |
Table that contains total count of the specific companies “approved” sourcing approvals. |
|
Issues
Opened/Closed Trend |
Vertical line chart representing the total counts of Opened, Closed, and Running Total issues by week. (Running Total represents the sum of all currently open issues.) |
|
Actions
Opened/Closed Trend |
Vertical line chart representing total counts of actions submitted, closed and remaining open by week. |
|
Issue by Facility |
Vertical bar chart displaying the issue counts by facilities based on issue severity. |
|
Actions By Facility |
Vertical bar chart displaying the actions counts by facilities. |
|
Issues |
Interactive table displaying specific information about all issues related to the specific facility that the supplier contact is associated. Note: Each row of the table is hyperlinked to the associated issue. |
|
Actions |
Interactive table displaying specific information about all actions related to the specific facility that the supplier contact is associated. Note: Each row of the table is hyperlinked to the associated action. |
|
Audits |
Interactive table displaying specific information about all audits related to the specific facility that the supplier contact is associated. Note: Each row of the table is hyperlinked to the associated audit. |
This report has three tabs (or views): Issues Dashboard, Action Dashboard, and Audit Dashboard.
The Issue Dashboard tab contains the following analytics:
|
Analytic Name |
Description |
|
Top
KPI’s (Key Performance Indicators) |
Table that contains the Customer, Specification, and Supplier (Company) with the most open issues and the corresponding issue counts. |
|
Total Issues Create in Last 7 Days |
Table that contains the count of Created, Submitted, and Completed Issues in the last 7 days. |
|
SLA
KPI (Service Level Agreement Key Performance Indicator) |
Table that displays the total counts of Issues with Amber and Red SLA statuses. |
|
Issue
Creation Rate by Week |
Vertical line chart of issues counts created by week based on issue severity. |
|
Issue by Customer – Top 5 |
Vertical bar chart displaying the top five customers with the most Issues based on issue severity. |
|
Issues by Product Line |
Pie chart representing the percentage of all issues based on product line. |
|
Issues
by Supplier – Top 5 |
Vertical stacked bar chart displaying the top five suppliers (companies) with the most Issues based on issue severity. |
|
Issues
by Affected Spec Failure Type |
Vertical bar chart displaying all issues counts by affected spec failure type. |
|
Issues by Issue Type – Top 5 |
Vertical stacked bar chart displaying the top five issue types with the most issues based on issue severity. |
|
Issues by Spec Category – Top 5 |
Vertical bar chart displaying the top five spec categories with the most Issues. |
|
Nonconformance Reports |
Interactive table displaying specific information about open issues with system type of “nonconformance report” and all related actions and audits to those issues. Only actions and audit that are specifically related to open issues will display in this table. Note: Each row of the table is hyperlinked to the associated PQM object. |
|
Problem Reports |
Interactive table displaying specific information about open issues with system type of “Problem Report” and all related actions and audits to those issues. Only actions and audit that are specifically related to open issues will display in this table. Note: Each row of the table is hyperlinked to the associated PQM object. |
The Action Dashboard tab contains the following analytics:
|
Analytic Name |
Description |
|
Actions
Creation Rate by Week |
Vertical line chart of action counts created by week based on the parent issue severity. |
|
Actions by Customer – Top 5 |
Vertical bar chart displaying the top five customers with the most actions. |
|
Actions by Product Line |
Pie chart representing the percentage of all actions based on product line. |
|
Actions
by Supplier – Top 5 |
Vertical bar chart displaying the top five suppliers (companies) with the most actions. |
|
Actions by Spec Type |
Vertical bar chart representing action counts by GSM specification type. |
|
Actions by Action Type – Top 5 |
Vertical bar chart displaying the top five Action Types with the most Actions. |
|
Actions
by Parent Issue Affected Spec Failure Type |
Vertical bar chart displaying all actions counts by parent issue Affected spec failure type. |
|
Open
Actions |
Interactive table displaying specific information about open PQM actions. Note: Each row of the table is hyperlinked to the associated PQM action. |
The Audit Dashboard tab contains the following analytics:
|
Analytic Name |
Description |
|
Open
Audits by Supplier |
Vertical bar chart displaying audit counts by suppliers (companies) based on simple workflow status. |
|
Open
Audits by Facility |
Vertical bar chart displaying audit counts by supplier facility (facility) based on simple workflow status. |
|
Open
Audits |
Interactive table displaying specific information about open audits. Note: Each row of the table is hyperlinked to the associated PQM audit. |
This report has two tabs (or views): Issues and Actions.
The Issues tab contains the following analytics:
|
Analytic Name |
Description |
|
Issues
by Customer – Top 5 |
Vertical bar chart displaying the top five customers with the most issues based on issue severity. |
|
Issues
by Supplier – Top 5 |
Vertical bar chart displaying the top five suppliers (companies) with the most issues based on issue severity. |
|
Issues
by Trade Specification – Top 5 |
Vertical bar chart displaying the top five trade specifications with the most issues based on issue resolution. |
|
Issues by Direct Materials – Top 5 |
Vertical bar chart displaying the top five direct material specifications (defined as non-trade specifications) with the most issues based on issue resolution. |
|
Days to Close by Product Line – Slowest 10 |
Vertical bar chart displaying the top ten product lines that took the most days to close issues. |
|
Issues
by Spec Type |
Vertical bar chart representing issues counts by GSM specification type. |
|
Problem
Reports |
Interactive table displaying specific information about all issues with system type of “Problem Report”. Note: Each row of the table is hyperlinked to the associated PQM object. |
|
Nonconformance Reports |
Interactive table displaying specific information about open issues with system type of “nonconformance report”. Note: Each row of the table is hyperlinked to the associated PQM object. |
The Actions tab contains the following analytics:
|
Analytic Name |
Description |
|
Actions
by Customer – Top 5 |
Vertical bar chart displaying the top five customers with the most actions based on the action’s parent issue severity. |
|
Actions
by Supplier – Top 5 |
Vertical bar chart displaying the top five suppliers (companies) with the most actions based on the action’s parent issue severity. |
|
Days to Close by Owner – Slowest 5 |
Vertical dual Y combination chart displaying the slowest five owners that took the most days to close actions (left Y-axis), as well as, the action counts (right Y-axis). |
|
Actions by Actions Type |
Vertical bar chart displaying the top five Action Types with the most Actions. |
|
Days
to Close by Supplier – Slowest 5 |
Vertical dual Y combination chart displaying the slowest five suppliers (companies) that took the most days to close actions (left Y-axis), as well as, the action counts (right Y-axis). |
|
Days
to Close by Product Line – Slowest 10 |
Vertical bar chart displaying the top 10 product lines that took the most days to close actions. |
|
Actions |
Interactive table displaying specific information about all PQM actions. Note: Each row of the table is hyperlinked to the associated PQM action. |
This report has only one tab (or view) called All Audits which contains the following analytics:
|
Analytic Name |
Description |
|
Audits
by Facility |
Vertical bar chart displaying audit counts by suppliers facilities based on workflow status for the specific specification in context. |
|
Audits
by Audit Type |
Vertical bar chart displaying audit counts by audit type based on the audit results for the specific specification in context. |
|
Closed
Audits |
Interactive table displaying specific information about closed audits related to the specific specification in context. Note: Each row of the table is hyperlinked to the associated audit. |
|
Planned Audits |
Interactive table displaying specific information about planned audits related to the specific specification in context. Note: Each row of the table is hyperlinked to the associated audit. |
This report has only one tab (or view) called All Audits which contains the following analytics:
|
Analytic Name |
Description |
|
Audits
by Facility |
Vertical bar chart displaying audit counts by suppliers facilities based on workflow status for the supplier (Company) in context. |
|
Audits
by Audit Type |
Vertical bar chart displaying audit counts by audit type based on the audit results for the supplier (Company) in context. |
|
Closed
Audits |
Interactive table displaying specific information about closed audits related to the supplier (company) in context. Note: Each row of the table is hyperlinked to the associated audit. |
|
Planned Audits |
Interactive table displaying specific information about planned audits related to the supplier (company) in context. Note: Each row of the table is hyperlinked to the associated audit. |
This report has two tabs (or views): Open Issues and All Issues.
The Open Issues tab contains the following analytics:
|
Analytic Name |
Description |
|
Issues
by Facility |
Vertical bar chart displaying open issue counts by supplier’s facilities based on issue severity for the facility and specification of the sourcing approval in context. |
|
Issue
by Item Type |
Vertical bar chart displaying open issue counts by issue type based on issue severity for the facility and specification of the sourcing approval in context. |
|
Open
Issues |
Interactive table displaying specific information about open issues and all related actions and audits to those issues. Only actions and audit that are specifically related to open issues will display in this table. Note: Each row of the table is hyperlinked to the associated PQM object. |
The All Issues tab contains the following analytics:
|
Analytic Name |
Description |
|
Issues
by Supplier |
Vertical bar chart displaying all issue counts by supplier (company) based on issue severity for the facility and specification of the sourcing approval in context. |
|
Issues
by Issue Type |
Vertical bar chart displaying all issue counts by issue type based on issue severity for the facility and specification of the sourcing approval in context. |
|
All
Issues |
Interactive table displaying specific information about all issues for the facility and specification of the sourcing approval in context. Note: Each row of the table is hyperlinked to the associated PQM issue. |
This report has two tabs (or views): Open Issues and All Issues.
The Open Issues tab contains the following analytics:
|
Analytic Name |
Description |
|
Open
Issues by Supplier |
Vertical bar chart displaying open issue counts by supplier based on issue severity for the specification in context. |
|
Issues
by Issue Type |
Vertical bar chart displaying open issue counts by issue type based on issue severity of the specification in context. |
|
Open
Issues with Related Actions and Audits |
Interactive table displaying specific information about open issues and all related actions and audits to those issues. Only actions and audit that are specifically related to open issues will display in this table. Note: Each row of the table is hyperlinked to the associated PQM object. |
The All Issues tab contains the following analytics:
|
Analytic Name |
Description |
|
Issues
by Supplier |
Vertical bar chart displaying all issue counts by supplier (company) based on issue severity for the specification in context. |
|
Issues
by Issue Type |
Vertical bar chart displaying all issue counts by issue type based on issue severity for the specification in context. |
|
All
Issues |
Interactive table displaying specific information about all issues for the specification in context. Note: Each row of the table is hyperlinked to the associated PQM issue. |
This report has two tabs (or views): Open Issues and All Issues.
The Open Issues tab contains the following analytics:
|
Analytic Name |
Description |
|
Open
Issues by Facility |
Vertical bar chart displaying open issue counts by facility based on issue severity for the facility or company in context. |
|
Issues
by Issue Type |
Vertical bar chart displaying open issue counts by issue type based on issue severity for the facility or company in context. |
|
Open
Issues with Related Actions and Audits |
Interactive table displaying specific information about open issues and all related actions and audits to those issues. Only actions and audit that are specifically related to open issues will display in this table. Note: Each row of the table is hyperlinked to the associated PQM object. |
The All Issues tab contains the following analytics:
|
Analytic Name |
Description |
|
Issues
by Facility |
Vertical bar chart displaying all issue counts by Facility (company) based on issue severity for the facility or company in context. |
|
Issues
by Issue Type |
Vertical bar chart displaying all issue counts by issue type based on issue severity for the facility or company in context. |
|
All
Issues |
Interactive table displaying specific information about all issues for the facility or company in context. Note: Each row of the table is hyperlinked to the associated PQM issue. |
This report has one tabs (or views) called Access.
The Access tab contains the following analytics:
|
Analytic Name |
Description |
|
Permitted
Groups |
Interactive table displaying specific groups and assigned users with the defined access to the specification. |
|
Permitted
User |
Interactive table displaying specific user with defined access to the specification. |
|
Permitted
Special Users |
Interactive table displaying specific user with special access granted by their association to the specification as an Author, Owner or Signator. |
This report has one tabs (or views) called Access Details.
The Access Details tab contains the following analytics:
|
Analytic Name |
Description |
|
User
Specific Access |
Interactive table displaying specific (Y or N) user access to the following security aspect: BU Access, [SPEC_ADMIN] access, Workflow Visibility access, Author access, Owner access, Signator access. |
|
User
Workflow Permission |
Interactive table displaying specific user access to Read, Write or Workflow the specification as defined on the specification’s workflow. |
|
Permitted
Special Users |
Interactive table displaying workflow configuration for which the specification in context is assigned. |
|
Summary
View |
Interactive table displaying the summarized access (Read, Workflow or Write) to the specification for the user. |
This report has four tabs (or views): GSM Basic Statistics, NPD Basic Statistics, UGM Basic Statistics, and PQM Basic Statistics.
The GSM Basic Statistics tab contains the following analytics:
|
Analytic Name |
Description |
|
Object
Type Counts by Workflow |
Interactive table displaying GSM object types counts by workflow name and workflow. |
|
Summary |
Interactive table displaying GSM object type counts. |
|
Object
Type Counts by Categories |
Interactive table displaying GSM object types counts by Category Subcategory and Group. |
The NPD Basic Statistics tab contains the following analytics:
|
Analytic Name |
Description |
|
NPD
Project Counts |
Interactive table displaying NPD project counts by status. |
|
NPD
Strategic Brief Counts |
Interactive table displaying NPD Strategic Brief Counts by status. |
|
NPD
Innovation Sales Pipeline Counts |
Interactive table displaying NPD Innovation Sales Pipelines counts by status. |
The UGM Basic Statistics tab contains the following analytics:
|
Analytic Name |
Description |
|
Number
of Active Users by Module |
Interactive table displaying the number of active user by Module and PLM for Process Package, as well as, Total Approved Registrants (suppliers), and Total Distinct Users. |
The PQM Basic Statistics tab contains the following analytics:
|
Analytic Name |
Description |
|
PQM
Object Counts |
Interactive table displaying PQM objects counts by workflow name and status. |
This report has two tabs (or views): eQ Dasboard – Open eQs and eQ Dashboard – All eQs.
The eQ Dasboard – Open eQs tab contains the following analytics:
|
Analytic Name |
Description |
|
Open
eQs by Type |
Vertical bar chart displaying open eQs by eQs Type. |
|
Open
eQs by Primary Owner – Top 5 |
Vertical bar chart displaying open eQs by Primary Owner filter by Top five based on count. |
|
Open
eQs by Company – Top 5 |
Vertical bar chart displaying open eQs by Company filter by top five based on count. |
|
Pase
Due by Company – Top 5 |
Vertical bar chart displaying Past Due eQs by Company filter by top five based on count. |
|
Open
eQs |
Interactive table displaying specific information about open eQs that are assigned to a “real” SCRM Company. This table includes information such as SLA state of the eQ, eQ Type, title, Company, Primary Owner, status and Days until Due. |
|
Open
eQs not Associated to SCRM Companies |
Interactive table displaying specific information about open eQs that are NOT assigned to a “real” SCRM Company. This table includes information such as SLA state of the eQ, eQ Type, title, Company, Primary Owner, status and Days until Due. |
The eQ Dashboard – All eQs tab contains the following analytics:
|
Analytic Name |
Description |
|
eQ
Company Summary |
Interactive table displaying Total open eQs, Total Closed eQs, and Average Time to Submit by Company Name. |
|
Average
Supplier Response Time – Last 52 Weeks |
Vertical dual Y combination chart displaying the number of eQs submitted (left Y-axis) and the Average Days for all companies to submit eQs (right Y-axis). |
|
eQ
Counts and Days to Submit by Company – 20 Slowest |
Vertical dual Y combination chart displaying the number of eQs submitted (left Y-axis) and the Average Days for the company to submit the eQ (right Y-axis) filtered by the 20 slowest. |
|
All
eQs |
Interactive table displaying specific information about all eQs that are assigned to a “real” SCRM company. This table includes information such as SLA state of the eQ, eQ Type, title, Company, Primary Owner, status and Days until Due. |
|
All
eQs not Associated to SCRM Companies |
Interactive table displaying specific information about all eQs that are NOT assigned to a “real” SCRM company. This table includes information such as SLA state of the eQ, eQ Type, title, Company, Primary Owner, status and Days until Due. |
This report has one tabs (or views): eQ Dasboard – SP.
The eQ Dasboard – SP tab contains the following analytics:
|
Analytic Name |
Description |
|
eQ
Company Summary |
Interactive table displaying Total open eQs, Total Closed eQs, and average time to submit by Company Name. If a supplier contact is associated to multiple SCRM companies, this table will expose data for all associated companies. |
|
Average
Days to Submit by Week – Last 52 Weeks |
Vertical line chart displaying the average days for the company to submit eQs. |
|
Open
eQs by Supplier Contact |
Vertical bar chart displaying open eQs counts by supplier contact. |
|
Average
Day to Submit eQs by Supplier Contact |
Vertical bar chart displaying average days to submit an eQ by supplier contact. |
|
ALL
eQs |
Interactive table displaying specific information about all eQs that are assigned to the supplier. This table includes information such as SLA state of the eQ, eQ Type, title, Company, Primary Owner, status and Days until Due. |
This report has one tab (or view): Material Cost Matrix.
The Material Cost Matrix tab contains the following analytics:
|
Analytic Name |
Description |
|
Material
Cost Matrix |
Interactive table displaying equivalent number, Cost/Lb, and Cost /KG of the material or packaging material specification by Cost Set. |
This report has one tab (or view) called Spec Lineage History.
The Spec Lineage History tab contains the following analytics:
|
Analytic Name |
Description |
|
Cross
Reference Lineage |
Interactive table displaying Spec Name, Spec Number, Create Date, Originator, Last Modified, Status Pack Size Description, Pack Size UOM and Reason for Change by equivalent number. |
This report has one tab (or view) called Sourcing Approval Risk.
The Sourcing Approval Risk tab contains the following analytics:
|
Analytic Name |
Description |
|
Top
10 Spec Categories with Single Supplier or No Approved Sourcing Approval |
Vertical bar chart displaying total counts of specifications by category with 1 or 0 approved sourcing approvals filter by top 20. |
|
Approved
Specifications with Approved Sourcing Approvals from Single Supplier |
Interactive table displaying information for Single sourced specification such as Spec Type, Spec #, Spec Name, Equivalent, Category, Subcategory, Group, Supplier Company and Facility. Note: The alternate supplier report can be launched from this report by clicking the alternate supplier column on the desired row. |
|
Approved
Specifications without an Approved Sourcing Approval |
Interactive table displaying information for specification without an approved sourcing approval, such as, Spec Type, Spec #, Spec Name, Equivalent, Category, Subcategory, Group,. Note: The alternate supplier report can be launched from this report by clicking the alternate supplier column on the desired row. |
This report has one tab (or view) called Supplier Rationalization.
The Supplier Rationalization tab contains the following analytics:
|
Analytic Name |
Description |
|
Supplier
Summary |
Interactive table displaying Supplier Company Name and counts of Approved Sourcing Approvals with Approved Specifications |
|
Sourcing
Approval Counts for Supplier Companies by Spec Type |
Interactive horizontal bar chart displaying number of approved sourcing approvals with Approved Specifications by Company Name filtered by Spec type. |
|
“Approved”
Sourcing Approval Details for Supplier |
Interactive table displaying detailed information about suppliers that meet the Approved Spec Count parameter including Spec Type, Supplier Company, Facility, Spec #, Spec Name, Equivalents, Supplier Item #, Category, Sub Category and Group. Note: The alternate supplier report can be launched from this report by clicking the alternate supplier column on the desired row. |
This report has one tab (or view) called Supplier Compliance Report – Companies and Facilities.
The Supplier Compliance Report – Companies and Facilities tab contains the following analytics:
|
Analytic Name |
Description |
|
Company
and Facility Supplier Document Management |
Interactive table displaying detailed information about supplier documentation including Company Name, Facility Name, SCRM Company BU, Document Type, Description, Originator, Days until Due and Days until Expired. |
This report has one tab (or view) called Supplier Compliance Report – Companies and Facilities.
The Supplier Compliance Report – Companies and Facilities tab contains the following analytics:
|
Analytic Name |
Description |
|
Sourcing
Approval Supplier Document Management |
Interactive table displaying detailed information about sourcing approval documentation including Company Name, Facility Name, GSM BU, Document Type, Description, Spec Type, Equivalents, Category, Sub Category, Group, Originator, Days until Due and Days until Expired. |
This report has one tab (or view) called Supplier Compliance Report – SP. The Supplier Compliance Report – SP tab contains the following analytics:
|
Analytic Name |
Description |
|
Company
and Facility Supplier Document Management |
Interactive table displaying detailed information about supplier documentation including Company Name, Facility Name, Document Type, Description, Equivalent, Originator, Days until Due and Days until Expired. |
|
Sourcing
Approval Supplier Document Management |
Interactive table displaying detailed information about sourcing approval documentation including Company Name, Facility Name, Document Type, Description, Spec Type, Equivalents, Category, Sub Category, Group, Originator, Days until Due and Days until Expired. |