| Oracle® Retail Assortment and Space Optimization User Guide Release 14.1 E59122-01 |
|

 Previous |
 Next |
| Oracle® Retail Assortment and Space Optimization User Guide Release 14.1 E59122-01 |
|
Previous |
Next |
This chapter provides details about using the Execute Space Optimization tab.
The Execute Space Optimization tab provides a series of four stages that you progress through in order to set up, run, and analyze the results of the optimization run:
Optimization Setup. Used to pick a planogram set, the locations, and the optimization level.
Fixture and Product Data. Used to view or change fixtures and product merchandise settings.
Objective and Constraints. Used to view or choose optimizations, objectives, and constraints.
Results and Analysis. Used to view results and override, approve, or revisit prior steps in order to make changes.
The Optimization Setup stage is used to pick a planogram set, the locations, and the optimization level. It is organized into three major sections: the Summary section, the Setup section, and the Review Optimization Locations section.
During this stage, if a planogram does not have detailed shelf information, ASO, using the smart start process, automatically assigns shelves to these partial shelf fixture planograms (PSFP) using configured parameters. These planograms are flagged in the Partial Fixtures column in the Planogram Fixtures tab (see Fixture and Product Data).
This tab is read-only if the run has been submitted to the system, if the user does not have permission to edit runs, or if the user has permission to edit runs but not create runs.
After you have made your selections, you can go to the next stage by clicking the Next button, submit the run for optimization, or validate the data. Use the Action menu to access Submit and Validate. If you submit the run for optimization at this point, the default rules and settings are used.
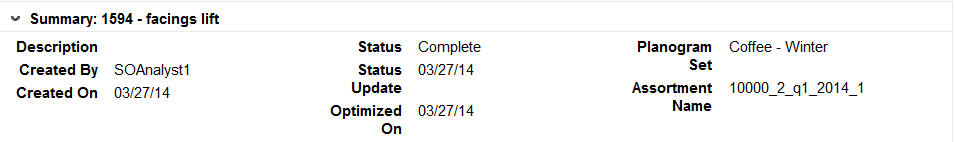
The Summary section, shown in Figure 4-1, identifies the run you are configuring. This section is populated once you provide the required information in the Setup section. It contains the fields listed in Table 4-1.
The Summary section is displayed at the top of each tab in the Execute Space Optimization stage.
Table 4-1 Summary Section Fields
| Field | Description |
|---|---|
|
Description |
The name for the run. |
|
Created By |
The user ID of the person who has created the run. |
|
Created On |
The date when the run was created. |
|
Status |
The status of the run. Values include Setup in Progress, Running, Complete, Approved, and Finalized. |
|
Status Update |
The date when the status for the run was last updated. |
|
Optimized On |
The date when the run was last submitted for optimization. |
|
Planogram Set |
The name of the planogram set, which is selected from the Select Planogram Set dialog box. A planogram set name is a concatenation of the subcategory name and the season name. |
|
Assortment Name |
A comma-separated list of all assortments associated with the run. |
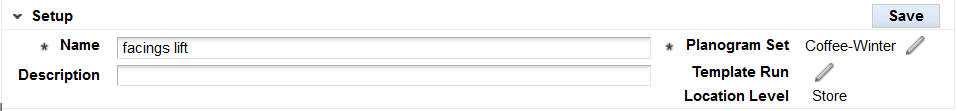
The Setup section, shown in Figure 4-2, is used to define and configure the run and provides access to dialog boxes that you use to select the Planogram sets and the optional Template to use for the run. In addition, you identify the Location Level for the run.
Click the Save button to save changes to the Name and Description fields. You also use this button to save changes to the planogram set, location level, and template run fields.
Table 4-2 Setup
| Field | Description |
|---|---|
|
Name |
The name identifying the run. The name must be 80 characters or less and use alphanumeric characters only. It is case sensitive. |
|
Description |
A brief description of the run. The value must be 200 characters or less and use alphanumeric characters only. |
|
Planogram Set |
The field displays the name of the planogram set you select for the run. The name is a concatenation of the subcategory name and the season name. Click the Pencil icon to access the Planogram Set dialog box, from which you make a selection. |
|
Template Run |
The field displays the name of the template you optionally select to use when creating a new run. Click the Pencil icon to access the Template Run dialog box, from which you make a selection. |
|
Location Level |
Choose the Location Level for the run from the drop-down list. Values are Space Cluster and Store. |
Use this check box to activate or deactivate the use of the POG configuration in the clustering process.
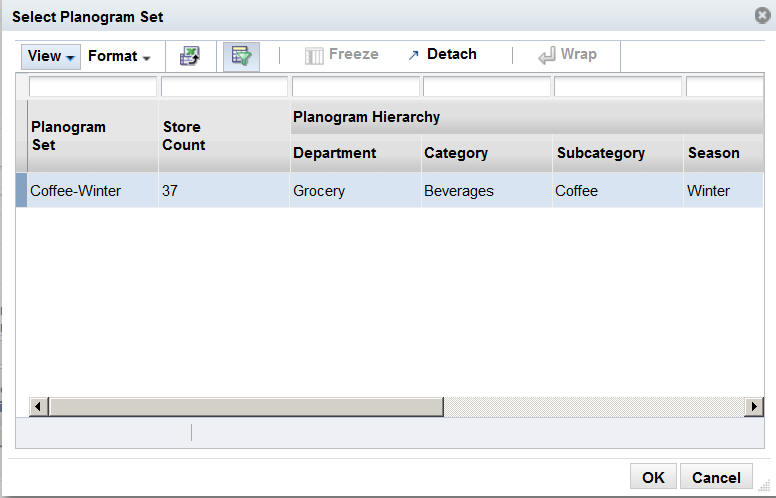
The Select Planogram Set dialog box, shown in Figure 4-3, which you access by clicking the Pencil icon adjacent to Planogram Set, lists all the planograms that are available to you for the run. You can select only one.
Highlight the appropriate row and click OK. If you change this selection after either selecting stores or building optimization location tables, then you must re-select the stores and the optimization locations for those stores.
Table 4-3 Select Planogram Set
| Field | Description |
|---|---|
|
Planogram Set |
The display name for the planogram set. The name is a concatenation of the subcategory name and the season name. |
|
Store Count |
The number of stores associated with the planogram set. |
|
Planogram Hierarchy Department |
The planogram set belongs within a hierarchy that consists of Department, Category, Subcategory, and Season. |
|
Planogram Hierarchy Category |
The planogram set belongs within a hierarchy that consists of Department, Category, Subcategory, and Season. |
|
Planogram Hierarchy Subcategory |
The planogram set belongs within a hierarchy that consists of Department, Category, Subcategory, and Season. |
|
Planogram Hierarchy Season |
The planogram set belongs within a hierarchy that consists of Department, Category, Subcategory, and Season. |
|
Assortment Details Product Category |
A comma-separated list of the assortment IDs that the planogram set applies to. |
|
Assortment Details ID |
The external ID of the planogram set. |
|
Assortment Details Name |
A comma-separated list of the assortment external IDs that the planogram set applies to. |
The Select Template Run dialog box, which you access by clicking the Pencil icon adjacent to Template Run, lists all the previous runs that are available to you to use as a template in creating a new run. You can select only one. Highlight the appropriate row and click Save. The new run you is initialized using values and settings that were used in the template run and apply to the new run. This is optional. You can use the No Template button to clear the template selection.
Table 4-4 Select Template Run
| Field | Description |
|---|---|
|
ID |
The ID that identifies the run. |
|
Name |
The name of the run. |
|
Description |
A brief description of the run. |
|
Planogram Set |
The planogram set associated with the run. |
|
Created By |
The user ID of the person who created the run. |
|
Run Status |
The status of the run. Values include Setup in Progress, Running, Complete, Approved, and Finalized. |
|
Status Update |
The date when the status for the run was last updated. |
The location level identifies the level at which the optimization occurs. You select either Space Cluster or Store from the drop-down list. If you change the value of this field after building the optimization locations, then the optimization locations are re-built using the store you selected and at the new location level.
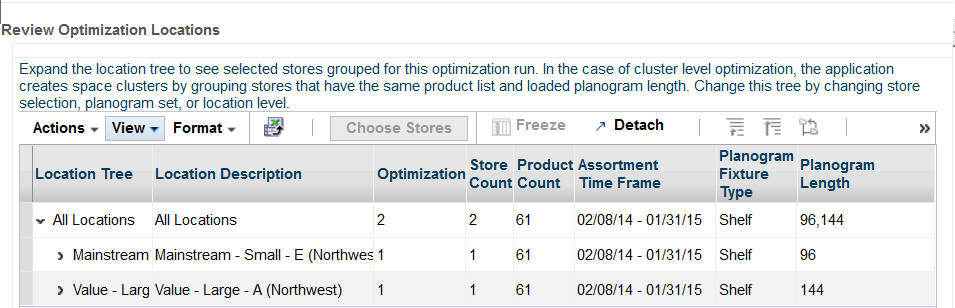
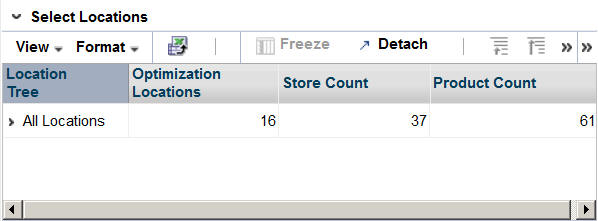
The Review Optimization Locations table, shown in Figure 4-4, displays the optimization locations for the optimization.
You can use this table to edit the list of existing locations or add new locations. The locations are listed in a tree structure that shows the hierarchy the optimization locations are part of. If the location level is set to Space Cluster, then the lowest level of the tree is space cluster. If the location level is set to Store, then the lowest level of the tree is store.
Table 4-5 Review Optimization Locations
| Field | Description |
|---|---|
|
Location Tree |
Displays the node name in the optimization location hierarchy tree. The lowest level is either space cluster of store. |
|
Location Description |
A brief description of the optimization location hierarchy node. |
|
Optimization Locations |
The number of optimization locations under the optimization location hierarchy node. The lowest level is always "1" |
|
Store Count |
The number of stores in the optimization location hierarchy node. If the location level is store, then it will be "1" for the lowest level. |
|
Product Count |
The number of products for the optimization location, based on the associated assortment. |
|
Assortment Time Frame |
The start date and end date for which the optimization location's associated assortment is valid, across products. |
|
Planogram Fixture Type |
A comma-separated list of unique planogram fixture types that exist for the optimization location hierarchy node. |
|
Planogram Length |
A comma-separated list of unique planogram lengths that exist for the optimization location hierarchy node. |
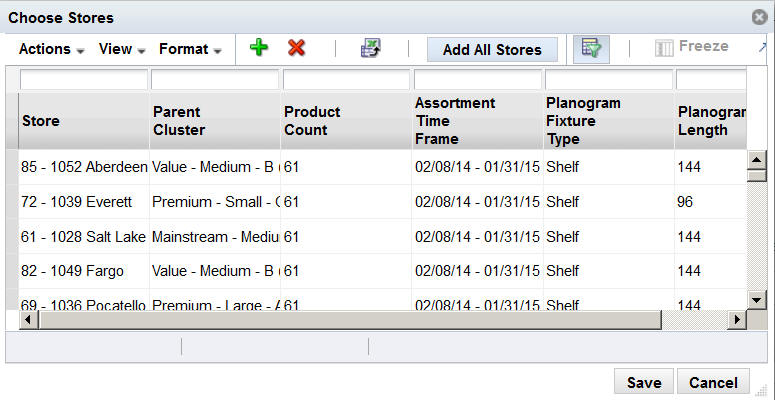
Click the Choose Stores button to add locations to the optimization run. The Selected Stores dialog box, shown in Figure 4-5, lists the stores that you have already selected for the optimization locations.
If you have not yet selected any stores, then no stores are listed and the table is blank. This can occur if you have changed the planogram set for the run or in the case of new runs (in which stores have not yet been added).
The Choose Stores dialog box contains the following fields:
Table 4-6 Choose Stores
| Field | Description |
|---|---|
|
Store |
The identification for the store. It is a concatenation of the store code and the store name. |
|
Parent Cluster |
The name of the cluster that the store belongs to. |
|
Product Count |
The number of products that the store carries that belong to the assortment associated with the planogram set that you selected. |
|
Assortment Time Frame |
The start date and end date during which the assortment associated with the planogram set you selected is valid. |
|
Planogram Fixture Type |
A comma-separated list of the unique planogram fixture types available for the associated planogram set's assortment at the store. |
|
Planogram Length |
A comma-separated list of the unique planogram lengths available for the associated planogram set's assortment at the store. |
You use the Choose Stores dialog box for adding stores and deleting stores. It is enabled once you provide the required information in the Summary section. To add stores, click the Add icon in order to access the Adding Stores functionality. To delete stores, highlight one or more stores from the Choose Stores list and click the Delete icon. You can also click the Add All Stores button in order to add all the stores for which the planogram set you selected applies.
When you click OK in the Choose Stores dialog box, the list of selected stores is saved and the optimization locations are built or re-built. As long as the run is in a state in which the optimization locations can be edited, you can update the list and re-build the optimization locations.
When you click Cancel in the Choose Store dialog box, all the changes you have made to the list of selected stores are reverted and no changes are made to the optimization locations.
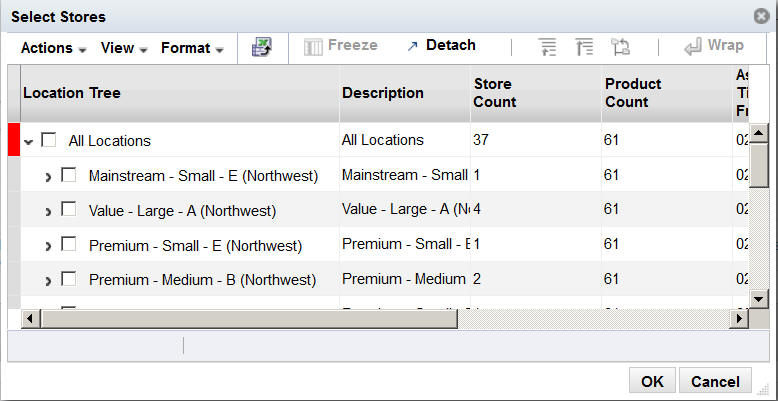
You add stores through the Select Stores dialog box, which you access by clicking the Add icon in the Choose Stores dialog box. The Select Stores dialog box, shown in Figure 4-6, displays a list of stores that can be added to the optimization run, based on the run's Planogram Set value.
The Select Stores dialog box contains the following fields:
Table 4-7 Select Stores
| Field | Description |
|---|---|
|
Location Tree |
The name of the location hierarchy node. If it is the lowest level, it is space cluster or store. |
|
Description |
A brief description of the location hierarchy node. |
|
Store Count |
The number of stores in the optimization location hierarchy node. If the location level is store, then it will be "1" for the lowest level. |
|
Product Count |
The number of products in the location, based on the associated assortment. |
|
Assortment Time Frame |
The start date and end date during which the location's associated assortment is valid. |
|
Planogram Fixture Type |
A comma-separated list of unique planogram fixture types for the location hierarchy node. |
|
Planogram Length |
A comma-separated list of unique planogram lengths for the location hierarchy node. |
The following information is only available when the optimization locations have been defined.
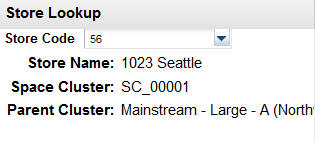
You can use Store Lookup, shown in Figure 4-7, to access information about a store. You must provide the store code, either by entering it into the text field provided or by selecting it from the drop-down list. This list is populated based on the optimization location selected for the run.
Once you select the store, you see the following information:
Store name
Optimization location (if location level is Space Cluster)
Parent cluster
You can use the Space Cluster Lookup, shown in Figure 4-8, to see the list of stores associated with a specific space cluster. You must provide the name of the space cluster, either by entering it into the text field provided or be selecting it from the drop-down list. The list is populated based on the optimization location selected for the run.
Once you select the space cluster, you see a list of the component stores.
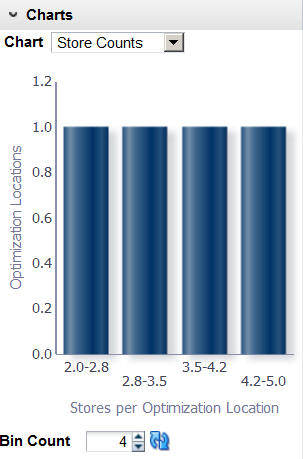
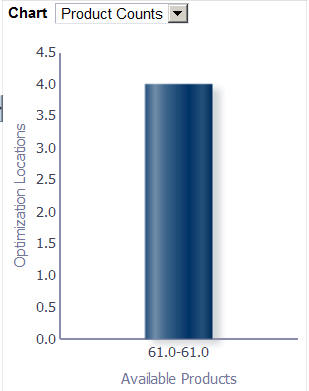
Two charts are provided in which you can see the variation in store counts by optimization location and product counts by optimization location. The charts are populated with data once the optimization location has been configured. Figure 4-9 provides an example of the store count chart.
The Fixture and Product Data stage is divided into a Summary section, a Planogram Fixtures tab, and a Product Merchandising Data tab. The Summary section identifies the characteristics of the run. The Planogram Fixtures tab is used to review the available planogram lengths for each optimization location and to update the selected configuration for each available length from a set of configurations for each length. The Product Merchandising Data tab is used to assign merchandising options to products. These assignments can vary by product or optimization location.
This tab can only be edited by the user who created the run and only before the run has a status of Running, Approved, or Finalized.
The Summary section, shown in Figure 4-1, identifies the run you are configuring.
Table 4-8 Summary Section Fields
| Field | Description |
|---|---|
|
Description |
The name for the run. |
|
Created By |
The user ID of the person who has created the run. |
|
Created On |
The date when the run was created. |
|
Status |
The status of the run. Values include Setup in Progress, Running, Complete, Approved, and Finalized. |
|
Status Update |
The date when the status for the run was last updated. |
|
Optimized On |
The date when the run was last submitted for optimization. |
|
Planogram Set |
The name of the planogram set, which is selected from the Select Planogram Set dialog box. |
|
Assortment Name |
The name of the assortment associated with the planogram set. |
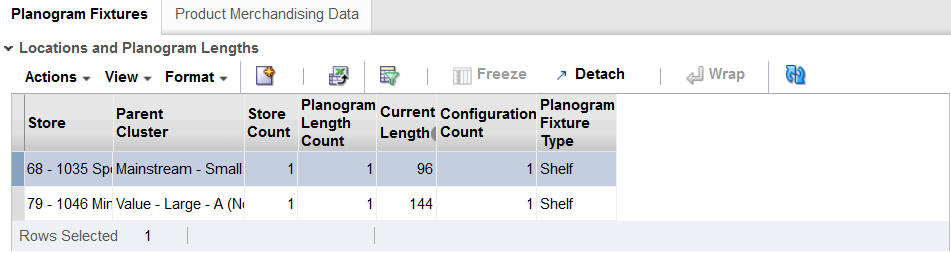
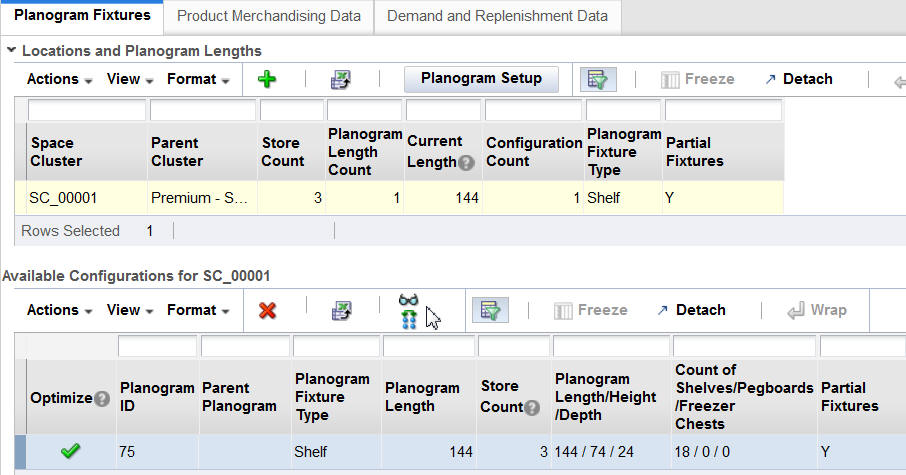
The Planogram Fixtures tab contains two sections: the Locations and Planogram Lengths table and the Available Configurations table.
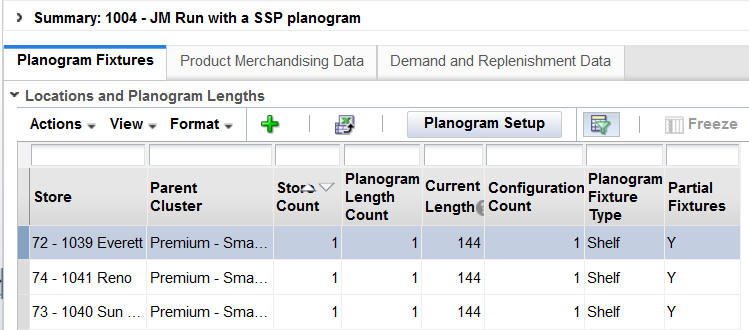
This table, shown in Figure 4-11, displays the run's optimization location and provides metrics about the available planogram configurations for each run.
You can create new lengths, which can be either shorter or longer than the current lengths (subject to validation), and refresh the table display.
Table 4-9 Locations and Planogram Lengths
| Field | Description |
|---|---|
|
Space Cluster/Store |
The name of the space cluster or store. |
|
Parent Cluster |
The name of the parent cluster of the optimization location. |
|
Store Count |
The number of stores in the optimization location. |
|
Current Length |
The length of the configuration that is currently ready for optimization. |
|
Planogram Length Count |
The number of unique planogram lengths in the optimization location. |
|
Configuration Count |
The number of planogram configurations in the optimization location. |
|
Planogram Fixture Type |
A comma-separated list of the unique fixture types present across all configurations that are ready for optimization. This list includes fixture types that have been created by the user. |
|
Partial Fixtures |
Y indicates that the planogram does not have detailed shelving data and that ASO generated the fixture configuration based on configuration parameters. N indicates that the planogram has complete shelving data. |
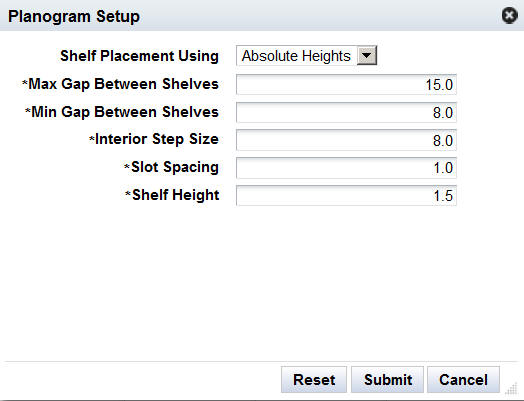
Planogram Setup
Select Planogram Setup to access the Planogram Setup dialog box. This button in enabled after you select at least one optimization location row from the table. The Planogram Setup dialog box contains the parameters used during the smart setup process to generate the Partial Shelf Fixture Planogram (PSFP). You can edit these parameters and rerun this process using this dialog box. These parameters are described in Table 4-10. Note that the allowable minimum and maximum values permitted in this dialog box are configured in the database.
Table 4-10 Planogram Setup Parameters
| Field | Description |
|---|---|
|
Shelf Placement Using |
This drop-down menu as two options, Height Percentile and Absolute Height. The choice you make between these two options determines the types of values (percentage or numeric) used by some of the parameters and which parameters are displayed. |
|
Max Gap Between Shelves |
|
|
Min Gap Between Shelves |
|
|
Interior Step Size |
|
|
Absolute Min Gap |
|
|
Slot Spacing |
|
|
Shelf Thickness |
The following buttons are available in this dialog box:
Reset – Use this button to update the values for all the parameters to the configured default values. You must then click Submit to rerun the SSP.
Submit – Use this button to rerun the smart start process for the optimization locations you selected, based on the parameter values you entered here. When you click this button, the dialog box closes and the available configurations table is refreshed with the new configurations generated by SSP. The new values that you provided for the parameters are saved at the optimization location level.
Cancel – Use this button to close the dialog box without making any changes.
If some of the locations you select do not have partial fixtures, they are not processed by SSP. You will see a message if this occurs.
If some of the locations you select also have overrides that apply, these overrides are also applied. You will see a warning message if this is the case.
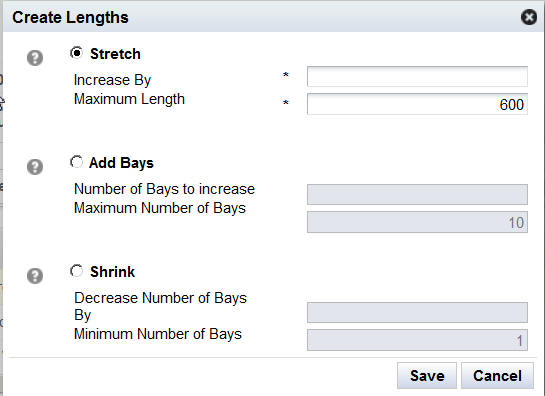
Create Lengths
Select Create from the Actions menu to access the Create Lengths dialog box, shown in Figure 4-14. You use this to create new planogram configurations for the optimization locations you select. This involves stretching or shrinking a configuration that is marked for optimization. In addition, you can add new bays to the right. If you want to create new lengths for a configuration that has not been marked for optimization, you must mark that configuration for optimization. but it must be a loaded configuration, which can be identified by the fact that the Parent Planogram field is empty or null.
Stretch
To stretch the length, select the Stretch radio button. Stretching changes the planogram by adding length to the last bay (including internal objects). It adds as much length as defined within the Increase By field up to the Maximum length.
A new configuration is created that is a copy of the base configuration. The planogram is shrunk by removing the bays from right to left. The length, in generic measurement length units, is adjusted based on the bays that are removed. That copy is then modified based on the values you enter in the following two fields:
Table 4-11 Create Lengths: Stretch
| Field | Description |
|---|---|
|
Increase By |
Use to specify how much to stretch the base configuration in order to create the new configuration. The value must be less than or equal to the value you enter in the Maximum Length field. The unit of measurement is agnostic. |
|
Maximum Length |
Use to specify the maximum length possible for the new configuration. The default value that is displayed is configurable during implementation. You can change the default value, but the new value must be less than or equal to the default. |
Add Bays
To add bays, select the Add Bays radio button. The add bay process creates a copy of the right-most bay, including the fixtures, shelves, pegs, and freezers. The copy is added after the last existing bay on the right. You determine the number of copies added by entering the appropriate value into the dialog box, as described in Table 4-12.
Table 4-12 Create Lengths: Add Bays
| Field | Description |
|---|---|
|
Number of Bays to Increase |
Indicates the number of bays to add. Must be an integer value. |
|
Maximum Number of Bays |
Indicates the maximum number of bays the new POG is permitted to have. This adds as many bays as indicated in the Number of Bays parameter, as long as the overall bay count for the POG does not exceed the maximum value provided for this parameter. Must be an integer value. |
Note that adding bays has the effect of increasing the number of shelves, which in turn changes the count of shelves displayed in the UI. Other metrics may also change.
Shrink
To shrink the length, select the Shrink radio button. Shrinking changes length (decrease) by eliminating starting from the last bay as many bays as defined by the Decrease Number of Bays, making sure that at least the minimum number of bays remain.
A new configuration is created that is a copy of the base configuration. The changes are made to the bays (not to the length). The copy is modified based on the values you enter in the following two fields:
Table 4-13 Create Lengths: Shrink
| Field | Description |
|---|---|
|
Decrease Number of Bays By |
Use to specify, in terms of the number of bays, how much to shrink the base configuration in order to create the new configuration. |
|
Minimum Number of Bays |
Use to specify the minimum number of bays for the new configuration. The default value that is displayed is configurable during implementation. You can change the default value, but the new value must be less than or equal to the default. |
If the values you specify are the same as those for a configuration (same parent planogram and same length), no new configuration is created. If the values you specify do not fall within the defined minimum and maximum values for shrinking or stretching, the new configuration will be defined by the minimum or maximum value instead.
The new configuration is marked for optimization automatically by the system. Other configurations with the same length are un-marked. If the new configuration is actually the same as the existing one, the existing configuration is marked for configuration.
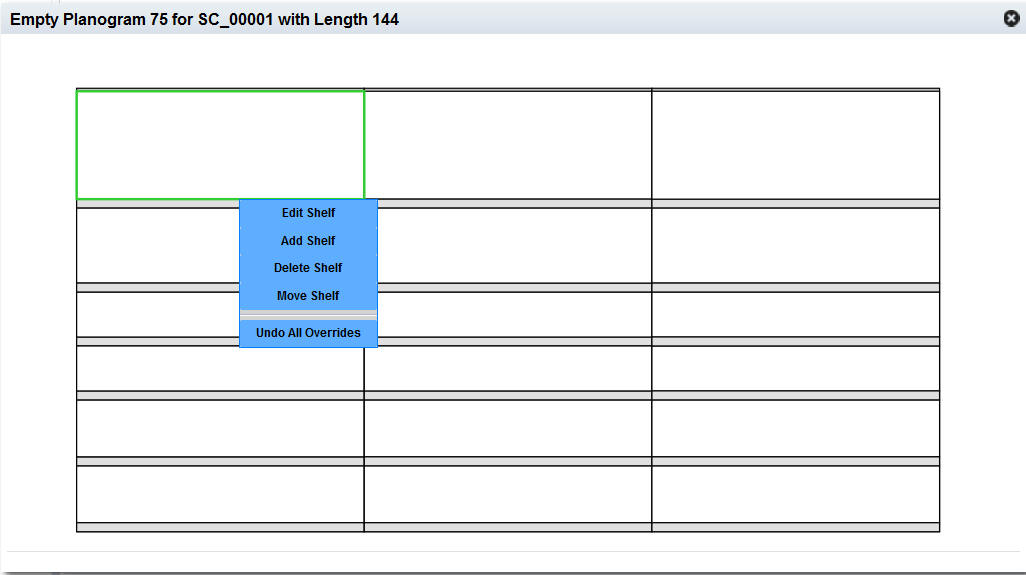
You can make certain modifications to the run-specific POG data that is used in optimization. These modifications include adding, deleting, editing, and moving shelves associated with shelf fixtures as well as restoring prior settings.
Fixture overrides exist at the optimization level. This means that store-level optimization requires store-by-store fixture overrides and cluster level optimization requires cluster-by-cluster fixture overrides.
To make these modifications, highlight the space cluster of interest and click the Goggle icon. An empty planogram is displayed. Right-click on a shelf to access the Edit dialog box.
Add
You can add a new shelf to an existing fixture. To do this, select the fixture and then use the right-click menu to access the Add functionality. You see a dialog box the shows defaults. You can change the depth, thickness, and elevation of the new shelf. Note that the new shelf must fit within the existing fixture and it cannot overlap with other shelves.
Delete
You can delete a shelf from an existing fixture. To do this, select the shelf you want to delete and use then use the right-click menu to access the Delete functionality. You will be asked to confirm the deletion.
After you delete the shelf, the space where the shelf existed will no longer show a shelf. If a bottom shelf was deleted, then the shelf and the space up to the next shelf (or top of fixture if no shelves) will be replaced by a grey background.
Edit
You can edit an existing shelf. To do this, click on a shelf and use the right-click menu to access the Edit functionality. You see a dialog box where you can change the depth and the thickness of the shelf.
Move
You can move an existing shelf to a new location. To do this, select the shelf you want to move and use the right-click menu to access the Move functionality. You see a dialog box that you can use to enter a new value for elevation.
Restore
You can restore a POG to the most recently loaded or updated version of that historical POG, based on the most current data feed updates made to the historical POG configuration. You cannot restore POGs that were created per macro changes. In such cases, you can delete the run and start over with the most recently loaded or updated version of that historical POG.
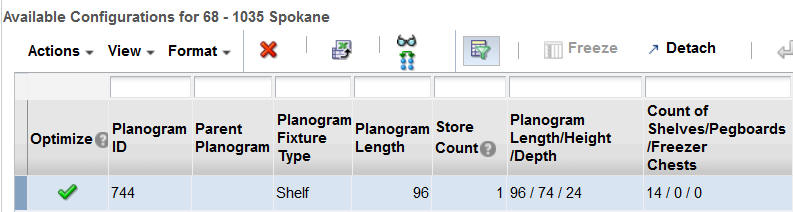
This table, shown in Figure 4-17, displays details about the configuration available for the row you select in the Locations and Planogram Lengths table. If you select more than one row, you will see the message "No Data to Display."
The Available Configurations table contains the fields listed in Table 4-14.
Table 4-14 Available Configurations
| Field | Description |
|---|---|
|
Optimize |
Indicates that the configuration is marked for optimization. |
|
Planogram ID |
The ID that identifies the configuration (planogram). |
|
Parent Planogram |
The base planogram configuration used to create the new configuration. It is always a loaded configuration. The value is Null for an externally loaded configuration. |
|
Planogram Fixture Type |
A comma-separated list of the unique fixture types in the configuration. |
|
Planogram Length |
The length of the planogram. |
|
Store Count |
The number of stores that use the configuration for this run's assortment. |
|
Planogram Length/Height/Depth |
The dimensions of the configuration. |
|
Count of Shelves/Pegboards/Freezer Chests |
Count for the number of each type of fixture that exists in the configuration. |
You can perform the following actions with respect to the Available Configurations table. You can initiate each action from the Actions menu or in some cases by clicking the appropriate icon.
Mark for Optimization
You must mark a configuration to make it available for optimization. Only marked configurations are displayed in the Results and Analysis tab. Note that only one configuration for a given length can be marked for optimization. If one configuration for a given length is currently marked for optimization, and you select another configuration of the same length, the first configuration is un-marked.
Delete
You can delete any user-created lengths (identified by non-null values in the parent Planogram column) in the table. If you delete a configuration that is marked for optimization, all configuration of that configuration's length will be deleted.
View Configuration
You can view a diagram of the selected configuration by clicking the View Configuration icon.
Compare to History
Click the Compare to History icon to see a diagram of the historical planogram used for the selected configuration.
A chart is provided that displays summary data for the planogram lengths that are being used for the optimization. This information can help you understand what the current macro space allocation is and what has been added.
Three series for this chart are available. One series shows the count of current lengths and a second series shows the count of added lengths for a given planogram length. If there are no added lengths, then the chart should only show the current lengths. The count is across all optimization locations. The total count of all current lengths should be the number of optimization locations. You can also see product heights, charted by percentage or numeric values, and representing the entire run.
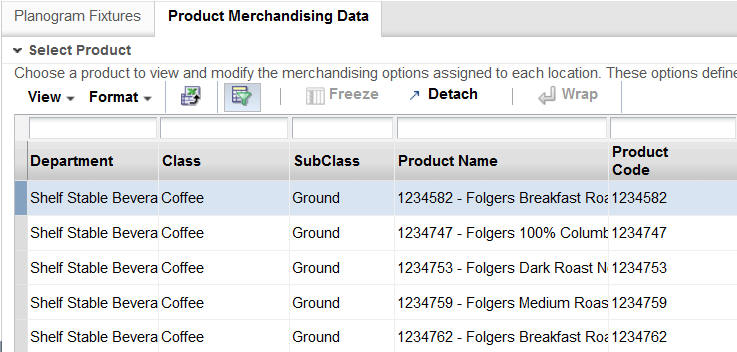
The Product Merchandise Data tab contains two main sections: The Select Products table and the Merchandising Options table. This stage addresses how products are placed on fixtures.
This table, shown in Figure 4-18 lists all available products. Each product is identified by the details of its hierarchy (level 1-3, department, class, and sub-class), as well as product name and product code.
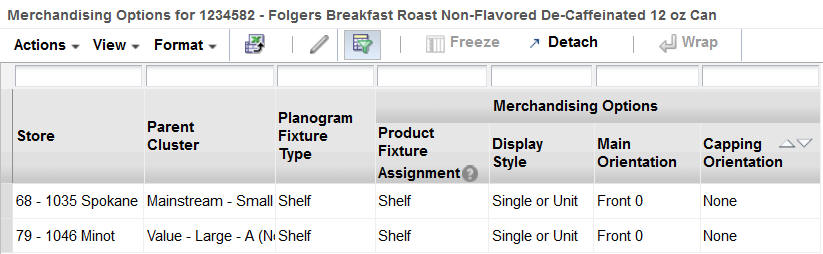
This table, shown in Figure 4-19, displays the merchandising options for all optimization locations for the product you select in the Select Product table. A merchandising option is the combination of fixture type, display style, main orientation, and capping orientation.
Table 4-15 lists the fields for Merchandising Options.
Table 4-15 Merchandising Options
| Field | Description |
|---|---|
|
Space Cluster/Store |
Indicates the location level for the product. |
|
Parent Cluster |
The name of the parent cluster. |
|
Planogram Fixture Type |
A comma-separated list of the unique fixture types in the configuration. |
|
MO: Product Fixture Assignment |
The type of fixture. |
|
MO: Display Style |
The type of display unit. |
|
MO: Main Orientation |
How the product faces the front of the fixture. |
|
MO: Capping Orientation |
The orientation for products that are stacked. |
You can edit the merchandising options if you have the appropriate permissions.
Select a product from the Select Product table.
Select one or more optimization locations from the Merchandising Options table.
Click the Edit icon to access the Edit Merchandising dialog box.
You see the possible options for each of the Merchandising Options that are available for the product you selected. For each option you select the Select check box in order to edit that option. The columns you can edit correspond to the columns that are displayed in the table.
The following three sections providing additional information about product merchandising.
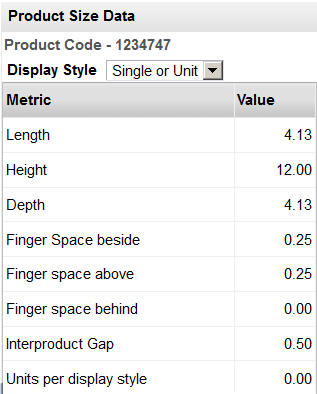
This table, shown in Figure 4-20, displays the sizes of the products for each of the display styles as well as the related spacing data. The data that is displayed depends on the product you select from the Select Product table. The data includes length, height, depth, finger space beside, finger space above, finger space behind, inter-product gap, and units per display style.
Finger space beside refers to the space that is needed by a specific product on the left and right side of each unit.
Finger space above refers to the space that is needed by a specific product between the top of a unit and the bottom of the shelve above it.
Finger space behind refers to the space that is needed by a specific product to the front and to the back of a unit.
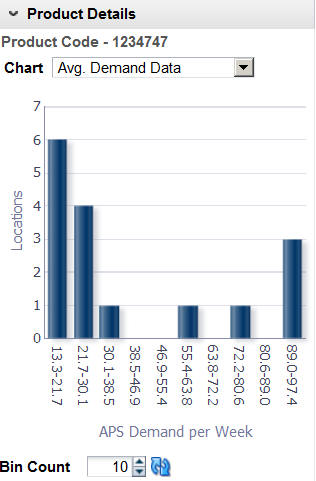
This table, shown in Figure 4-21, describes the overall demand and replenishment data for the selected product. The data displayed is static and is based on the product you select from the Select Product table.
Average Demand Data. The size of the histogram bar represents the number of optimization locations.
Price. The size of the histogram bar represents the number of optimization locations.
Casepack Size. The size of the bar represents the number of optimization locations.
Replenishment Frequency. The size of the histogram bar represents the number of optimization locations.
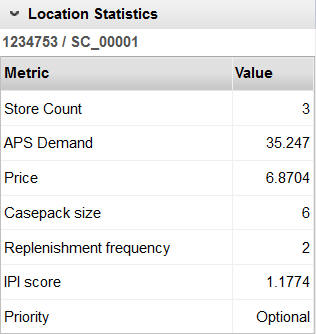
This table, shown in Figure 4-22, describes the user demand and replenishment data for the selected product and optimization location. You can use this information to help in making decisions at the lowest level. The data includes store count, APS demand, price, case pack size, replenishment frequency, Item Performance Index (IPI) score, and priority. The data displayed is based on the product you select from the Select Product table and the location you select from the Merchandising Options table.
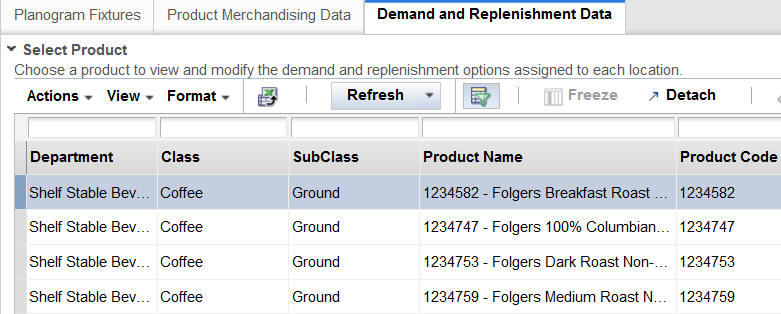
The Demand and Replenishment Data tab lets you refresh the demand and replenishment parameters, make overrides to selected parameters, and understand the replenishment settings and their effects on results. This tab provides a Select Product table that displays all available products and a Demand and Replenishment Options table that displays the replenishment details for the product you select in the list of available products.
The Select Product table lists the available products and includes the following information about each product: Department, Class, Subclass, Product Name, and Product Code. When you select a specific product from this table, the Demand and Replenishment Options table is populated with the replenishment details for the product you select.
Action Menu
The Action menu provides access to two functions: Demand and Replenishment.
Click Demand to refresh all the underlying demand data for all the products in the current run. You see updated data derived from data feeds that occurred after the most recent run was created.
Click Replenishment to refresh all the underlying replenishment data for all the products in the current run. This action overrides any changes you have made to replenishment data.
Refresh Button
The Refresh button provides the same functionality as the Action menu.
Click Demand to refresh all the underlying demand data for all the products in the current run. You see updated data derived from data feeds that occurred after the most recent run was created.
Click Replenishment to refresh all the underlying replenishment data for all the products in the current run. This action overrides any changes you have made to replenishment data.
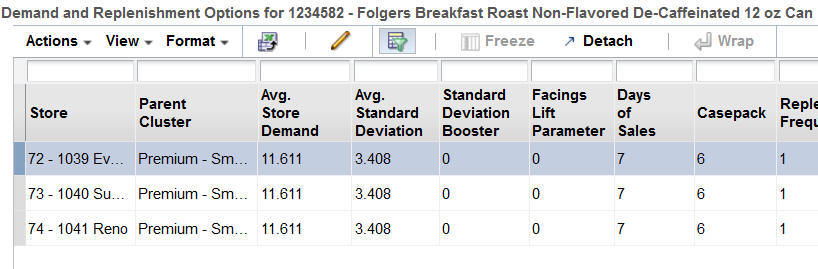
The Demand and Replenishment Options table displays one row for each location that carries the product you select in the Select Product table. Each row contains the aggregated data for all the stores in that optimization location.
The following information is displayed:
Table 4-16 Demand and Replenishment Options Table
| Column Name | Description |
|---|---|
|
Space Cluster |
Optimizations are run at the store level or the space cluster level. A space cluster is an ad hoc group of stores with the same assortment cluster, product list, and current planogram length. |
|
Parent Cluster |
The name of the cluster that the store belongs to. |
|
Average Store Demand |
This is a weekly average. |
|
Average Standard Deviation |
A higher value indicates the need for higher safety stock to meet service levels. |
|
Standard Deviation Booster |
This is calculated across all stores in the optimization location. |
|
Facings Lift Parameter |
The impact of facings on demand. |
|
Days of Sales |
The number of days in a week that are available for store sales. |
|
Casepack |
This is calculated as a weighted average of store casepacks. It is weighed by total adjusted store demand within an optimization location. The number of units in a case. |
|
Replenishment Frequency |
The number of replenishments per shelf per week. |
|
Replenishment Type |
DC/Vendor or Backroom. |
|
Transit Time |
The number of days an order takes to go from the source location to the shelf. |
|
Replenishment Trigger |
Demand-based, target capacity-based, or case pack-based. |
|
Trigger Parameter |
Trigger value for replenishment trigger. |
Editing the Demand and Replenishment Options Table
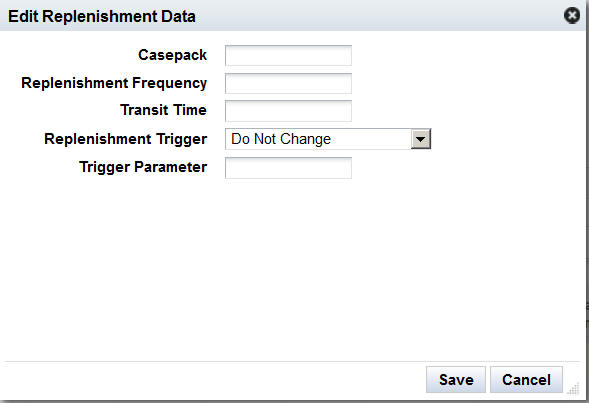
To edit the demand and replenishment data in the table, select the row or rows containing the data you want to edit and then click Edit. You see the following dialog box.
You can edit the following fields. If you leave a field blank, then no changes will be made to that value.
Table 4-17 Edit Demand and Replenishment Data
| Field Name | Description |
|---|---|
|
Casepack |
Value must be greater than zero. |
|
Replenishment Frequency |
Value must be greater than zero. |
|
Transit Time |
Value must be greater than zero. |
|
Replenishment Trigger |
Choose from the following: Do Not Change, Cover Demand, Percent Capacity, Casepack Fit. |
|
Trigger Parameter |
Value must be a percentage greater than zero and less than or equal to 100. |
Click Save when you are finished editing the replenishment data. The data displayed in the Demand and Replenishment Options table is updated. The contextual information is also updated.
The Product Detail chart illustrates the overall demand and replenishment for the selected product. You can select the type of data to display from the drop-down menu: Average Demand Data, Standard Deviation Booster, Facings Lift Parameter, Days of Sales, Casepack Size, Replenishment Frequency, Replenishment Type, Transit Time, Replenishment Trigger, and Trigger Parameter.
The Objectives and Constraints stage is used to modify or set the constraints (business rules) for an optimization run and to display the settings associated with the run. You specify three types of optimization constraints, product level constraints, product group constraints, and planogram constraints. Even though all constraints are ultimately applied at the optimization location level, You generally set or review the data at higher location levels.
In addition, you also pick an objective for the optimization. The objective defines what metric is used as the goal of the optimization.
Once you are satisfied with all the settings in this stage, you can validate a run or submit the run for optimization. The run closes and the optimization list is displayed. When the status for the run is Complete, you can view the results.
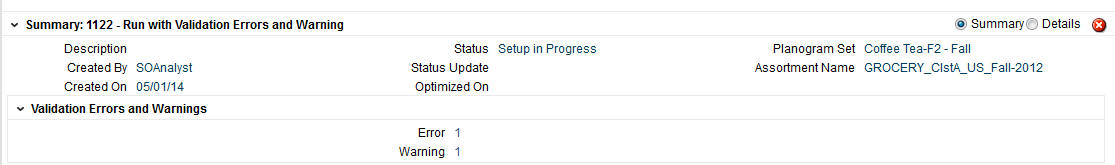
The Summary view, shown in Figure 4-1, provides identifying information for the optimization run.
Table 4-18 Summary Section Fields
| Field | Description |
|---|---|
|
Description |
The name for the run. |
|
Created By |
The user ID of the person who has created the run. |
|
Created On |
The date when the run was created. |
|
Status |
The status of the run. Values include Setup in Progress, Running, Complete, Approved, and Finalized. |
|
Status Update |
The date when the status for the run was last updated. |
|
Optimized On |
The date when the run was last submitted for optimization. |
|
Planogram Set |
The name of the planogram set, which is selected from the Select Planogram Set dialog box. |
|
Assortment Name |
The name of the assortment associated with the planogram set. |
When you select the Summary radio button, you see the following information displayed.
This section contains four panels that display a summary of the settings.
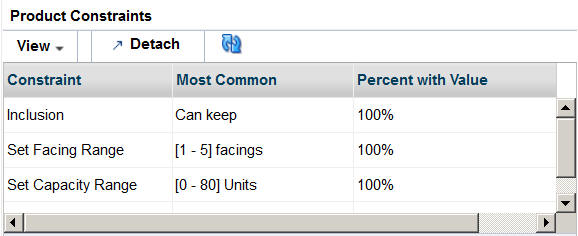
This table, shown in Figure 4-26 lists each product constraint, along with values for the most common value, the percentage with the most common value, and the percentage of optimization locations that have the most common value. The product constraints include Inclusion, Facing Range, Capacity Range, and Elevation Range.
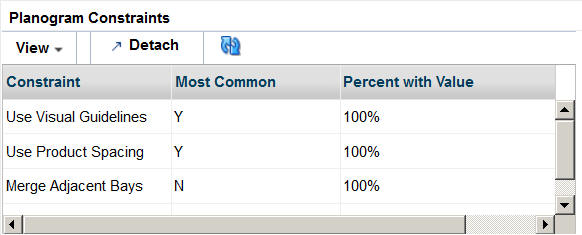
This table, shown in Figure 4-27 lists each planogram constraint, along with values for the most common value and the percentage of optimization locations that have the most common value. The planogram constraints include Use Visual Guidelines, Use Product Spacing, Merge Adjacent Bays, and Set Usable Space.
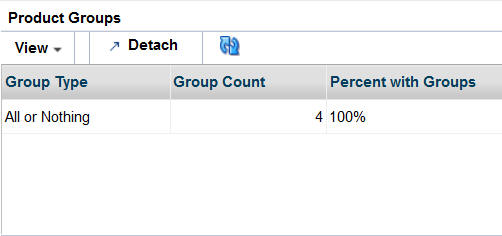
This table, shown in Figure 4-28, lists each type of group that is used, along with values for the total number of product group/optimization location combinations for each group and the number and percentage of optimization location that have a group of that type. The product groups include All or Nothing, Match Facings, Same Shelf, and Choose From. This table does not list product groups created at levels above the optimization location even though those product groups may be inherited by the optimization locations.
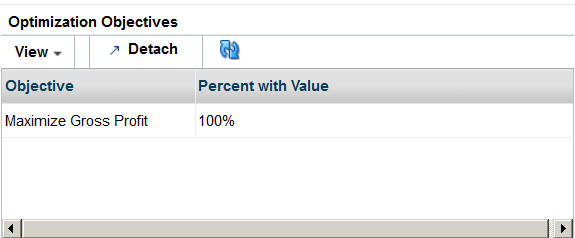
This table, shown in Figure 4-29, lists the objective functions that are being used, along with the number and percentage of optimization locations that use each objective function. The objective functions include Maximize Sales Units, Maximize Sales Values, Maximize Margin Value, Maximize Total Sales/On Hand Value, Maximize Sales Units (Weighted), Maximize Sales Value (Weighted), Maximize Margin Value (Weighted), and Maximize Total Sales Value/On Hand Value (Weighted).
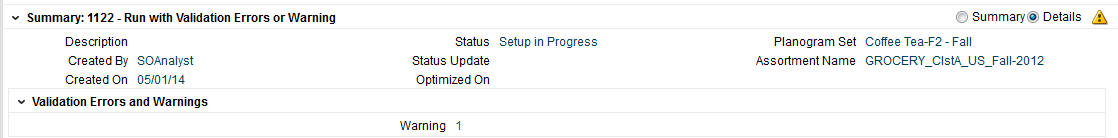
When you select the Details radio button, this section displays. It consists of two tables: Select Locations and Select Products, shown in Figure 4-30 and Figure 4-31. You must select a row from the location tree and a product row in order to display details about your selections in Objectives and Constraints details section.
The Locations table has three levels. When the first level is selected, the product constraints details across all optimization locations are displayed in the Product Constraints table. When the second level is selected, only the product constraints details for the second level location are displayed. When any optimization location is selected, only the product constraint details for the selected optimization location are displayed. In the same way, the product constrains in the Products table are displayed. So product constraint details are fetched after both the location and the product levels are select, location first and product second.
This section is used to specify optimization constraints that define the business rules that determine acceptable virtual planograms. It has five tabs; each tab displays detailed information that you can modify if you created the run.
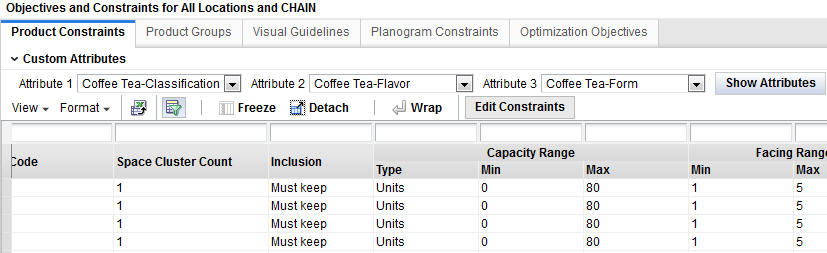
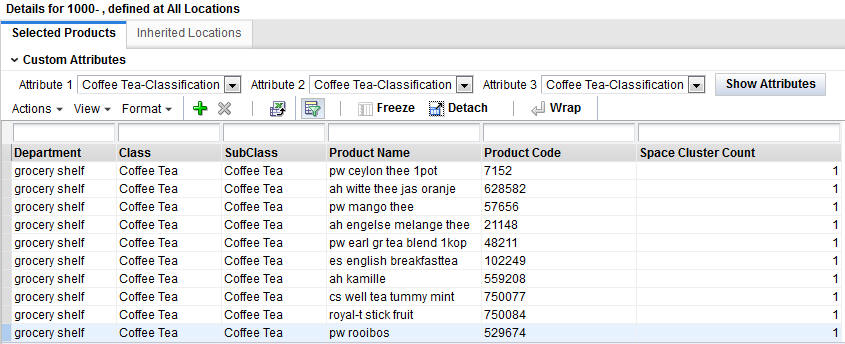
The Product Constraints tab is shown in Figure 4-32. It includes Custom Attributes, which allow the user to select up to three attributes associated with the selected category of products. Select the attributes from the drop-down menus and click Show Attributes to add the attributes to the Product Constraints table.
For each product, it defines the current product constraints, as listed in Table 4-19.
Table 4-19 Product Constraints
| Column | Description |
|---|---|
|
Department |
Merchandise/product hierarchy node. |
|
Class |
Merchandise/product hierarchy node. |
|
Subclass |
Merchandise/product hierarchy node. |
|
Product Name |
Product identification. |
|
Product Code |
External product code. |
|
Store or Space Cluster Count |
Number of stores/space clusters that carry the product. |
|
Inclusion |
Supported inclusion values: Must keep (product must not be dropped), Can keep (product can be dropped), and Do not include (product must not be included). |
|
Capacity Range |
Type, minimum, and maximum value for capacity range. |
|
Facing Range |
Minimum and maximum value for facing range. |
|
Elevation Range |
Minimum and maximum value for elevation range. |
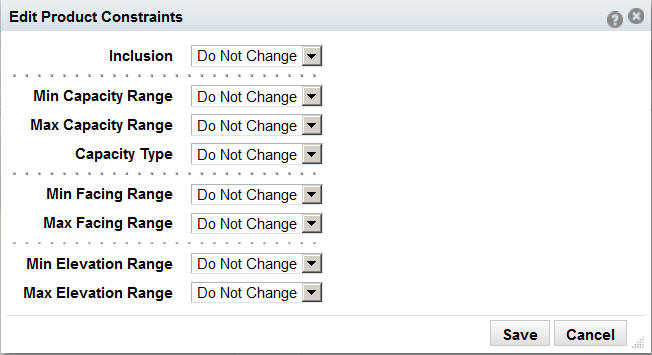
Click the Edit Constraints button to access the Edit Product Constraints dialog box, shown in Figure 4-33. After selecting one or more rows, you can edit the constraints if you created the run and if the run has not been submitted.
Use the drop-down lists, which contain the valid options for each constraint, to change the settings for any constraints, as appropriate. After you complete your edits, select Save from the Action button. The system validates the changes you make and adjusts other settings as necessary. If you enter minimum and maximum values that are inconsistent, you will see an error message and must make changes before you can successfully save your edits.
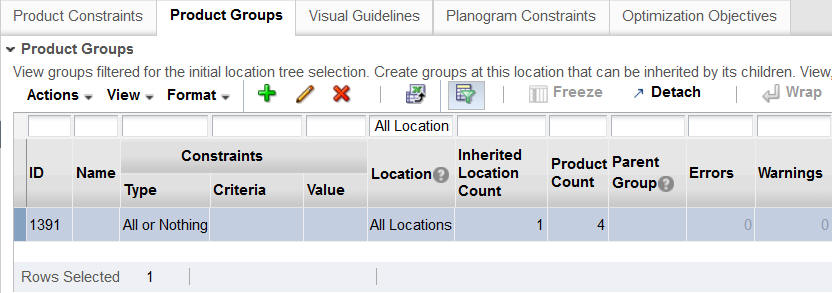
The Product Groups tab, shown in Figure 4-34, is used to define parent groups, which, when defined at a location node above the optimization location, can be inherited by the optimization locations that are the children of the parent location node.
You can add, edit, or delete product groups as well as add products to and delete products from product groups. Inherited groups can also be added or deleted.
Table 4-20 Product Groups
| Column | Description |
|---|---|
|
ID |
Unique numerical identification for product group. |
|
Name |
Name of product group. |
|
Location |
Store or space cluster for product group. |
|
Constraint Type |
Values are: All or Nothing, Match Facings, Same Shelf, and Choose From. |
|
Constraint Criteria |
If Type is Choose From, values are: At Least, At Most, and Exactly. |
|
Constraint Value |
If Type is Choose From, then a numerical value is required here. |
|
Inherited Location Count |
If the product group belong to either a Level 1 or Level 2 optimization location, the product group can be copied to or referenced by Level 3 optimization locations. This column shows count of such optimization locations. |
|
Product Count |
The number of products in the product group. |
|
Parent Group |
If this product group is created by copying or referencing an existing product group of a higher level (1 or 2) then this column shows the ID of parent product group. |
|
Errors |
Number of errors for product group. |
|
Warnings |
Number of warnings for product group. |
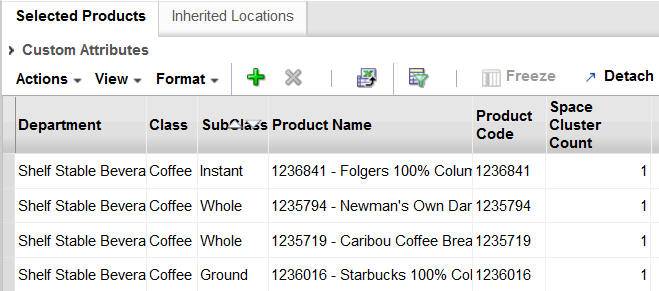
Selected Products
Use this section, shown in Figure 4-35 to add or remove products from a selected product group.
You can see and use the product attributes by accessing the Custom Attributes dialog box shown in Figure 4-36 when you are creating product groups. When you make a selection, the Product Groups table is populated.
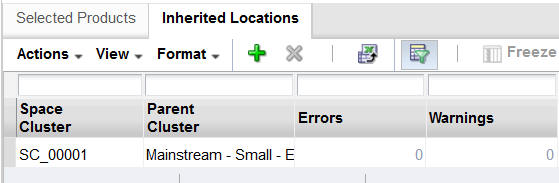
Inherited Locations
Use this section, shown in Figure 4-37, to add or remove inherited locations.
Visual Guidelines are used to provide attribute-based vertical and horizontal blocking when placing products on a shelf fixture planogram. You are allowed up to four levels for the blocking criteria. The visual guidelines are created at the optimization location level. Each optimization can have only one visual guideline. The sorting attributes are defined at the top level and are applied across all of the levels below the top level. You can add, delete, and edit the visual guidelines.
Blocking is defined as horizontal or vertical. Vertical is the default. You can specify primary and secondary blocking criteria. The secondary blocking is optional. If the primary blocking is vertical then the secondary blocking is horizontal; if the primary blocking is horizontal then the secondary blocking is vertical.
Primary and secondary blocking can have up to two attributes each. Each attribute for a specific blocking strategy is defined in the same way, horizontal or vertical. A sequence number is assigned to each attribute value for each blocking level. The sequence numbers determine the order of the blocks. In ascending order, the blocks are positioned from top to bottom (vertical) and left to right (horizontal). When two are blocks are assigned the same sequence number, the blocks are combined (merged).
Example 1:
Primary blocking: Vertical blocking by brand.
Merge blocks: Brand A, Brand B, and Brand C
Additional primary blocking: Vertical blocking by type.
Secondary blocking: Horizontal blocking by size for all vertical blocks.
Example 2:
Primary blocking: Horizontal blocking by size.
Additional primary blocking: Horizontal blocking by flavor.
Secondary blocking: Vertical blocking by brand for all vertical blocks.
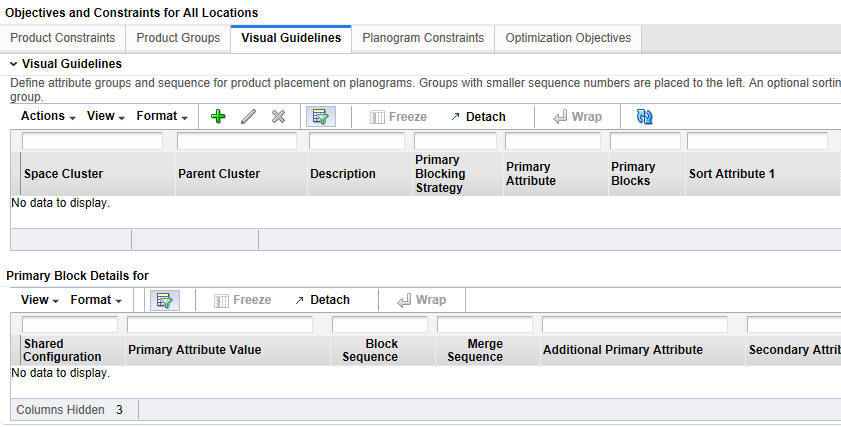
Visual Guidelines Table
The Visual Guidelines table provides information about each visual guidelines row.
The columns for this table are described in Table 4-21.
Table 4-21 Visual Guidelines
| Column | Description |
|---|---|
|
Space Cluster/Store |
The name of the optimization location. |
|
Parent Cluster |
The name of the parent cluster for the optimization location. |
|
Description |
The name of the visual guideline. |
|
Primary Blocking Strategy |
Vertical or horizontal. |
|
Primary Attribute |
The product attribute used. |
|
Primary Blocks |
The first block used for the configuration |
|
Sort Attribute 1 |
The attribute you select that is used to determine the product display order. |
|
Sort Attribute 2 |
The attribute you select that is used to determine the product display order. |
|
Sort Attribute 3 |
The attribute you select that is used to determine the product display order. |
The Primary Block Details table provides additional information.
Table 4-22 Primary Block Details
| Column | Description |
|---|---|
|
Shared Configuration |
Indicate whether or not two attributes share the same configuration. |
|
Primary Attribute Value |
Primary attribute. |
|
Block Sequence |
Defines the block and the sequence for that block. |
|
Merge Sequence |
Blocks with the same merge value are combined. |
|
Additional Primary Attribute |
Additional primary attribute. |
|
Secondary Attribute |
Secondary attribute. |
|
Additional Secondary Attribute |
Additional secondary attribute. |
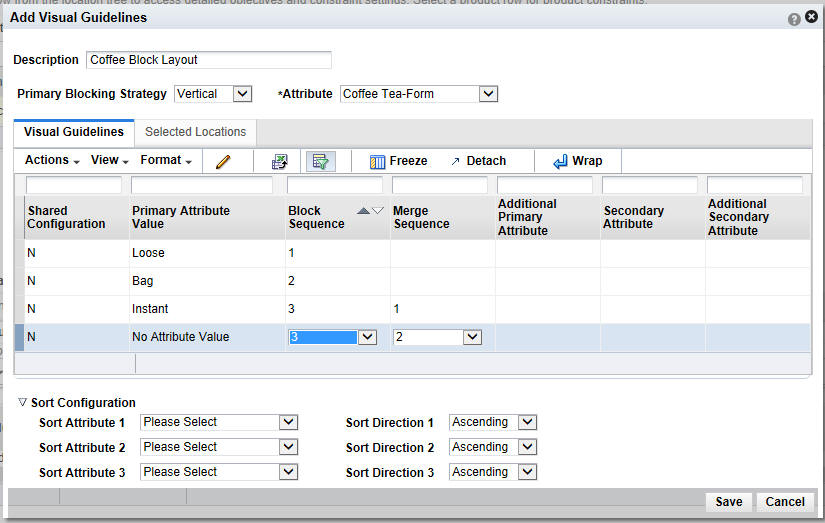
Adding Visual Guidelines
You can add visual guidelines through the Add Visual Guidelines dialog box. You access this by selecting the Detail radio button and clicking the Add icon.
To add visual guidelines, complete the following steps:
Enter the description of the visual guideline in the Description text box.
Select the primary blocking strategy - horizontal or vertical - from the Primary Blocking Strategy drop-down list.
Select the attribute to use for blocking from the Attribute drop-down list. This populates the table with the attribute values. At this point, the values for all sequences are assigned a default value of 1.
Define the attribute sequence number for each attribute by selecting a value from the drop-down list in the Block Sequence column. This defines the block and the sequence for the block. To define merged blocks, assign the same value to each attribute to be merged.
Optionally, define the merge sequence value by selecting a value from the drop-down list in the Merge Sequence column. this functionality is only enabled if you have assigned the same sequence number to two of the primary blocks.
Define up to three sort attributes and the sort direction, ascending or descending, for each.
Choose locations from Selected Locations.
Optionally, prior to saving the configuration, you can configure the primary block. To do this, select the attribute value in the table and click the Pencil icon. You see the Primary Block Configuration dialog box.
After the primary blocking strategy and attribute are defined, the primary block can be configured. When primary blocking is vertical, then horizontal blocking is specified for each primary block. When primary blocking is horizontal, then vertical blocking is specified for each primary block.
When two attributes have the same sequence number, they share the same configuration. If you change one of the attribute's block sequence numbers to an unassigned number, it still maintains that configuration. If you change the attribute's block sequence number to an assigned number, then it takes the new configuration of the block it joins.
The Use Shared Configuration check box functions is different ways, depending on the following:
When the primary blocking strategy is vertical, the check box is enabled. Check this box if you want all of the primary blocks to share the same secondary and additional blocking. If you do not check this box, then each primary block is configured separately.
When the primary blocking strategy is horizontal, the check box is disabled. When two or more attributes share the same sequence number, all the products that have these attributes are combined.
To configure Additional Primary Blocking, select the attribute from the drop-down list. The table populates with the attribute values. All sequence numbers default to a value of 1. If you select None for the attribute, then blocking at this level is disabled.
Define the attribute sequence for each attribute value by selecting the sequence number from the drop-down list in Block Sequence. If you assign the same sequence number to more than one attribute, then all the products with these attributes are combined.
To configure Secondary Blocking, select the attribute from the drop-down list. The table populates with the attribute values. All sequence numbers default to a value of 1. If you select None for the attribute, then blocking at this level is disabled.
Define the attribute sequence for each attribute value by selecting the sequence number from the drop-down list in Block Sequence. If you assign the same sequence number to more than one attribute, then all the products with these attributes are combined.
You can only configure Additional Secondary Attributes if you have configured Secondary Blocking. To configure Additional Secondary Attributes, select the attribute from the drop-down list. The table populates with the attribute values. All sequence numbers default to a value of 1. If you select None for the attribute, then blocking at this level is disabled.
Define the attribute sequence for each attribute value by selecting the sequence number from the drop-down list in Block Sequence. If you assign the same sequence number to more than one attribute, then all the products with these attributes are combined.
Click OK. The Add Visual Guidelines table is updated with the selected attributes.
Click Save to save the configuration. This overwrites any existing visual guidelines configuration for the selected location.
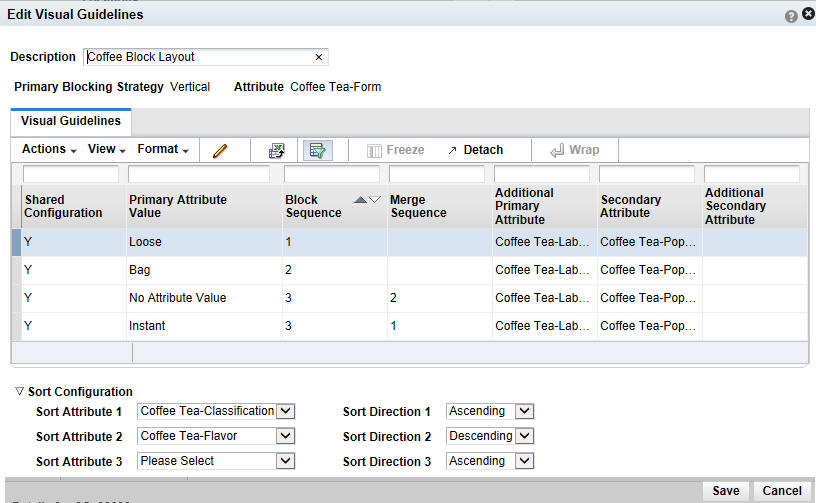
Editing Visual Guidelines
You can modify the characteristics of a visual guideline through the Edit Visual Guidelines dialog box. Select a row to indicate which guideline you want to edit and click the Pencil icon. You see the Edit Visual Guidelines dialog box.
You can modify any values except the Primary Blocking Strategy and the Primary Attributes following same approach you use to create those values. Once you have completed making changes, click Save to save your changes and update the Visual Guidelines table. You can click the Cancel button to cancel the edits.
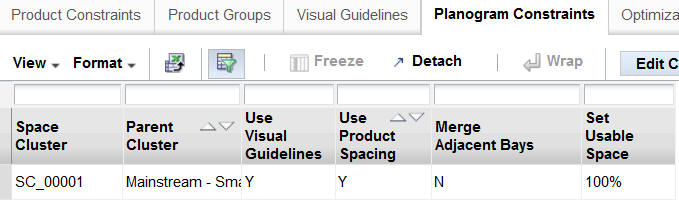
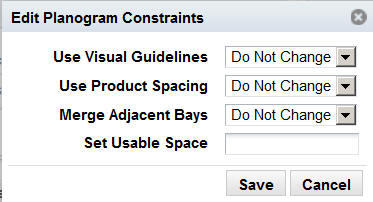
The Planogram Constraints tab, shown in Figure 4-42, displays a list of optimization locations along with values for four constraints: Use Visual Guidelines, Use Product Spacing, Merge Adjacent Bays, and Set Usable Space.
You can edit these constraints by selecting the row or rows whose settings you want to change and then click Edit Constraints. You see the dialog box shown in Figure 4-43.
Use the drop-down menus to select a new setting. For Set Usable Space, you must enter a value between 1% and 100%. Select Do Not Change if you do not want to change a particular constraint. Click Save to save your changes.
Table 4-23 Planogram Constraints
| Column | Description |
|---|---|
|
Space Cluster/Store |
The name of the optimization location. |
|
Parent Cluster |
The name of the parent cluster for the optimization location. |
|
Use Visual Guidelines |
Indicates whether or not to use visual guidelines. Values are Yes and No. |
|
Use Product Spacing |
Indicates whether or not to use product spacing. Values are Yes and No. |
|
Merge Adjacent Bays |
Indicates whether or not to merge adjacent bays. Values are Yes and No. The optimization process provides the option of merging adjacent bays. |
|
Set Usable Space |
A value between 1 and 100 that indicates the usable space. available to the optimization process. A values less than 100 forces the optimization process to leave some fixture space unused for aesthetic or other reasons. |
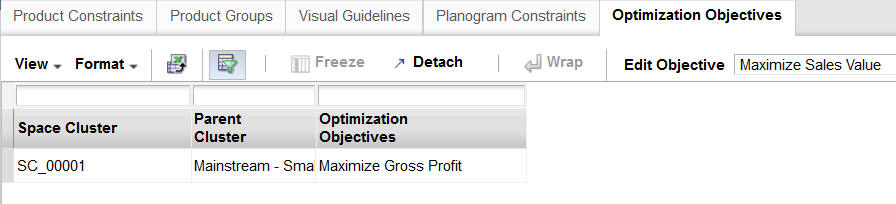
The Optimization Objectives table, shown in Figure 4-44, includes:
Maximize Sales Units
Maximize Sales Value
Maximize Gross Profit
Maximize Total Sales Value/On Hand Value
Maximize Sales Units (Weighted)
Maximize Sales Value (Weighted)
Maximize Gross Profit (Weighted)
Maximize total Sales Value/On Hand Value (Weighted)
Weighted objectives are weighed using the IPI values provided by Category Manager.
Select one or more rows in order to modify specific objectives using the Apply button.
Each of the five tabs within the Objectives and Constraints stage have associated contextual information. The information is displayed based on the selections you make in the location hierarchy table.
The Product Constraints information includes:
Constraint Values, which displays a list of the constraints and associated metrics
Constraint Charts, which provide a summary for each constraint
Product Details
Product Groups information includes:
Product Group Summary, which displays counts for the group types
Product Lookup, which shows, for a given product, the associated group ID, group name, and group type
Visual Guidelines information includes:
Visual Guidelines Summary, which includes an Attributes histogram for each attribute, and Attributes Group histogram
Attributes Lookup, which provides details about product counts for individual attributes
Visual Guidelines Detail, which analyzes attribute values and product counts by sequence number
Planogram Constraints information includes:
Constraint Charts, which provide summaries for each constraint
Planogram Space, which can help you understand the relationship between the available space and the set of products.
Optimization Objectives information includes:
Optimization Objectives
Product Details, which includes details for IPI values, price, and margin percentage
After the optimization run is complete, the results are displayed in the Results and Analysis stage. You can see summary performance data and view planograms for the optimization runs. In this stage, you can make a limited number of overrides to the table view or the planogram view. Substantive changes require that you re-configure settings and complete another optimization run.
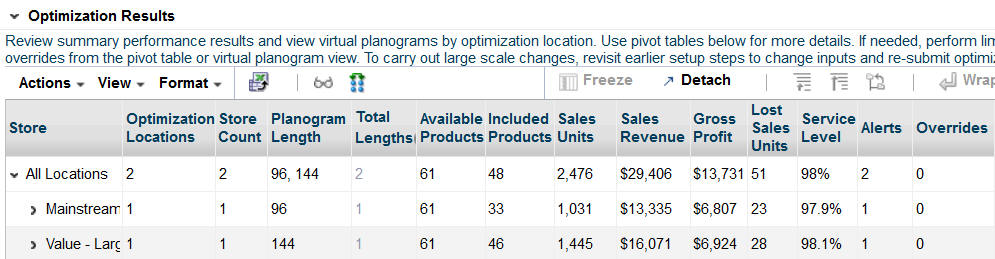
The results are displayed in two tables. The upper table displays the total optimized performance. The data is summed for all the stores in a space cluster. You can access the virtual planogram by clicking the View Planogram icon. The lower table displays detailed results with product-level data. The data you see is the average for store numbers, not totals for space clusters.
You can drop products from the lower table for one or more locations; these dropped products are listed in a table.
Alerts are also provided, along with supporting metrics.
Actions To Take
From the Results and Analysis stage, you can:
Revisit earlier stages in order to make changes to various settings and then re-submit the optimization. You can also validate a run in order to look for constraints that produce errors or warnings. See Validation for more details.
Copy and save the run using the Save As functionality in the Action menu. Use the copy to make changes and then compare the results.
Approve the run and make it available for assortment analysis.
Leave the run in the optimization list without taking any actions. You cannot delete the run; you must be in Optimization List in order to delete a run.
The Optimization Results table is shown in Figure 4-45.
You can toggle between a tree view and a table view to examine the results. The tree view displays the results hierarchically. The results are either a sum of lower level values, an average of lower level values, or a distinct count.
Table 4-25 Optimization Results
| Field | Description |
|---|---|
|
Space Cluster/Store |
The name of the optimization location: Store or Space Cluster. |
|
Optimization Locations |
The number of optimization locations. |
|
Store Count |
The number of distinct stores for a given level. |
|
Planogram Length |
A comma-separated list of selected planogram lengths |
|
Total Lengths |
The total count of planogram lengths for which the optimization was run. If more than one total is displayed, you can click the number to access a popup window. You can modify selected planogram lengths for the specified optimization location. |
|
Available Products |
A count of the available products for a given space cluster level. |
|
Included Products |
A count of the included products in an assortment for a given space cluster level. |
|
Sales Units |
The value for sales units in the optimization results. This value is aggregated at higher levels by summing the values for the lower levels. |
|
Sales Value |
The value for sales. This value is aggregated at higher levels by summing the values for the lower levels. |
|
Margin Value |
The value for margin. This value is aggregated at higher levels by summing the values for the lower levels. |
|
Lost Sales Units |
The value for lost sales units. This value is aggregated at higher levels by summing the values for the lower levels. |
|
Service Level |
The value for the service level. The value is aggregated at higher levels by averaging the values for the lower levels. |
|
Alerts |
The number of alerts. This value is aggregated at higher levels by summing the values for the lower levels. |
|
Overrides |
The number of user overrides. This value is aggregated at higher levels by summing the values for the lower levels. |
The Included Products table lists metrics at various levels of aggregation. You can select specific products from the table and click the Delete button in order to remove them from the results. You see a list of the products you want to delete and are prompted to confirm the action.
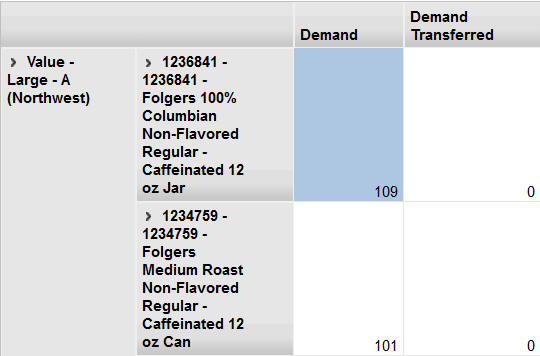
The Dropped Products table, shown in Figure 4-46, lists all the products that have been dropped per optimization process rules including but not limited to user override action or if the Inclusion Product constraint is set to Do Not Include.
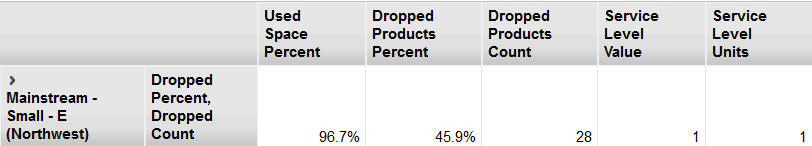
The Alerts table, in Figure 4-47, shows the metrics provided for alerts.
The Used Space Percent can help you see if there is too much open space.
The Dropped Products Percent and Dropped Products Count can help you see if too many products were eliminated from an assortment.
The Service Level Value and Service Level Units can help you understand stockout levels.
You can configure the following parameters to control the thresholds for the alerts.
Table 4-26 Alerts Parameters
| Parameter Name | Description |
|---|---|
|
ALRT_LESS_THAN_PCT_USED_SPACE |
An alert will be triggered if the run optimization results use less space than the value specified by this global parameter. |
|
ALRT_LESS_THAN_SERVICE_LEVEL_AMT |
An alert will be triggered if the run optimization results have a sales service level lower than he value specified by this global parameter. |
|
ALRT_LESS_THAN_SERVICE_LEVEL_QTY |
An alert will be triggered if the run optimization results have a quantity service level lower than he value specified by this global parameter. |
|
ALRT_MORE_THAN_CNT_PRODUCT_DROPPED |
An alert will be triggered if the run optimization results dropped more products than he value specified by this global parameter. |
|
ALRT_MORE_THAN_PCT_PRODUCT_DROPPED |
An alert will be triggered if the run optimization results dropped a percentage of product higher than he value specified by this global parameter. |
The Results and Analysis stage provides summary information about sales units, sales value, service level, and included products.
Results Summary
Inclusion Summary
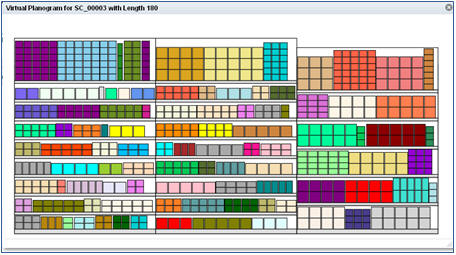
When you click the View Results icon, you see a pop-up window displaying a planogram your run. Depending on your permissions, you can edit the planogram.
Selection View
Left-click a facing to highlight it.
Fixture Details
When you mouse over a fixture, the following information is displayed: fixture type, length, depth, and elevation.
Product Details
When you mouse over a product, the following information is displayed: product name, product code, facing count, facing ID, display style, main orientation, dimensions, stacking option, and elevation. When applicable, visual guideline information such as definition, attribute value, and sorting attribute data is shown.
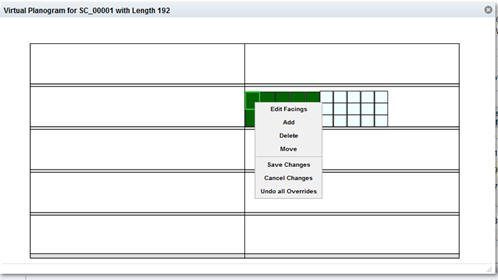
When you right-click a facing to select it, you have access to the following actions: editing facings, add, delete, move, save changes, cancel changes, and undo all changes.
Use this action to delete a product. Deleted products can be added back using the Add Products action.
When you select this action, you see a list of product codes for dropped products from which to choose. The product you select is restored to its original position and with the same number of facings as when it was dropped.
You can validate your constraint settings within each stage of Execute Space Optimization by using the Validate option in the Action menu. Validation lets you identify problems with potential data or constraints prior to initiating a complete optimization run. The Validate functionality is enabled after you create a run, provide it with a name, and populate it with a POG set and a group of stores or clusters. The Validate functionality is disabled for a run once it has a status of Finalized or Approved.
The validation process provides you with a quick way to determine if an optimization problem has any obvious incorrect parameters before you submit a run and request an optimization result. The process is not designed to find all possible errors or warnings, as some infeasible scenarios are only identifiable by the optimization process itself. However, the validation does provide you with the opportunity to find potential issues, and to then navigate back to Fixture and Product Data or Objective and Constraints stage in order to address the setup issues. This can help you avoid submitting a run for optimization and then discover that changes are required.
Validation identifies:
Errors. Identifies constraints that will prevent an optimization from completing successfully. You must correct all errors before you execute the run.
Warnings. Identifies constraints that you may want to review and possibly change.
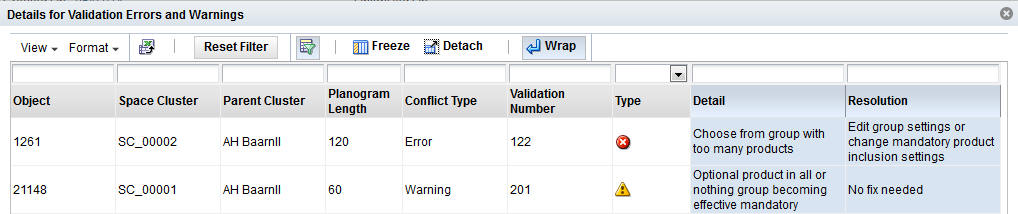
If the validation you request finds errors or warnings, you will see error icon in the Summary area of the stage you are in. Some validation checks only apply to shelf fixtures while others (121, 122, 132, 201, 202 and 236) apply to both shelves and pegboards. To view the details, expand the Validation Errors and Warning section below the Summary section. Click each link in order to display the Details for Validation Errors and Warnings dialog box, which contains information explaining the error or warning that can help you address the problem.
Warning are informational and indicate that optional items will be handled according to the constraints you set. Here is a list of possible warnings and suggested optional actions to address the warnings.
Table 4-27 Warnings and Suggested Actions
| Alert # | Warning Description | Suggested Optional Action |
|---|---|---|
|
201 |
Optional product in all or nothing group becoming effective mandatory. |
No fix needed. |
|
202 |
Optional choose from product becoming effective mandatory. |
No fix needed. |
|
209 |
Optional product becoming effective drop. |
No fix needed. |
|
211 |
Optional product too wide. |
Reduce the minimum number of facings or change the elevation or orientation. |
|
212 |
Optional product too tall. |
Change the elevation or orientation. |
|
213 |
Optional product lacks shelf. |
Change the elevation. |
|
232 |
No common set of shelves. |
Edit the group settings or elevation ranges. |
|
236 |
No common facing value |
Edit the group settings or facing ranges. |
Once you have made corrections to the errors, you must run Validate again in order to make sure that all the errors have been corrected. Here is a list of possible errors and recommended corrections.
Table 4-28 Errors and Recommended Solutions
| Alert # | Error Description | Recommended Solution |
|---|---|---|
|
101 |
Mandatory product too wide. |
Reduce minimum number of facings, change product orientation, or make the product optional. |
|
102 |
Mandatory product too tall. |
Change the product orientation or make the product optional. |
|
103 |
Mandatory product lacks shelf. |
Change the elevation setting or make the product optional. |
|
106 |
Mandatory products combined width too wide for shelf. |
Reduce the minimum facings or make some of the products optional. |
|
107 |
Mandatory products combined area too large for pegboard. |
Reduce the minimum facings or make some of the products optional. |
|
121 |
Choose from group lacking products. |
Edit the group settings or add products. |
|
122 |
Choose from group with too many products. |
Edit the group settings or change the mandatory product inclusion settings. |
|
127 |
Same shelf group lacks shelf. |
Edit group settings or change the mandatory product elevation settings. |
|
128 |
Same shelf group is too wide. |
Edit the group settings or change the mandatory product elevation or inclusion settings. |
|
129 |
Same shelf group is too tall. |
Edit the group settings or change the mandatory product elevation or inclusion settings. |
|
132 |
Match facing group without match. |
Edit the group settings or change the mandatory product inclusion settings. |
|
TBD |
Optional product conflict. |
Remove the product from multiple groups or edit the group settings. |
Once all errors are corrected, you can submit the optimization run.