| Oracle® Pulse for the Managed Cloud User's Guide Release 4.0 for all platforms E27009-01 |
|
|
PDF · Mobi · ePub |
| Oracle® Pulse for the Managed Cloud User's Guide Release 4.0 for all platforms E27009-01 |
|
|
PDF · Mobi · ePub |
The Service Dashboard shows key performance indicators for the service you have selected.
The Service Dashboard shows key performance indicators for the service you have selected.
The Overview screen, shown by default, provides a summary of service availability (including any outages) and historical storage usage. Key indicators include your usage and entitlements for both refreshes and backups, under the Refresh and Backups options. Use these options to track consumption versus entitlement of both your backups and refreshes and, if necessary, request more. The Recommendations option shows recommendations that have been implemented for this service and those that have been rejected. It also indicates why pending recommendations are necessary and the possible consequences if they are not implemented.
If BTM has been set up, the Transactions option is displayed. You can see the average transaction performance over the last 24 hours, and compare this performance to the 30 day average and to the lower threshold value. You can also compare this value with the transaction performance 7 days ago. If you have the corresponding My Oracle Support privileges, you can also view service requests (SRs) reports under Incidents and requests for change (RFCs) reports under Changes.
Note:
As SRs are often logged without reference to the service or environment, the customer level reports, available on the Customer Dashboard, provide the most complete picture of SRs for your organization.Associating all SRs logged for your organization with the correct service and environment will result in more complete SR reports at the service and environment levels.
Finally, use the Other option to request more information about the services listed, such as Additional Backup or Additional VPN.
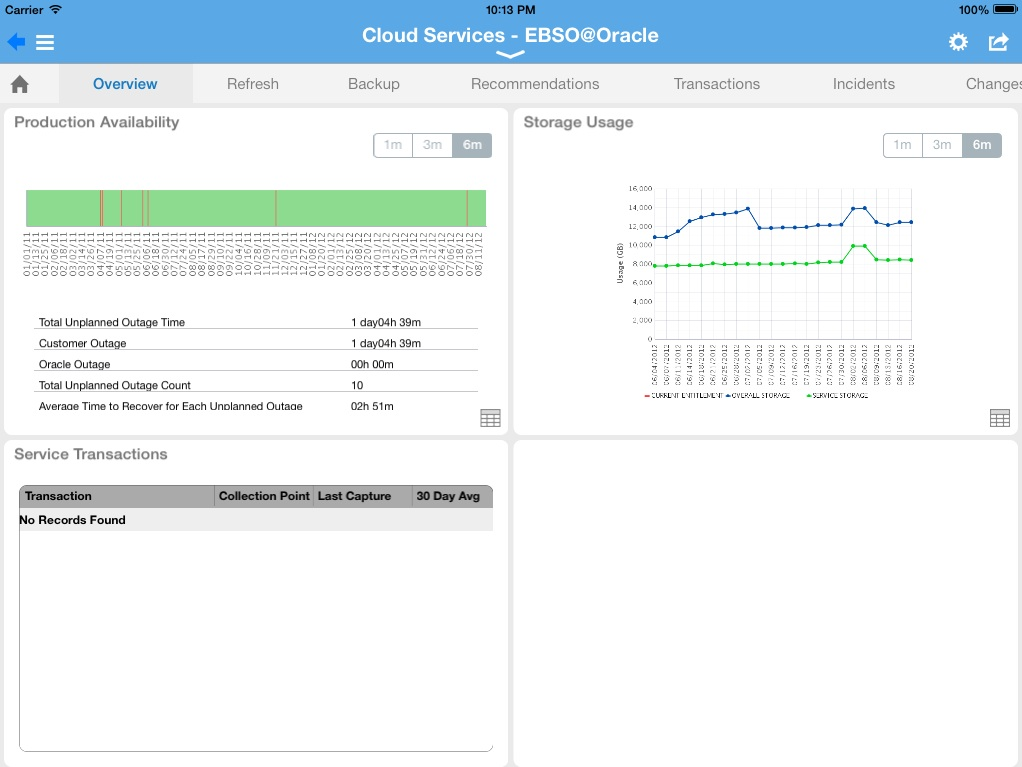
The Overview screen, shown by default, provides a summary of service availability (including any outages), performance and trending for critical business transactions, and historical storage usage.
View any of these widgets on the Service Dashboard Overview:
Double tap any of the widgets to expand to full screen mode. Toggle between the chart view and the data view using the chart and table symbols respectively in the bottom right corner of the widget.
Scroll up to see any hidden widgets and the table of environment records for this service at the bottom of the screen. Environment records show type, availability, and go live dates for all environments associated with this service. Tap any environment record to open the Environment Dashboard.
This widget shows the production availability of this service for the selected time interval as well as an analysis of outages. It provides a basis for investigating any outages, showing the outage cause and identifying delays in restoration of service. Availability is calculated based on complete outages and does not include service interruptions.
Chart View: The chart view shows one vertical red line for each day that had at least one outage, regardless of the number of outages or duration of outage(s).
Data View: The data view shows all outages for this service for the selected time interval. It identifies the environment affected as well as the outage duration and category. The number of unplanned outages is displayed, with the duration of outages for which Oracle was responsible and for which your organization is responsible clearly differentiated. Additionally, the average time to recover from any outage is listed.
For each environment, the table lists the SR number and outage type and category. It also lists the outage start and end times, the time to restore the outage, and problem summary.
This widget shows records of all monitored transactions for the selected service. Tap the Transactions option on the navigation bar to see the full transactions table for this service.
Transaction response times give a sense of the performance of your services and environments and can indicate potential or actual issues. Your Oracle Service Delivery Manager (SDM) can work with you to identify these transactions and set up monitoring.
Note:
Where Business Transaction Monitoring (BTM) has been implemented, the Service Transactions widget displays populated transactions reports.You cannot flip the Service Transactions widget.
One or more beacons measure the response time of each monitored transaction. You can view the last time data was collected from the beacon(s) and compare the current value with the 30 day average.
Each transaction record shows:
| Field | Description |
|---|---|
| Transaction Name | Name of the transaction being monitored |
| Collection Point | Name of the beacon(s) from which data is collected as part of monitoring |
| Last Collection | Time of the last data collection from the beacon(s) |
| 30 Day Average | Average transaction time over the last 30 days |
This widget shows the storage used by each environment for the selected service. Your storage entitlement is usually allocated as needed across all environments. The Storage Usage chart can be useful in identifying environments that are consuming a disproportionate amount of storage.
Chart View: The chart view shows the entitlement, the total usage for all services and environments and the storage usage, for the selected service.
Data View: The data view lists the storage used by each environment.
Tap Refresh on the Service Dashboard to see the following information over the selected time interval, in the chart:
Consumed Entitled Refreshes shows the number of refreshes used for environments associated with this service, from your refresh entitlement in the time interval selected. Your refresh entitlement includes your refresh allowance for environments during implementation and production phases. It also includes any additional refreshes that you have purchased. This information is calculated and maintained automatically. If there are any discrepancies, contact your Oracle service delivery manager (SDM).
Consumed Purchased Refreshes shows the number of additional purchased refreshes used for environments associated with this service, in the time interval selected.
Overage shows the number of refreshes, if any, that were used for environments associated with this service, in excess of your entitled and purchased refreshes.
The table tracks your refresh consumption for each of the last seven months as follows:
Consumed shows the number of refreshes that this service has consumed in each month.
Entitled shows the number of refreshes this service was entitled to consume in each month.
Purchased shows the number of refreshes that were purchased in this month.
Overage shows the number of consumed refreshes that exceeded the service's entitled and purchased refreshes combined in each month.
You also have the option to request refreshes by e-mail.
From the Other Actions in the top right select Request Refresh then submit your request.
Note:
This option is available only on iPad.If you require additional backups but this option is not available, log an SR. Your SDM can provide more information about the process.
Tap the Recommendations option on the navigation bar to see recommended changes across all environments for this service.
Recommendations are actions that you can choose to take to improve performance, security, or other aspects of an environment. Drawn directly from a Managed Cloud Services repository of optimal configurations, recommendations are generated as part of periodic maintenance on environments.
You can filter the recommendations listed by time interval and by type. Tap the time interval, such as year to date (YTD), then select the recommendation type from the list:
Current - These recommendations have been approved by a planner and presented to you in an RFC. If approved, the RFC will be applied to the named environment.
Implemented - These recommendations have been applied to the named environment.
Rejected - These recommendations have been presented in RFCs but have been rejected and therefore were not applied to the named environment.
The following information is displayed for each recommendation:
| Column Name | Description |
|---|---|
| Recommended On | The date on which the recommendation was presented to you. |
| Category | One of the following recommendation category:
|
| Environment | The named environment to which this recommendation applies |
| RFC | The request for change (RFC) related to this recommendation, if any. |
Tap the Transactions option on the navigation bar to see the full transactions table for the selected service.
Transaction response times give a sense of the performance of your services and environments and can indicate potential or actual issues. Your Oracle Service Delivery Manager (SDM) can work with you to identify these transactions and set up monitoring.
You can also review the historical performance of any transaction using the transaction record.
In both chart and data views, select the date from which transaction performance will be measured using the date picker. (This date must be at least 24 hours earlier than the current date.) Then select one of the following time intervals:
24 hours: Shows the average of all data collections over 24 hours from the date selected, compared to the historical median and lower threshold of acceptable performance.
7 days: Shows the average of all hourly collections over 7 days from the date selected, compared to the historical median and lower threshold of acceptable performance.
30 days: Shows the average of all daily collections over 30 days from the date selected, compared to the historical median and lower threshold of acceptable performance.
The chart and data views are populated with data for the time interval from the date selected.
Chart View: The chart view shows the average of all data collections over the time interval from the date selected, compared to the historical median and lower threshold of acceptable performance.
Data View: The data view lists the averagesof all data collections over the time interval from the date selected, compared to the historical median and lower threshold of acceptable performance.
Note:
The Transactions option is displayed on the navigation bar only for services where business transaction monitoring (BTM) has been implemented.If BTM has not been implemented, the Transactions screen is not displayed.
Your Oracle Service Delivery Manager (SDM) can work with you to identify these transactions and set up monitoring.
Each transaction record shows the last data collection date and the data collection point(s). You can compare the current value with the 30 day average and with the lower threshold value for this transaction.
Each record displays:
| Field | Description |
|---|---|
| Transaction Name | Name of the transaction being monitored |
| Collection Point | Name of the beacon(s) from which data is collected as part of monitoring |
| Last Collection | Time of the last data collection from the beacon(s) |
| 30 Day Average | Average transaction time over the last 30 days |
| Threshold | Lowest acceptable performance threshold for this transaction |
Tap the Incidents option on the navigation bar to see service request (SR) reports for this service.
SRs are created and maintained in My Oracle Support (MOS). All SR information in Oracle Pulse is drawn from the MOS database.
Customer level incident reports provide the most complete picture of your organization's SRs because many SRs are logged without reference to a service or environment. You can improve the accuracy of service level and environment level reports by ensuring that each SR logged for your organization is associated with a service or environment.
View any of these widgets on the Service Dashboard Incidents screen:
Double tap any of the widgets to expand to full screen mode. Toggle between the chart view and the data view using the chart and table symbols respectively in the bottom right corner of the widget.
Scroll up to see any hidden widgets and the table of incident records for this service at the bottom of the screen. You can also see individual incident records listed at the bottom of the screen. Tap any record to see the incident details.
Created versus Closed Incidents
This widget shows the rate of SR closure for this service.
Chart View: The chart view compares the number of SRs created with the number closed for each month over the selected time interval, indicating the rate of SR closure for this service.
Data View: The data view shows detailed records for all SRs, open and closed, for this service.
This widget shows the number of SRs created for this service over the selected time interval, grouped by time elapsed since they were raised.
Chart View: The chart view shows the number of SRs created for this service in each month of the selected time interval. Color coded bands indicate the time elapsed since SR creation:
7 days or less
8 to 30 days
31 to 60 days
61 to 90 days
91 days or more
SRs that were open during the month, but have been closed since then, are included in the monthly count.
Data View: The data view shows detailed records for all SRs, open and closed, for this service.
This widget shows the number of incidents created for this service's product(s).
Chart View: The chart view shows the number of incidents created for each of this service's products, in each month of the selected time interval. Color coding indicates the SR priority, which is determined in MOS as critical, significant or standard.
Data View: The data view shows detailed records for all SRs, open and closed, for this service.
In the lower part of the screen, each incident record displays the name, status, and associated product for the SR. Tap any incident record at the bottom of the screen to see the full incident record.
Each record shows the following information, which is drawn from the MOS database:
| Field | Description |
|---|---|
Name, including
|
Identifying information about this SR, including:
|
| Status | Status of this SR from MOS:
|
| Product | Name of the product associated with this SR in MOS. |
| Updates | All the latest actions related to this SR. |
| Summary | MOS summary information for this SR, such as the status and the severity. |
To filter the incident records, select a filter from the list:
All Incidents lists all SRs for this service
All Open Incidents lists all open SRs for this service
Closed Requests lists all SRs for this service that have been closed
Searching for an Incident Record
To search for an incident, enter the search criteria in the Search field, located in the toolbar of the incident record table. Partial strings are auto-completed. Tap the search icon to see all incident records containing the string.
Tap the Changes option on the navigation bar to see reports of requests for change (RFCs) for this service. RFC information presented in Oracle Pulse is drawn from the My Oracle Support (MOS) database.
View any of these widgets on the Service Dashboard Changes screen:
Double tap any of the widgets to expand to full screen mode. Toggle between the chart view and the data view using the chart and table symbols respectively in the bottom right corner of the widget.
Scroll up to see any hidden widgets and the table of change records for this service at the bottom of the screen. You can also see individual change records listed at the bottom of the screen. Tap any record to see the change summary.
Created versus Applied Changes
This widget shows the number of RFCs created for, and the number applied to this service, indicating the rate of change.
Chart View: The chart view shows the number of RFCs created, and the number applied, to this service for each month of the selected time interval. If no RFCs were created or applied, the chart is empty.
Data View: The data view lists all RFCs that have been created for or applied to this service.
This widget shows all RFCs, listed by RFC type, that have been applied to this service.
Chart View: The chart view shows all RFCs, listed by RFC type, that have been applied to this service. Defined in MOS, RFC types include refresh and backup.
Data View: The data view lists all RFCs that have been applied to this service.
Applied Changes: Production versus Non-Production
This widget compares the rates of changes in production and non-production environments for this service.
Chart View: The chart view shows the number of RFCs applied to production environments, to non-production environments, and to all environments associated with this service, for each month in the selected time interval.
Data View: The data view lists all RFCs that have been created for or applied to this service.
Applied Changes by Environment
This widget shows RFCs applied to each environment.
Chart View: The chart view shows the RFC count for each environment associated with this service, for the selected time interval.
Data View: The data view lists all RFCs that have been created for or applied to this service.
Records for all RFCs created for this service are listed at the bottom of the screen. Tap any change record at the bottom of the screen to see the change details.
| Field | Description |
|---|---|
Name, including
|
Identifying information about this RFC, including:
|
| Environment | Environment associated with this RFC. |
| Status | Status of this RFC from MOS:
|
| Schedule | Time and date for which this RFC is scheduled, in the format YYYY-MM-DD HH:MiMi where YYYY is the year, MM is the month, DD is the day, HH is the hour, and MiMi is the minute. |
| Activities | All the latest activities related to this RFC. |
| Summary | MOS summary information for this RFC, such as the status and the severity. |
To filter the change records displayed, select a filter from the list:
All Changes lists all RFCs for this service
All Open lists all open RFCs for this service
Ready for Scheduling/Approval lists all RFCs for this service that are ready for scheduling or awaiting your approval.
Recently Updated lists all RFCs for this service that have been updated recently.
To search for a change record, enter the search criteria in the Search field, located in the toolbar of the change record table. Partial strings are auto-completed. Tap the search icon to see all change records containing the string.
The Other option on the navigation bar shows a collection of other service information, such as Additional VPN or Additional Backup.
To request more information about any of these services, tap the relevant service. In the Other Actions list in the top right, tap Request Information.
|
Copyright © 2013, Oracle and/or its affiliates. All rights reserved. Legal Notices |
|