Working with Analyses and Dashboards
With Oracle BI Mobile, you can see the vast majority of views provided by the desktop version of Oracle BI Enterprise Edition (Oracle BI EE).
You can perform all analytic actions in the Oracle BI Mobile application: prompts, drills, action links, and so on. You can interact with the data by filtering and sorting.
You can interact with graphs, drilling and zooming directly in the graph.
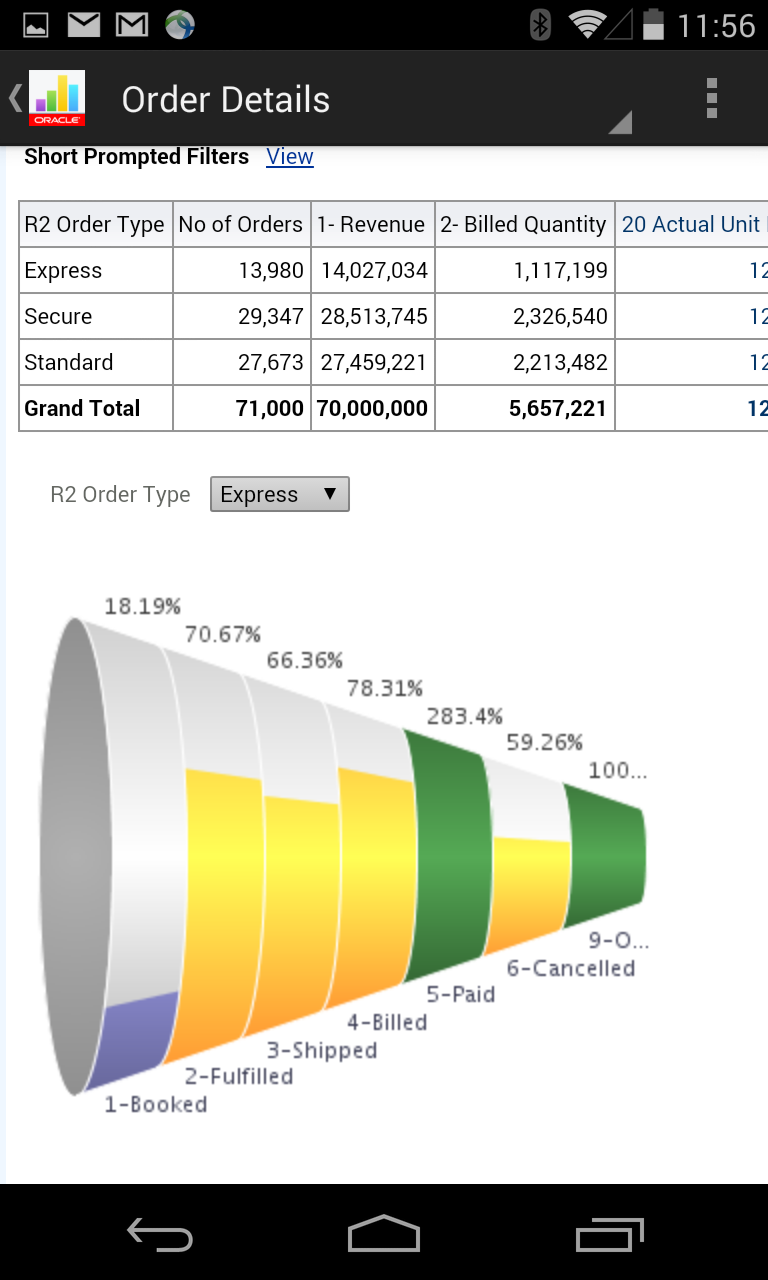
The following figure shows an example of BI content on an Android device.
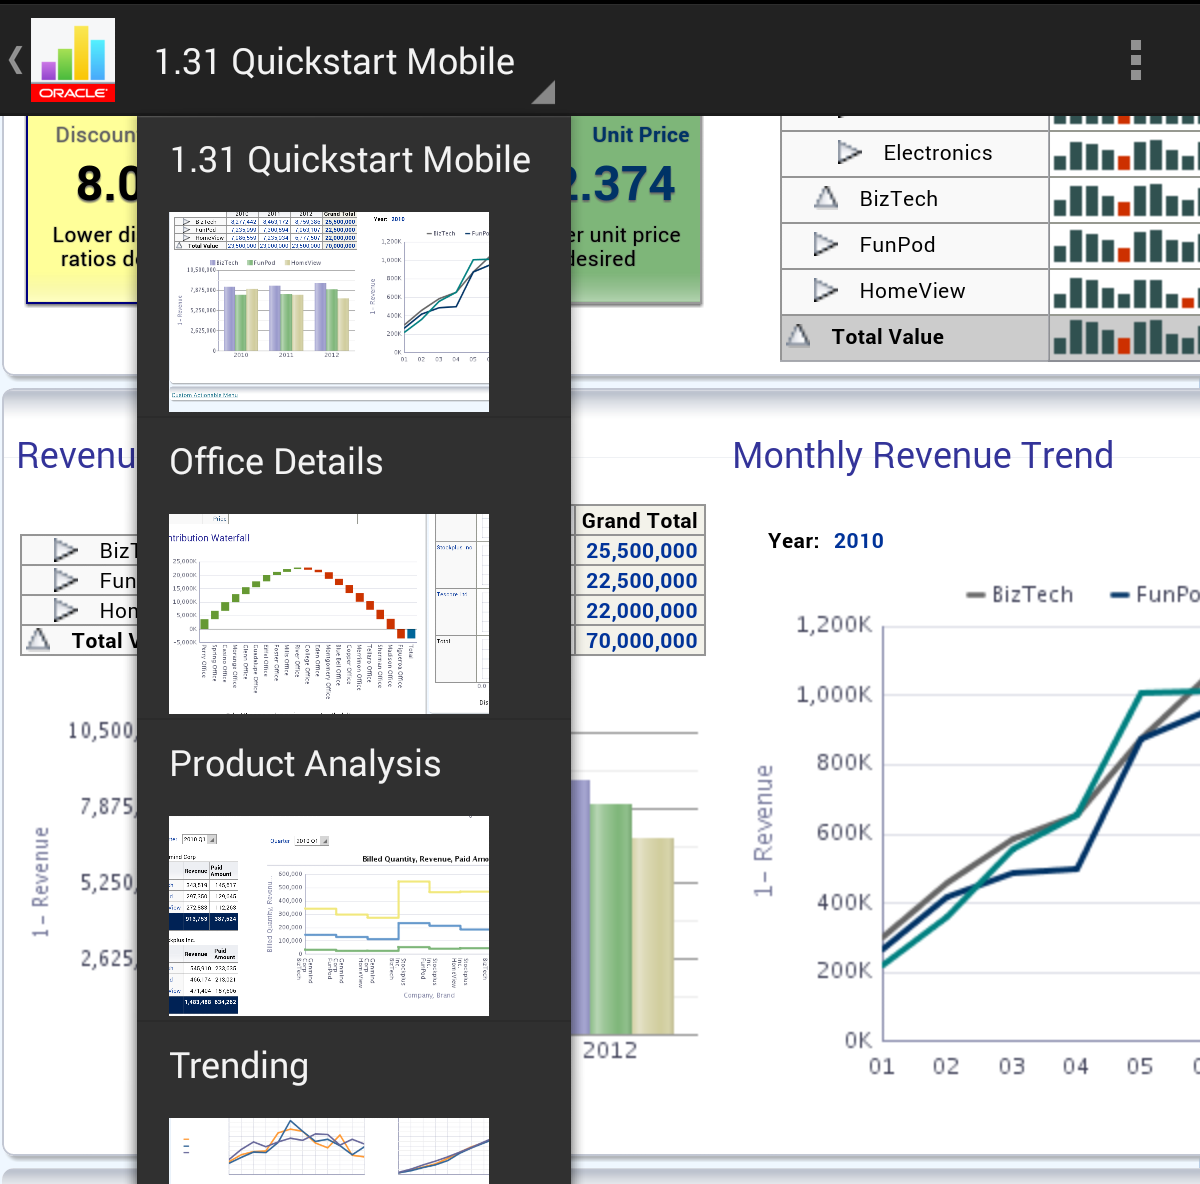
When a dashboard has multiple pages, tap the triangle icon (at the bottom right of the dashboard title) to access an overlay showing the available pages and tap again to navigate to one of them. An example of dashboard pages in an overlay is shown in the following figure.
You can maximize an individual view within a dashboard by double-tapping on it. The individual view then displays within the full screen of the device. When viewing an analysis independent of a dashboard, you can double-tap on it to expand the view to full-screen display. To revert back to the non-maximized view, repeat the double-tap gesture.
Note:
Double-tapping on a view to maximize it works on most view types. Exceptions include gauges, simple trellis views, and performance tiles.
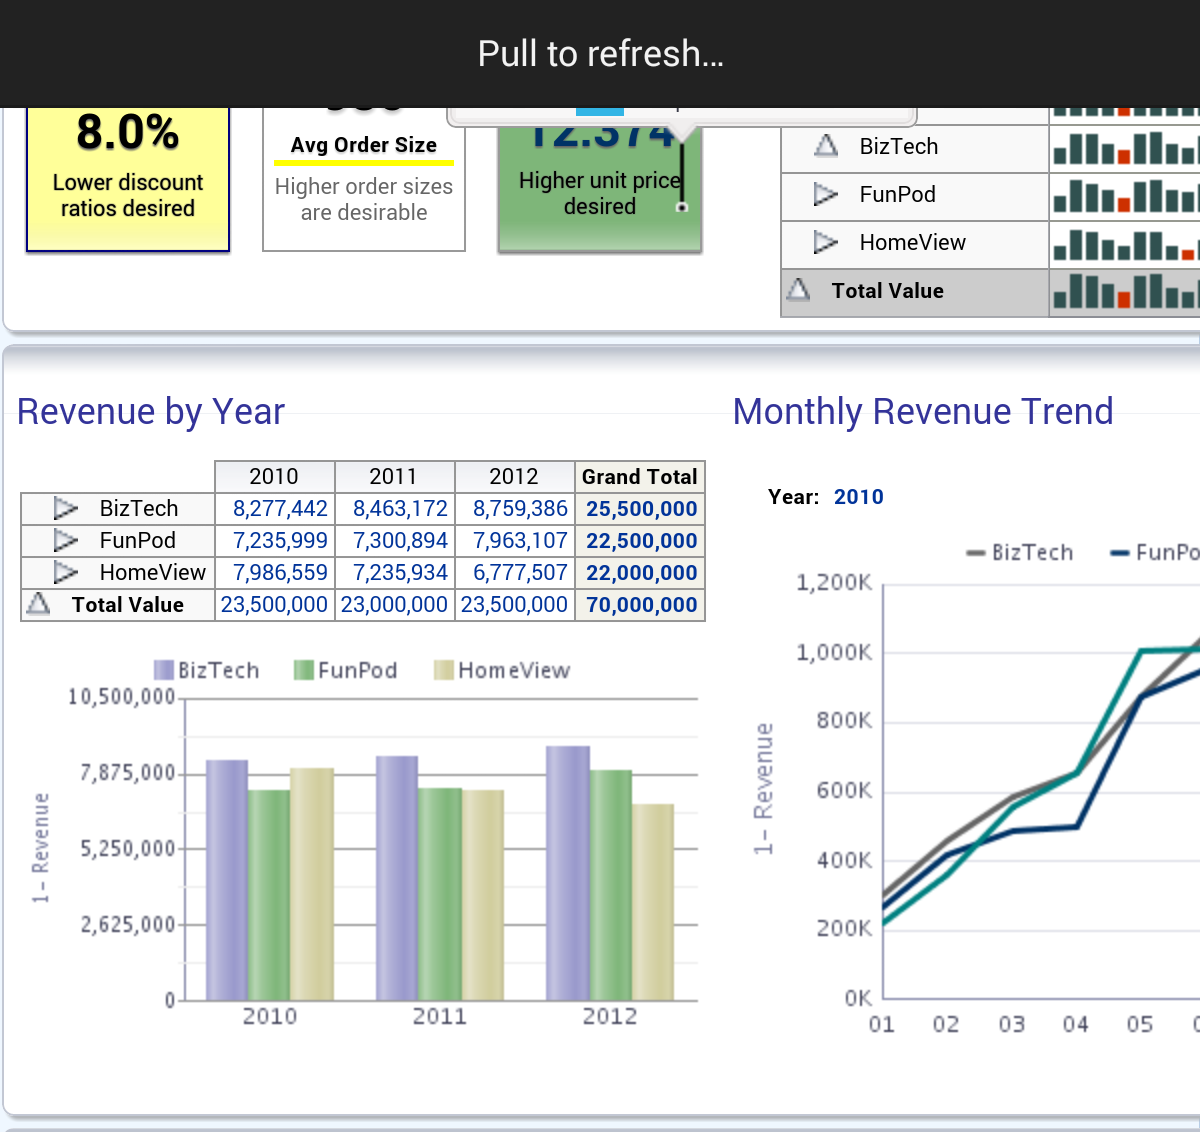
To refresh a view, swipe downward on the screen. This feature is shown in the following figure.
To pan around the view, swipe. To zoom in, pinch out. To zoom back out, pinch in.
Which Objects Are Disabled when Embedded in Dashboards?
Certain objects, when embedded in dashboard pages in the desktop version of Oracle BI EE, are disabled for display in the mobile application.
The following objects are suppressed from dashboard pages in Oracle BI Mobile:
-
Portal header
-
Report links
-
Edit link in empty home dashboard
-
Embedded content (iframe) view
-
Alerts view
-
Logical SQL view
-
Create Segment view
-
Create Target List view
-
Briefing books
-
Folder view
Working with Tables, Pivot Tables, and Trellis Views
In Oracle BI Mobile, a tap on a cell in a table and pivot table provides the same set of actions as a left-click of the mouse in the desktop version of Oracle BI EE. As for right-click actions, Oracle BI Mobile provides the same actions that are available in Oracle BI EE, except in the mobile application you use the tap-and-hold gesture rather than the right-click of the mouse.
Note:
Because there is no usage of right-click on a mobile device, this guide refers to the right-click menu as the Context menu.
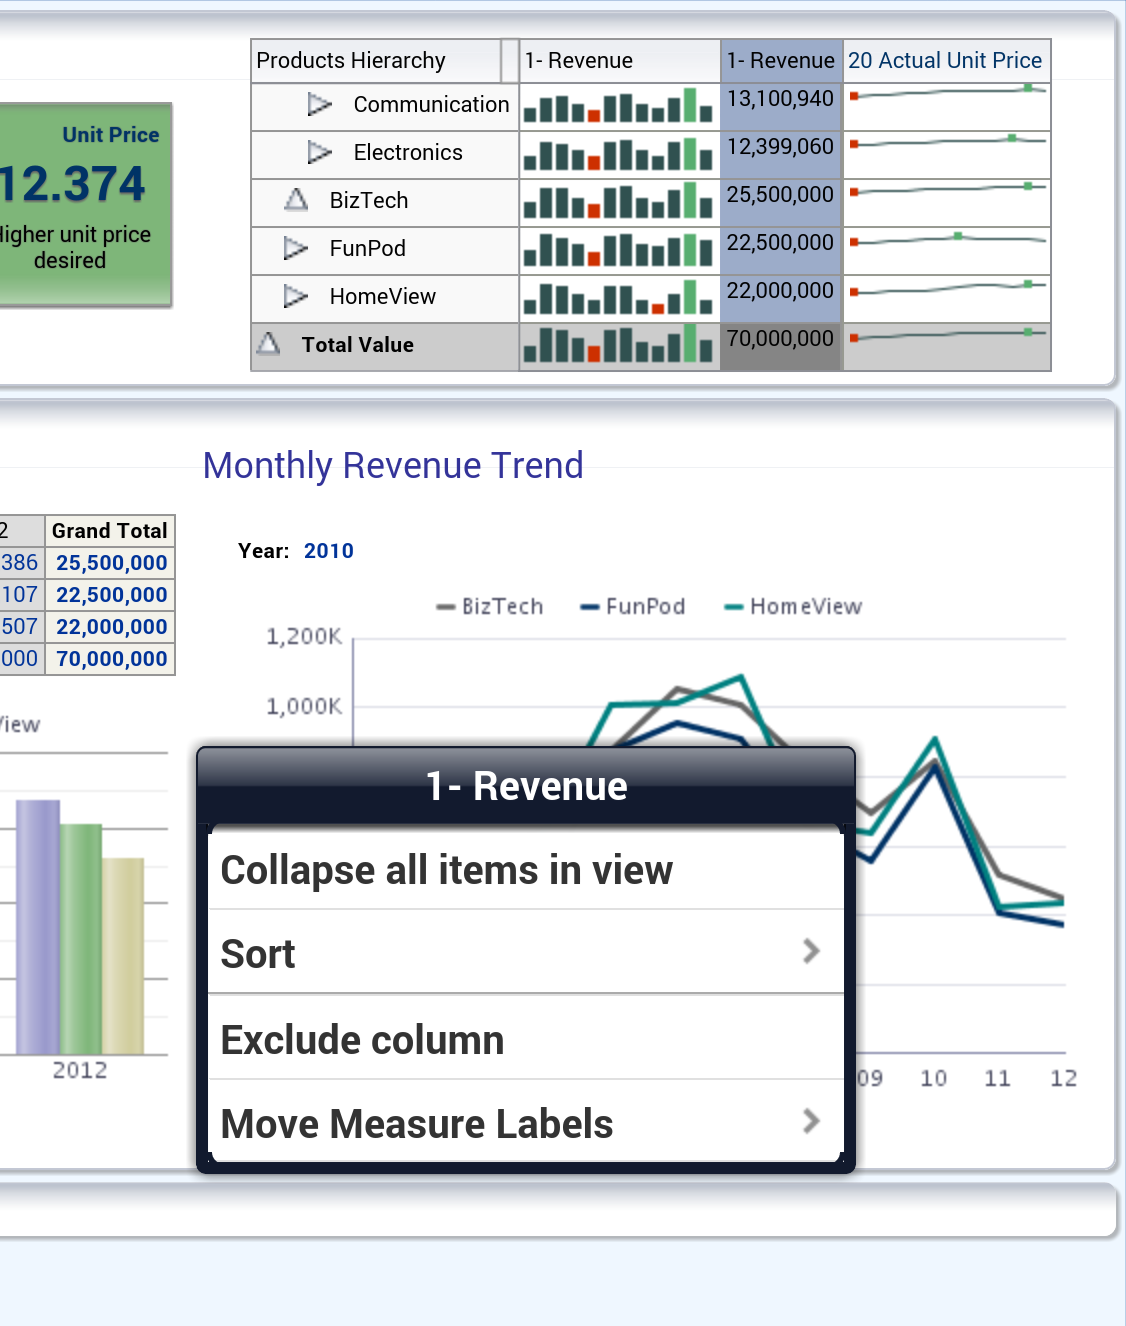
For example, to sort data, tap and hold on the column header to access the mobile version of the desktop application's right-click menu and then select Sort, as shown in the following figure.
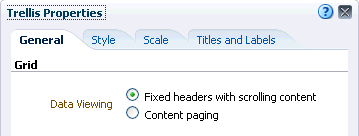
In tables, pivot tables, and trellis views, when Data Viewing is set to fixed headers in the Properties dialog (see the following figure) for an analysis, you can use a single-finger drag gesture to scroll through data in all directions.
Working with Graphs
User interaction with graphs is different in Oracle BI Mobile from that of the desktop version of Oracle BI EE.
-
left-click (drill, action-link, master-detail)
-
hovering the mouse (to show a tooltip)
In Oracle BI Mobile, where the user interaction is touch-based rather than mouse-based, gestures perform the actions.
Displaying Tooltips in Graphs
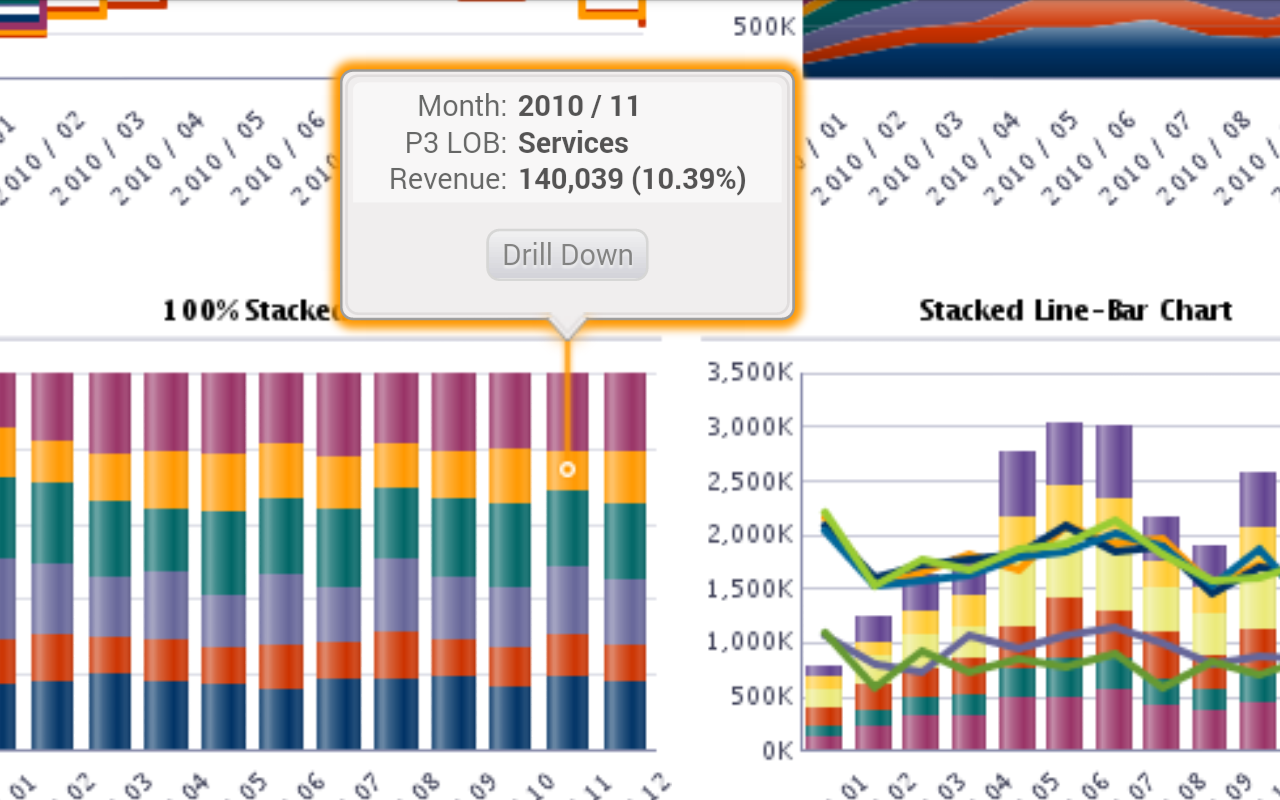
A tap gesture launches a tooltip (as does hovering the mouse in the desktop version), and the tooltip includes a button that can initiate the desktop version's left-click action.
The tooltips and menus that display on graph markers provide a layer to perform actions on the graph data. When there is only one action available for a marker, that action's button is readily visible in the tooltip layer. When there are multiple actions available, you see an Options button in the tooltip layer.
The following figure shows a tooltip displayed in a graph.
To dismiss a tooltip:
-
Do one of the following:
-
Tap an empty area of the graph.
-
Tap on a different graph marker. (This launches a new tooltip.)
-
In some cases—for example, in a graph with bars much thinner than the finger with which you tap and drag—you may need to nudge a tooltip to an adjacent bar so that the tooltip you want is the one that is actually displayed.
To move a tooltip:
Displaying Legends in Graphs, Funnel Graphs, and Gauges
The display of a graph, funnel graph, or gauge legend is different on a mobile device than it is on a desktop:
-
On a desktop (where the graph or gauge format is Flash), the legend list is scrollable and the legend text does not wrap.
-
On a mobile device (where the graph or gauge format is PNG), the legend list is not scrollable and the legend text can wrap.
Working with Performance Tiles
Performance tiles work in Oracle BI Mobile in the same way as any other view, and they display in the mobile application as they do in the desktop version of Oracle BI EE.
To interact with performance tiles in Oracle BI Mobile:
-
You can access an action link on a performance tile by tapping the performance tile.
-
You can tap and hold on the performance tile to display the full text of a tooltip.
