Active Task Aging Graph
A status graph in the Task Navigator shows important statistical information regarding performance of tasks related to the selected folder. For example, if a particular department is chosen, the statistics will reflect the chosen department only. Statistics displayed will be related to response time, % fixed in the first hour, and % fixed in a day.
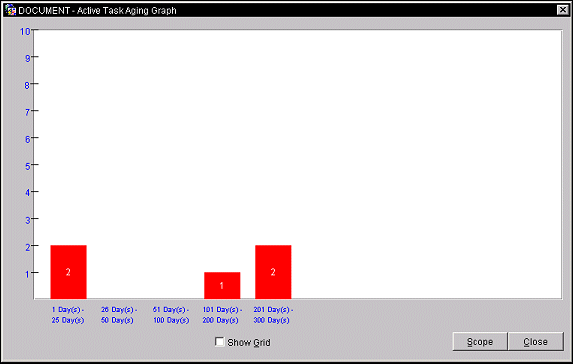
You can use the Active Task Aging Graph to graphically display the outstanding active tasks by department and time ranges. It defaults for the Y axis shows the number of tasks outstanding. For other functions you can plot the time, see Scope; defaults for the X axis showing the hours as defined in the user-definable intervals. To change the values, enter any number in the respective fields in the Scope screen. The axes will display the changes.

The Active Task Aging Graph screen displays the following information.
Data Label. Display values, names of data series, categories, percentages, or a combination of all of these.
Y Axis. This field represents the vertical line on the left side of the plot area and the proportional indicator based on the Range (X axis). It also provides a frame of reference for measurement or comparison in the graph. The data values are plotted along the value (Y) axis.
X Axis. This field represents the horizontal line that borders the bottom of the plot area. Time categories are plotted along the (X) axis.
Integers on Bars. Indicates the actual number of outstanding tasks.
Show Grid. This toggle button turns the graph grid lines on and off.
Scope. Move to the Scope screen to change the data values.
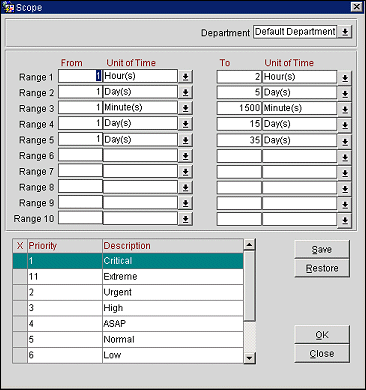
This analysis tool calculates and generates graphical data for the number of Active Tasks. Plotting the Scope displays the results in the Active Task Aging Graph.

Provide the following information and select the OK button.
Department. Initially defaults to logged in user's department, but is not used in default settings and saves. Select a different department from the drop down list of values.
Range 1-10. Select a minimum of 1 or maximum of 10 ranges for display on the Active Task Aging Graph.
From/To Unit of Time. Specify age and time ranges in minutes and hours increments.
Priority. Select priority levels to display all, some, or one task aging statistic s.
Description. The priority identifier associated with its number.
Save. Save the current selections as default settings after Close is marked as Active.
Restore. Revert to the previously chosen settings.
See Also