
|
|
|
Block History Dashboard
The Block History Dashboard displays tabs for multiple pages that provide a personalized view of reservation block history and statistics. These pages contain the results of detailed analyses, represented by links, images, graphs, pie charts and BI reports.
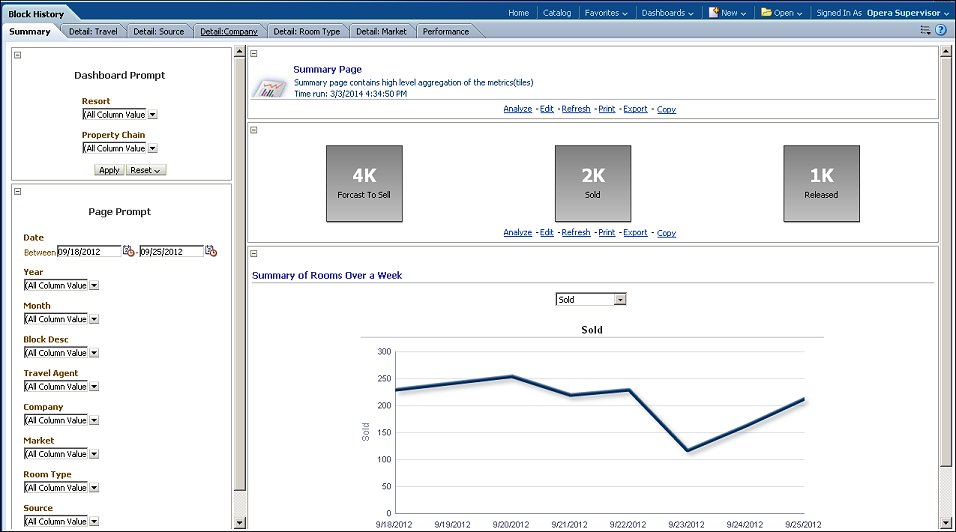
Select from the Resort and Property Chain LOVs to filter the page data by a specific resort or chain.
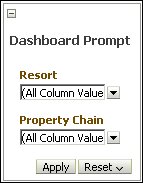
Apply. Select to apply the prompts.
Reset. Choose from the following options to reset the Dashboard prompts: Reset to last applied values, Reset to default values, Clear All.
Select from the column LOVs to filter the page data by the selected values.
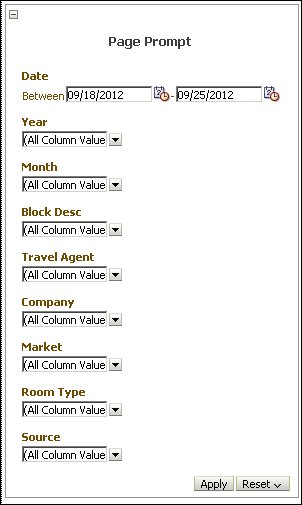
Apply. Select to apply the prompts.
Reset. Choose from the following options: Reset to last applied values, Reset to default values, Clear All.
Summary Page
The Summary page contains high level aggregation of the metrics (tiles).
Detailed Travel Agent
The Detailed Travel Agent page displays detailed statistics for each Travel Agent. A Pie Chart shows the % of share for Travel Agents for selected years.
Detailed Source
The Detailed Source page displays detailed statistics for each Source. A Pie Chart shows the % of share for Sources for selected years.
Detailed Company
The Detailed Company page displays detailed statistics for each Company. A Pie Chart shows the % of share for Companies for selected years.
Detailed Room Type
The Detailed Room Type page displays detailed statistics for each room type. A Pie Chart shows the % of rooms types sold for selected years.
Detailed Market
The Detailed Market page displays detailed statistics for each Market. A Pie Chart shows the % of share for Markets for selected years.
Performance Page
The Performance page contains the revenue and rooms performance over the weeks in a year and shows the top performing companies.