
|
|
|
Statistics
This screen displays all messages that have been generated from the ORS or OPERA PMS systems and their current status of being processed. The Statistics screen is broken into four areas for the users ability to see how the ORS or OPERA PMS’s business events are being processed. Also what the status is of those transmitted messages.
Example: Statistics screen.
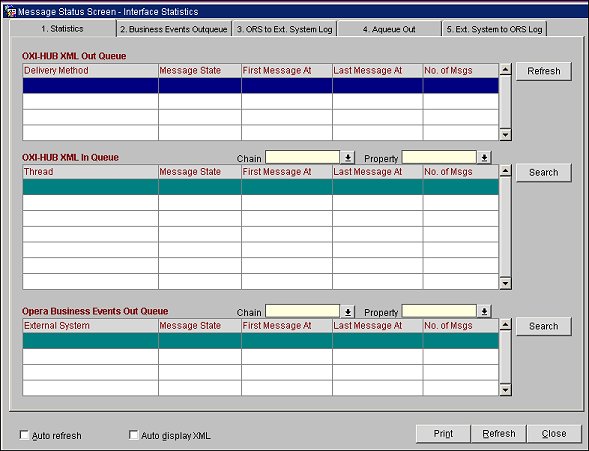
Action is done in ORS or OPERA PMS>which is sent to OPERA Business Events In Queue>moves to OPERA Business Events Out Queue>OXI_HUB In Queue>OXI_HUB Out Queue>messages go to external systems.
This out queue shows the current amount of messages per delivery type. The types of delivery visible will depend on what the properties are working with. You can have HTTP, MSMQ, FAX, EMAIL and PRINT. The Message Statuses will go through the process of READY, WAIT and PROCESSED. If the queue stays filled with messages, without a change or an increase in the number of messages, then check that External Systems services/processors are running.
This in queue shows the current messages that are coming from the OPERA Business Events Out Queue that will be grabbed and transmitted to properties via the OXI_HUB. This section should frequently be empty, or at least show messages for a minimal amount of time.
Chain. Select the down arrow and choose a chain from the list of values to filter the displayed message statistics by the chain.
Property. Select the down arrow and choose a property from the list of values to filter the displayed message statistics by the property.
This in queue will show entries for every action that has been done in the OPERA application if the Business Event processor is OFF. When the Business Event processor is ON, then this queue should frequently be empty, or at least show messages for a minimal amount of time until they make their way into the OPERA Business Events Out Queue.
Shows the current amount of messages queued for each type of External System/Resort that is to be delivered. If the OPERA Business Events Out Queue stays filled with messages then check that Central Systems QUEUE service is running. This service is located on the Central IFC machine; which is accessed through the IFC Monitor.
Note: For the External System column, the External System and Resort are displayed.
Chain. Select the down arrow and choose a chain from the list of values to filter the displayed message statistics by the chain.
Property. Select the down arrow and choose a property from the list of values to filter the displayed message statistics by the property.
Refresh. Displays the most recent data.
Print. Compiles and displays the Central System Manager Report in pdf format. The Central System Manager Report is used as a daily tool for monitoring data that has been uploaded and downloaded between PMS and ORS. Users view this information to take appropriate preventive and corrective actions. This report displays interface information occurring within the last 24 hours, based on the system date.
Note: This report is not part of the ORS/OCIS Standard Reports. It can only be accessed by selecting the Print button on this screen.
The Central System Manager Report can also be set up to run on a schedule, such as with Windows Scheduler. Add these parameters to your system to create a batch file.
Example:
rwrun60 report=ohub_csmanager DESTYPE=FILE userid=oxihub46_d/oxihub46_d@W2S01B46DEV (Enter your parameters: oxihub user/oxihub password@database)
DESFORMAT=PDF desname=ohub_csmanager.pdf batch=YES parameter=NO
The four main monitoring areas of the Central System Manager Report include: Queue Logs, Suspensions, Reservations, and Tablespace Usage.
The monitored information in this area includes download and upload activities for 1) External System to ORS, 2) ORS to External System, and 3) Unprocessed Aqueuein (unprocessed records). The report identifies the property where the activity occurred, where in the system the activity occurred, and the results of the activity such as NEW, MATCHFOUND, FAIL, SUCCESS, WARNING.
The information in this area includes Suspended Profiles. The display includes the current number of suspended profiles by property, import date, and stage status.
The information in this area includes Reservations Without PMS Confirmation Number.
The information in this area displays the current status of tablespaces and their size and usage. Three asterisks (***) indicate an alert that the table usage is above 90%.
Sample Central System Manager Report
See Also