
|
|
|
Admin Dashboard
The Admin Dashboard displays tabs for multiple pages that provide a personalized view of BI performance, data correctness, required cube maintenance and required administrative actions. These pages contain the results of detailed analyses, represented by links, images, graphs, pie charts and BI reports.
Select from the Resort and Property Chain LOVs to filter the page data by a specific resort or chain.
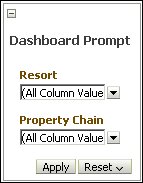
Apply. Select to apply the prompts.
Reset. Choose from the following options to reset the Dashboard prompts: Reset to last applied values, Reset to default values, Clear All.
Select from the column LOVs to filter the page data by the selected values.
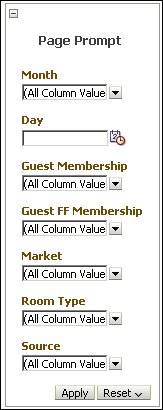
Apply. Select to apply the prompts.
Reset. Choose from the following options: Reset to last applied values, Reset to default values, Clear All.
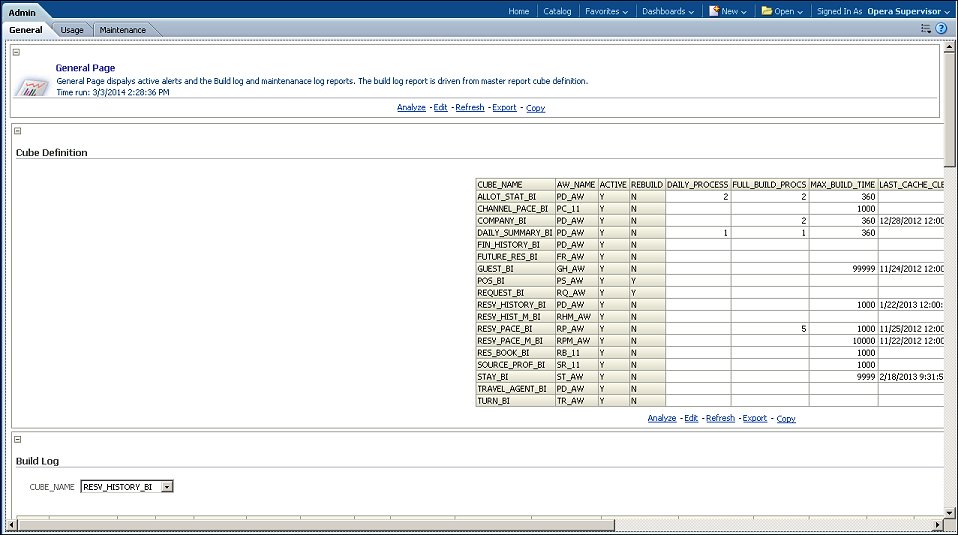
General Page
The General page displays active alerts and the build log and maintenance log reports. The build log report is driven from the master report cube definition. A status indicator for alerts is displayed on this page.
Status Indicator
The OBI status indicator is based on the existence and severity of OBI System alerts and and is presented on the dashboard in the form of a gauge graph. The colors of the gauge are as follows:
Green |
The system is stable and no action is required. This status is presented when all OBI system alerts are resolved. |
Yellow |
The system requires maintenance actions. This status is presented when unresolved alerts with Normal and Medium severity exist. |
Red |
The system integrity is jeopardized and urgent action is required. This status is presented when unresolved alerts with High severity exist. |
Usage Page
The Usage page consists of Usage tracking report links and user activity and performance by users.
Maintenance Page
The Maintenance page contains table spaces and workspace usage statistics.