|
|
|
ORMS Forecast Analysis
Note: This topic applies to ORMS ADF11.
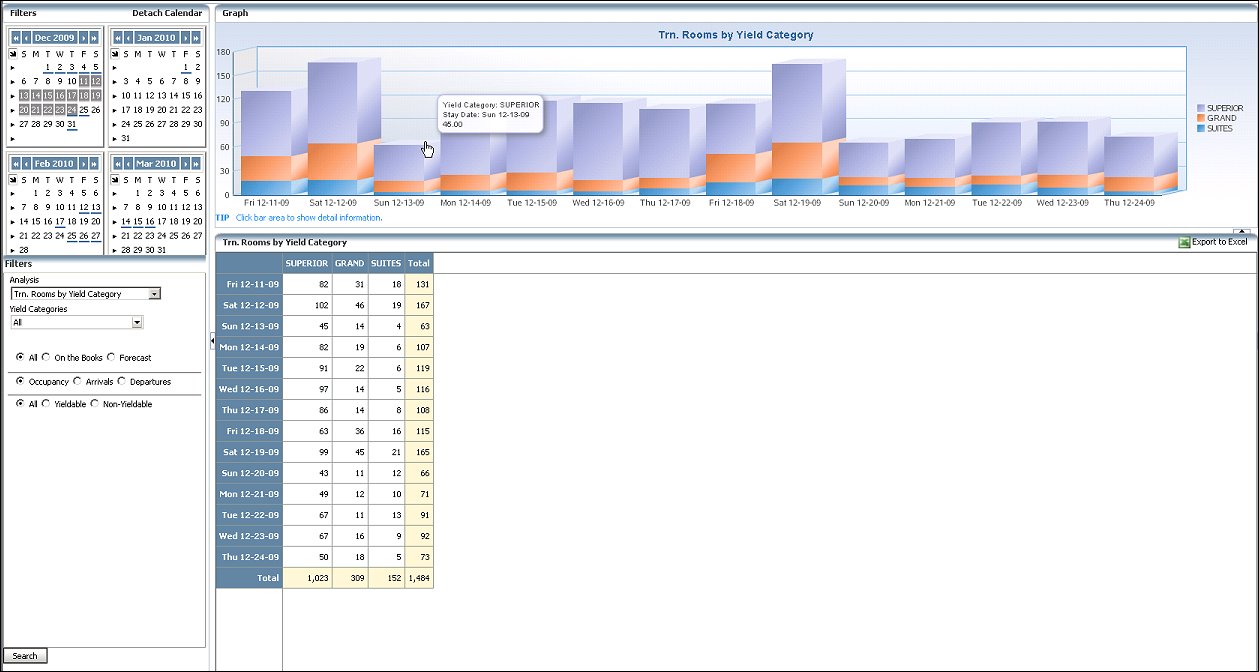
The Forecast Analysis Dashboard displays past, current, and forecasted room and reservation data. This is a comprehensive and dynamic screen, helping you better view and understand your property's business. The summarized data can be divided and dissected (sliced and diced) allowing you to see the information from different perspectives. The Forecast Analysis information presents on-the-books and forecasted data in graphs and grids, providing filters for your specified views. All data can be viewed by Yield Category and Booking Class. You can also view the data segmented by groupings of market codes, source codes, channel codes and rate categories, depending on the graph selected. The groupings of market codes, source codes, channel codes and rate categories presented here were defined in Configuration Forecast Groups.
The Forecast Analysis Dashboard contains filters on the left-side of the screen with the Calendar and options for the type of data you want displayed. The data in the graph reflects the options you selected for analysis. Beneath the graph is a grid depicting the statistics that calculate the graph.
For details about the Calendar, see Using the Calendar.
Select the options you want for analysis and select the Search button to display the results.
Analysis. The Analysis LOV lets you select the type of data you want represented in the graph and grid. The graphs for analysis include the following:
Note: This graph only displays the RevPAR OTB and RevPAR Forecast lines when all Yield Categories and Booking Classes are selected. As soon as a Yield Category or Booking Class becomes unselected, or the user only views by Transient, Allotment, Transient Yieldable or Transient Non-Yieldable Revenue, only the ADR OTB and ADR Forecast lines display in the graph.
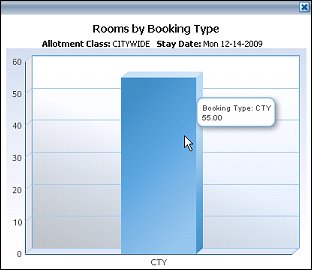
Allotment Class. Displays when the Rooms by Allotment Class analysis is selected. Select the allotment class you want included for analysis from the LOV.
Booking Class. Displays when the Trn. (Transient) Rooms by Booking Class analysis is selected. Select the booking class you want included for analysis from the LOV.
Market Codes. Displays when the Trn. (Transient) Rooms by Market Code Group analysis is selected. Select the market code you want included for analysis from the LOV.
Source Codes. Displays when the Trn. (Transient) Rooms by Source Code Group analysis is selected. Select the source code you want included for analysis from the LOV.
Channel Codes. Displays when the Trn. (Transient) Rooms by Channel Code Group analysis is selected. Select the channel code you want included for analysis from the LOV.
Rate Categories. Displays when the Trn. (Transient) Rooms by Rate Category Group analysis is selected. Select the rate category you want included for analysis from the LOV.
Yield Categories. Displays when the Total Rooms by Yield Category or Trn. (Transient) Rooms by Yield Category analysis is selected. Select the yield category you want included for analysis from the LOV.
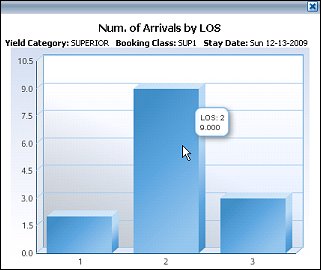
LOS. Displays when the Arrivals or Departure radio button is selected and the Trn. (Transient) Rooms by Yield Category or Trn. (Transient) Rooms by Booking class is selected. Select the length-of-stay you want included for analysis from the LOV (All, 1,2,3,or 4).
Select the number of rooms affected by the type of analysis, for the date. The rooms are viewed by selecting the radio button of:
All (both On the Books and Forecasted) number of rooms affected by the type of analysis and date.
On The Books. Displays only number of rooms affected by the type of analysis and date.
Forecasted. Displays only number of rooms affected by the type of analysis and date.
Occupancy. Displays the number of Occupied transient rooms, based on the selection of All, On The Books, or Forecasted display option.
Arrivals. Displays the number of Arrival transient rooms, based on the selection of All, On The Books, or Forecasted display option.
Departures. Displays the number of Departure transient rooms, based on the selection of All, On The Books, or Forecasted display option.
All. Displays both yieldable and non-yieldable transient rooms by type of analysis selected.
Yieldable. Displays all yieldable transient rooms by type of analysis selected, based on the selection of All, On The Books, or Forecasted display option.
Non-Yieldable. Displays all yieldable transient rooms by type of analysis selected, based on the selection of All, On The Books, or Forecasted display option.
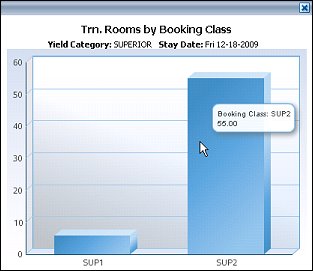
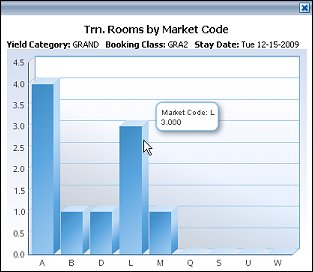
Certain graphs provide drill-down capabilities where you can view specific details by clicking on areas in the main graph. Graphs that provide drill-down functionality have a TIP message identifying them. ![]() . Graphs with this capability include:
. Graphs with this capability include:
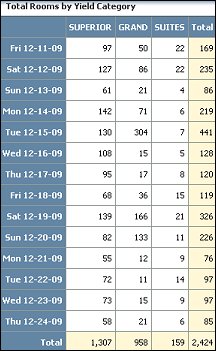
The grids display data based on the analysis type, filter options, and dates. Below is a sample grid for the Total Rooms by Yield Category. Grids typically contain the selected dates in the left column and the total number of rooms per analysis in the subsequent columns.
Search. Select the Search button to display your choice of options for data in the graph and associated grid.
Export to Excel. Select this button to export the current data into Excel. Each of the Analysis table grids can be transported to Excel. Please note that your Internet Explorer needs to be modified to allow this process. If your Network Administrator has not made the global change, please see the attached document for instructions on how to modify your Internet Explorer for Export to Excel. Click here.
The grid will be imported with all columns and rows after you select the following prompt, if applicable.
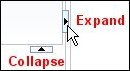
When you see the Expand and Collapse arrows on the dashboard, you can click on the arrow to expand or collapse that area of the screen, respectively.