Table of Contents Previous Next PDF


Oracle TSAM Plus Overview

Oracle TSAM Plus Overview
The following sections provide an overview to the Oracle Tuxedo System and Applications Monitor Plus (TSAM Plus) product:
Understanding Oracle TSAM Plus
Oracle Tuxedo is widely used by enterprises that develop and use mission-critical applications. It acts as the infrastructure layer in distributed computing environments. The complexity of Oracle Tuxedo and the applications running on top of it makes performance measurement extremely complex.
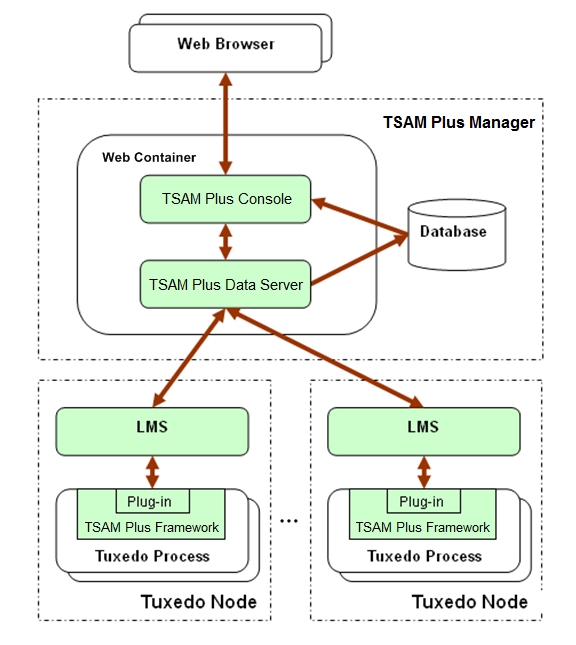
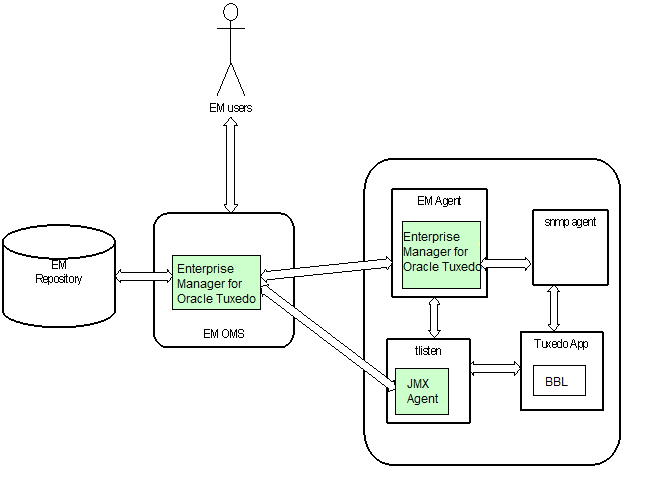
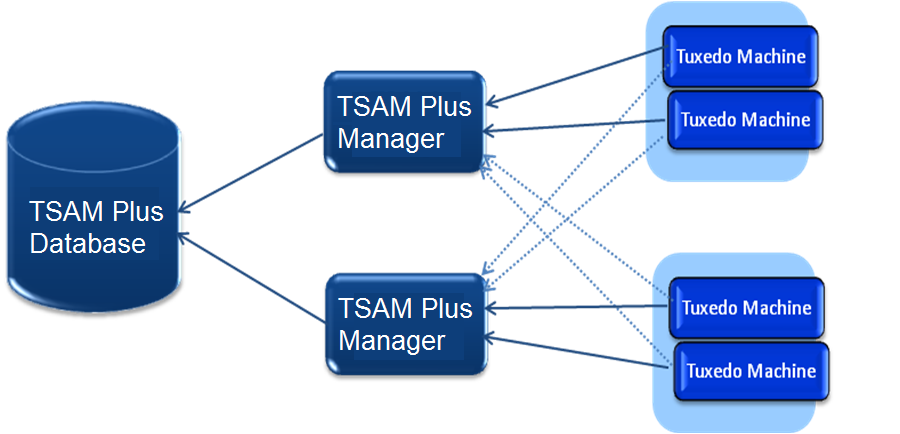
Oracle TSAM Plus provides comprehensive monitoring and reporting for Oracle Tuxedo system and applications. Oracle TSAM Plus monitors the major performance sensitive areas of a Tuxedo-supported enterprise computing environment. It can be used to monitor real-time performance bottlenecks and business data fluctuations, determine service models, and provide notification when pre-defined thresholds are violated. It includes three components: Oracle TSAM Plus Agent, Oracle TSAM Plus Manager, and Enterprise Manager for Oracle Tuxedo.
The Oracle TSAM Plus agent enables collection of various applications performance metrics (including call path, transactions, services, system servers). The Oracle TSAM Plus Manager provides graphical user interface that correlates and aggregates performance metrics collected from one or more Tuxedo domains. It displays this information in interactive real time. The Enterprise Manager for Oracle Tuxedo integrates Tuxedo management and monitoring with Oracle Enterprise Manager, allowing Tuxedo infrastructure and applications to be monitored and managed from the same console as other Oracle products.
Why Use Oracle TSAM Plus?
Because the Oracle Tuxedo framework and applications are widely deployed, comprehensive monitoring and reporting capability becomes increasingly critical. For example, you may want to know:
Oracle TSAM Plus can provide this information and allows you to easily identify bottlenecks and expedite problem resolution. Oracle TSAM Plus can also help with performance tuning and capacity planning.
Oracle TSAM Plus also allows you to define event alerts. The Oracle TSAM Plus Console reports an event when an alert is triggered notifying you to take proper action.
Oracle TSAM Plus Features
The following is a list of Oracle TSAM Plus features:
Real-time call path tree tracking of a monitored request is displayed and the performance metrics for each step are available.
The Oracle TSAM Plus Manager console allows you to create “Alert” definitions that generate events when predefined thresholds are reached. The events can be posted to Oracle Tuxedo and received by Oracle Tuxedo Event Broker subscribers.
New management interface for Oracle Tuxedo UBBCONFIG and BDMCONFIG, including JMX interface.
For more information, see the Oracle TSAM Plus Users Guide.
Oracle TSAM Plus Components
Oracle TSAM Plus Agent
The Oracle TSAM Plus Agent handles all Tuxedo-side back-end logic. It works in conjunction with the TSAM Plus Manager and Enterprise Manager for Oracle Tuxedo.The Oracle TSAM Plus Agent includes the following sub-components:
Oracle TSAM Plus Framework: The framework is the data collection engine. It is an independent layer working between Tuxedo infrastructure and other TSAM Plus components. This module is responsible for run time metrics collection, alert evaluation and monitoring policy enforcement.
Oracle TSAM Plus Plug-in: An extensible mechanism invoked by the Oracle TSAM Plus Framework. The Oracle TSAM Plus Agent provides default plug-ins to send data to the LMS (Local Monitor Server), and then to the Oracle TSAM Plus Manager. The plug-in allows custom plug-in to be hooked to intercept the metrics. The default plug-in communicates with LMS with share memory. Application will not be blocked at metrics collection point.
You can develop your own plug-ins for additional data processing. A customized plug-in can be linked to an existing plug-in chain, or replace the default plug-in.
Local Monitor Server (LMS): The LMS is an Oracle Tuxedo system server. The Oracle TSAM Plus default plug-in sends data to the LMS. The LMS then passes the data to the Oracle TSAM Plus Manager in HTTP protocol. LMS is required on each Tuxedo machine if the node need to be monitored.
accrpt: A utility to analyze accounting and chargeback information generated by -a option in servopts(5).
JMX Agent: A component working in conjunction with Enterprise Manager for Oracle Tuxedo, which enables you to monitor and manage Oracle Tuxedo applications through the JMX interface and furthermore, through the Oracle Enterprise Manger cloud control 12c.
Oracle Tuxedo Scripting Tool: A command-line scripting environment that you can use to manage and monitor Tuxedo domains.
BTM Observer: A component used to monitor business transactions end-to-end spanning products, for example, Oracle WebLogic Server and Oracle Tuxedo.
Oracle TSAM Plus Manager
Components
The Oracle TSAM Plus Manager is built on J2EE technology. It includes following components:
Oracle TSAM Plus Data Server: The data server is responsible for:
Oracle TSAM Plus Console: The Oracle TSAM Plus presentation layer. It is a J2EE Web application and can be accessed via a compatible Web browser. After logging on to the Oracle TSAM Plus Console, you have access to full Oracle TSAM Plus functionality.
Application Server
The Oracle TSAM Plus Manager runs in a Java application server. For more information about the supported Java application servers, see Oracle TSAM Plus Manager Supported Platforms, Web Containers, and DBMS.
Database
Oracle TSAM Plus uses a relational database to store the following information:
Oracle TSAM Plus supports automatic database reconnection. All background threads (data persistence, call patter calculation, etc.) in the TSAM Plus manager try to reconnect database automatically after the connection is recovered. However, you need to log on TSAM Plus console again if the database connection was broken.
For more information, see the Oracle TSAM Plus Deployment Guide.
Enterprise Manager for Oracle Tuxedo
Enterprise Manager for Oracle Tuxedo is an Oracle Enterprise Manager plug-in, by which users are able to monitor and manage Oracle Tuxedo product family in a centralized console with other product such as Weblogic Server and Oracle Database.
Oracle TSAM Plus Architecture
Figure 1 Oracle TSAM Plus Architecture - TSAM Plus Manager and Agent
Figure 2 Oracle TSAM Plus Architecture - Enterprise Manager for Oracle Tuxedo
Figure 2 contains the following main components:
Enhanced Tuxedo tlisten process
Works as a proxy and agent between Tuxedo and Enterprise Manager agent. A JMX agent is embedded and every target instance inside the associated Tuxedo domain corresponds to an MBean instance in the JMX domain. JMX agent receives metrics and job requests from Enterprise Manager agent and forwards them to the corresponding Tuxedo target instances.
Ensures that the MBean instances embedded in the connected JMX agent tlisten is consistent with the Tuxedo domain it is running on.
Must be started for Oracle Tuxedo Event collection and Oracle ART Batch System Server. The Oracle TSAM Plus on Enterprise Manager agent receives the event trap from tux_snmpd after the receive port is configured.
Oracle TSAM Plus High Availability and Scalability
Oracle TSAM Plus High Availability
You can configure two TSAM Plus managers for one TSAM Plus agent. The first one is a master. When the master manager is not available, TSAM Plus agent tries to connect the second one as a backup.
Figure 3 Oracle TSAM Plus High Availablility
TSAM Plus Manager Scalability
Oracle TSAM Plus manager is responsible for doing following tasks simultaneously:
For an enterprise that has a large number of Oracle Tuxedo applications, it requires TSAM Plus Manager to handle huge amounts of data and requests. Multiple TSAM Plus Manager instances can be configured to achieve the high throughput and low latency requirements.
As shown in Figure 4, there are three Oracle TSAM Plus managers configured in one Oracle TSAM Plus system, in which manager 1 and 2 are configured as data servers, and manager 3 is configured as a TSAM Plus console.
Figure 4 Oracle TSAM Plus Manager Scalability
Oracle TSAM Plus Concepts
Call Path Monitoring
Tuxedo is typically used by a client program (not necessarily a Tuxedo client process) that calls a service to perform a business computing logic scenario. The service implementation is completely transparent to the caller. This type of middleware transparency provides many benefits for development, deployment, and system administration. However, from a monitoring perspective, it is difficult for the end user or administrator to figure out what happens “behind the scene”. Oracle TSAM Plus call path monitoring helps to alleviate this problem.
Call Path Tree Definition
A simple Tuxedo application call triggers a set of service invocations. The involved services constitute a tree (“call path tree”). A call path tree strictly defines the following factors:
Call transportation. The edge (how information is sent and received) of a call path tree represents the transportation information from caller to service provider. It could be an IPC queue, BRIDGE connection or DOMAIN connection. The elapse time used for each transportation is also recorded.
Monitoring Initiator
A "monitoring initiator" is a process that "initiates" tracking a call path tree. The process can be a Tuxedo client, application server, client proxy server (WSH/JSH), the Tuxedo domain gateway server or web services proxy serve GWWS. A typical scenario is when a tpcall/tpacall/tpconnect is invoked by the monitoring initiator; call path monitoring begins. All the back-end services involved in this call are displayed on the call path tree representation in the Oracle TSAM Plus Console.
Note:
Currently only tpcall/tpacall/tpconnect can trigger a call path monitoring. Other communication models are not supported.
For tpconnect, there are limitations in the different scenarios:
For common usage scenarios, only service in and return call segment are supported. The response call path is missed if the client issues disconnect and the call is handled by a bridge.
When a client invokes tpdiscon, the time stamp is later than the last call path segment.
In the event that tpconnect is failed, nothing is recorded in Oracle TSAM Plus manager, that is, no information is displayed for the call.
A Tuxedo application server performs two functions:
Service Monitoring
Service monitoring focuses on Tuxedo service execution status. It does not care about call correlation, as call path monitoring does. Service monitoring can be used with call path monitoring together or performed independently. Tuxedo CORBA is also based on the service infrastructure, so in this release the CORBA interfaces can also be monitored.
System Server Monitoring
Tuxedo has several important system servers: BRIDGE, GWTDOMAIN and GWWS. BRIDGE connects multiple Tuxedo machines within a Tuxedo domain. GWTDOMAIN connects one Tuxedo domain with others. GWWS is the web services gateway. The system server monitoring tracks message throughput, pending sent messages and awaiting reply messages on each network link for BRIDGE and GWTDOMAIN. For GWWS, the web service requests statistics will be collected.
Transaction Monitoring
A critical use of Tuxedo is transaction monitoring. Tuxedo coordinates activities in a distributed transaction with an XA compliant resource manager, such as a database. Oracle TSAM Plus transaction monitoring tracks each XA call triggered in a transaction allowing you to clearly identify where a global distributed transaction is bottle necked. TSAM Plus supports the transaction monitoring capability propagation. That is if the transaction initiator is monitored, all XA calls on the transaction path will be monitored. The propagation supports transaction across domains.
Oracle Tuxedo Application Runtime for CICS and Batch Monitoring
Oracle TSAM Plus allows you to monitor the following Oracle Tuxedo Application Runtime for CICS and Batch components.
For more information, see Oracle Tuxedo Application Runtime for CICS and Batch Documentation.
Policy Monitoring
Oracle TSAM Plus provides a comprehensive policy monitoring mechanism. When the proper policy monitoring settings are created, you can collect the exact metrics needed with minimum application performance impact. You define a policy using the TSAM Plus Web console and apply it to an Oracle Tuxedo application automatically. Oracle TSAM Plus Policy Monitoring has the following characteristics:
Monitoring Category. One monitoring policy can focus on one kind of monitoring, such as call path. It can also cover multiple interested areas.
Enable or Disable. Oracle TSAM Plus monitoring can be dynamically turned on or off. Monitoring policy can be predefined and enabled when the monitoring is needed. All enabled monitoring policy will be applied to Tuxedo applications automatically while application is running. Non-started application will get the policy while it is started.
Interval-Based Monitoring. Monitoring is initiated based on specific time intervals. For example, call path monitoring. An interval-based monitoring policy can specify that the call path is tracked in 60-second intervals.
Ratio-Based Monitoring. Monitoring is initiated by the number of executions. For example, service monitoring. A ratio that is set to 5 indicates that every 5 executed services are monitored. For call path monitoring, a ratio set to 5 indicates that every 5 tpcall/tpacall calls are monitored.
Runtime Condition Filtering. TSAM Plus monitoring policy supports some run time filters. Customer can monitor a particular service, a request from specific client and some kind of process type. The filter supports regular expression format.
Flexibility to Reduce Monitoring Performance Impact. Oracle TSAM Plus monitoring control enables you to configure the monitoring policy based on your application size, load and network activity. The monitoring policy can support only alert triggering without raw metrics storage.
Performance Metrics
Oracle TSAM Plus performance metrics are listed as follows:
Correlation ID: A unique identifier that represents a call path tree. It is generated by the monitoring initiator plug-in. It uses the following format:
DOMAINID:MASTERHOSTNAME:IPCKEY LMID PROCESSNAME PID TID COUNTER TIMESTAMP
Listing 1 shows an example of a Correlation ID. The monitored call is started by the program “bankclient” with process ID 8089 and thread ID 1 on machine “SITE1” on Tuxedo domain “TUXDOM1”. The master is “bjsol18” and IPCKEY in TUXCONFIG is “72854”.
Listing 1 Correlation ID Example
TUXDOM1:bjsol18:72854 SITE1 bankclient 8089 1 99 1259309025
 
Service Name: The name of an Oracle Tuxedo Service.
Location: The set of metrics to identify the process who sends out the performance metrics. It includes information about domain, machine, group and process name etc.
IPC Queue Length: The message number in an IPC queue.
IPC Queue ID: Oracle Tuxedo identifier of an IPC queue.
Execution Time: The time used in an Oracle Tuxedo service or XA call execution in milliseconds.
Wait Time: The time used of a message in the transportation stage.
CPU Time: The CPU time consumed by the service request processing. It only applies to single threaded server.
Message Size: The Oracle Tuxedo message size.
Execution Status: The tpreturn service return code. It is defined by the Oracle Tuxedo ATMI interface.
Call Flags: The flags passed to tpcall/tpacall in the Oracle Tuxedo ATMI interface.
Call Type: tpcall, tpacall, or tpforward.
Elapse Time: The time elapsed time a call is monitored.
GTRID: Oracle Tuxedo global transaction ID.
Pending Message Number: The number of messages which are delivered to the Oracle Tuxedo network layer and waiting for being sent.
Message Throughput: The total message number and volume accumulated in system server monitoring intervals.
Waiting Reply Message Number: The number of requests in GWTDOMAIN awaiting a reply from the remote domain.
XA Code: The XA call return code in transaction monitoring.
XA Name: The XA call name.
GWWS Metrics: A set of metrics used to measure GWWS throughput, including:
Tuxedo Targets Monitoring
Tuxedo targets are Tuxedo host machines, applications, Tuxedo family components, that can be managed and monitored in Enterprise Manager Cloud Control. Enterprise Manager for Oracle Tuxedo is a plug-in that comes with a comprehensive set of performance and health metrics used for Tuxedo targets monitoring, providing administrators with a rich source of diagnostic information and trend analysis data.
Before you manage and monitor Oracle Tuxedo applications, you must first discover the Tuxedo targets using Enterprise Manager Cloud Control.
JMX Agent and tlisten
Tuxedo tlisten process works as a proxy and agent between Tuxedo and Enterprise Manager agent. A JMX agent is embedded and every target instance inside the associated Tuxedo domain corresponds to an MBean instance in the JMX domain. JMX agent receives metrics and job requests from Enterprise Manager agent and forwards them to the corresponding Tuxedo target instances.
Dynamic Resource Broker
The Dynamic Resource Broker is a major Enterprise Manager for Oracle Tuxedo feature. It enables manual and policy-driven deployment of Tuxedo servers, groups, and machines on a running Oracle Tuxedo domain for flexible resource allocation towards certain Enterprise Manager targets.
It includes the following major functions:
Dynamic Request Broker
Dynamic Request Broker is a Tuxedo load balancing functionality enhancement that minimizes response time for request calls and provides more reasonable workload distribution across multiple servers (especially in a multiprocessor (MP) domain). More specifically, Dynamic Request Broker is a mechanism that introduces new request routing metrics (for example, service execution time, network time, etc.),as a replacement for the static load values set in UBBCONFIG file and reflects service and network load level dynamically. Furthermore, it syncs metrics across all distributed machines in an MP domain to achieve optimal resource utilization.
Oracle TSAM Plus Use Cases
Oracle TSAM Plus is built on top of Oracle Tuxedo and has unique service, call, and transaction tracking capabilities. Enterprise organization usually have many widely distributed services deployed and one client request that requires complex back-end service coordination to perform the processes.
It can be difficult for an administrator to figure out what exactly is happening during these interactions. Oracle TSAM Plus call path monitoring helps to alleviate this problem.
The followings are typical user cases will help you to better understand how Oracle TSAM Plus works with your applications:
Optimizing Application Development
Is the message routing working as expected?
Message routing is an important concept in Tuxedo. It impacts the system's performance, business logic process correctness and application reliability and high availability. Lots of factors can affect Tuxedo message routing, such as:
In development stage, huge of tests needed to verify your settings take effect. Without TSAM Plus, it is hard to tell the exact request going to the correct service desired. TSAM Plus call path can depict each call path clearly and speed your development process.
Understanding Your Applications
What happens behind a simple call?
Enabling call path monitoring for a Tuxedo client or application server allows you to find out all the information behind a simple tpcall/tpacall. The tracking points span multiple machines and multiple domains. You can clearly see the following information in the call path tree:
What about my services?
Service monitoring enables you to measure your service response time, IPC queue length, and execution status. Service monitoring provides the following information:
Oracle TSAM Plus tells you how many service executions succeeded or failed recently or during a period of time. Oracle TSAM Plus also computes the average response time. These are important factors in measuring the quality of your services.
Oracle TSAM Plus also displays your services activity trends. It tells you what the peek time is and when the services requests are low.
Is my network busy?
Oracle TSAM Plus allows you to monitor the network connection attached to your local domain gateways. You can easily find which link is busy and its data fluctuation trend. You have more in-depth understanding of the business data flow model between departments and organizations.
Who participates in my transaction?
Oracle TSAM Plus monitors the transaction XA calls. Transaction participants are listed on the transaction monitoring page. For a large distributed transaction, a slow branch can result in the entire transaction being slowly completed. Oracle TSAM Plus lets you know who the transaction participants are, and how much time is used during XA calls. The transaction monitoring can also help find the bottleneck in a two phase commit stage if multiple resource managers involved.
Solving Application Performance Problems
Why is the service response time slow recently?
Turn on the call path monitoring for a particular call to investigate the following:
My back-end services failed, but I don’t know which one.
Turn on call path monitoring. You can find the service execution status for this call.
How many kinds of call paths are in my application?
Turn on call path monitoring using an adequate sampling policy. Oracle TSAM Plus will tell you how many call paths (a “call pattern”) exist in your application.
Why is my global distributed transaction completed slowly?
Turn on Oracle TSAM Plus transaction monitoring. You can see the execution time used by the transaction participants.
I want to correlate local transactions with remote transactions.
Turn on Oracle TSAM Plus transaction monitoring for all involved processes and GWTDOMAIN. The Oracle TSAM Plus Console shows you the transaction mapping between local and remote transactions.
I want to know what is the peak time that my local domain uses resources from the remote domain, and how busy it is.
Use Oracle TSAM Plus system server monitoring on the GWTDOMAIN. Oracle TSAM Plus records the information for you, and shows you the throughput trends.
Can I check program request information?
Turn on call path monitoring with the proper monitoring policy and then use “tpgetcallinfo”. The following information is provided.
The monitoring initiator process, tpgetcallinfo(), can also tell you the total time used.
Improving Application Performance
Are my services too fine grained?
In some cases, too many services supporting a request may add to performance overhead. Use call path tree to investigate. The service number and the tree depth are key analysis factors.
Are my services deployed properly?
Some services are called more frequently than others. Use call path monitoring to gather the information, and re-consider the service deployment. It is best to have the most used services located on the local machine and LAN. Services across domain services should be used carefully.
Do I have too many servers configured?
Oracle TSAM Plus provides a central view of your Tuxedo applications with multiple domain support. Using Oracle TSAM Plus Console allows you to easily see how many domains, machines, servers and services are configured.
I want to be notified when something is wrong with my system
Oracle TSAM Plus provides comprehensive alert configuration based on the metrics collected. The base technology of TSAM Plus alert evaluation is Tuxedo FML Boolean expression, so you can combine complex conditions to compose an alert, such as:
How to drop stale requests?
Some times the service execution is slow and quite some request messages are waiting for a long time in the IPC queue. The client who issues the request might be already got timeout notification, but the service still continually to process the request. Oracle TSAM Plus Alert can allow you to configure an "drop request" action with some metrics. For example, you can drop a request if the waiting time of a message greater an large value. You can also configure an alert with drop request action under the condition that the message number in the request queue exceeding some threshold.
What’s Next?
After becoming familiar with the Oracle TSAM Plus Product Overview, refer to the following topics for installing, deploying, and using Oracle TSAM Plus.
For more information on the current Oracle TSAM Plus Release, see the Oracle TSAM Plus Release Notes.
For an explanation of how to install the product, see the Oracle TSAM Plus Installation Guide.
For an explanation of how to deploy the product, see the Oracle TSAM Plus Deployment Guide.
For an explanation of how to configure the product, see the Oracle TSAM Plus Configuration Guide.
For an explanation of how to use Oracle TSAM Plus Manager and Agent, see the Oracle TSAM Plus User Guide.

Copyright © 1994, 2017, Oracle and/or its affiliates. All rights reserved.