Setting Up the Affiliations Gantt Chart
This section discusses how to set up the Person Affiliations Gantt chart.
|
Page Name |
Definition Name |
Navigation |
Usage |
|---|---|---|---|
|
Chart Properties |
SCC_AFL_CHART_TASK |
|
Define the appearance of the Person Affiliations Chart View. |
Access the Chart Properties page ().
Image: Chart Properties page
This example illustrates the fields and controls on the Chart Properties page. You can find definitions for the fields and controls later on this page.
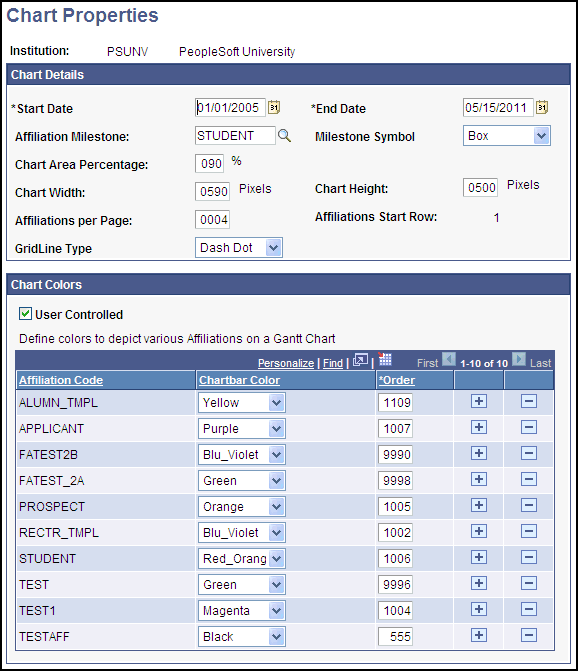
This page is used to define the chart details for the Person Affiliations Chart View. The Chart View is an alternate way to look at Person Affiliations in addition to the Table and Hierarchical views.
|
Field or Control |
Definition |
|---|---|
| Chart Start Date |
Enter the Start Date of the period of time that the chart will display on the X-axis (horizontal). The chart only displays those affiliations that are within the range of the Start Date and End Date. If an Affiliation is not completely within the range, the Affiliation is not displayed. |
| Chart End Date |
Enter the End Date of the period of time that the Gantt chart will display on the X-axis (horizontal). |
| Affiliation Milestone |
Select an Affiliation to view in relationship to all other affiliations with which the person is associated. The Affiliation Milestone takes the start date of the Affiliation and denotes it as the milestone. |
| Milestone Symbol |
Select a graphical symbol to display in the Chart for the Affiliation Milestone. |
| Chart Area Percentage |
Enter the percentage of the page to use for the chart portion of the page; the remaining area is used for the table portion. |
| Chart Height |
Enter the height of the chart area represented in pixels. Maximum value is 9999. Oracle recommends a value less than the display area and resolution value of the computer monitor. |
| Chart Width |
Enter the width of the chart area represented in pixels. Maximum value is 9999. Oracle recommends a value less than the display area and resolution value of the computer monitor. |
| Affiliations Per Page |
Enter the maximum number of Affiliations that can be displayed on the chart at one time. |
| Affiliation Start Row |
Displays default value of 1. |
| Gridline Type |
Select the gridline appearance. |
| User Controlled |
Select this check box for the option of selecting the color and display order for each Affiliation displayed on the chart. Note: If you select the User Controlled check box, you must select a Chartbar Color and enter a unique Order number for each Affiliation Code you want to display. Affiliation Codes that do not have both a Chartbar Color and Order assigned are not displayed in the Affiliations Chart View. If the check box is NOT selected, the system no longer assigns a Chartbar Color, but adds a default Order number of 9999. If you do not want the Affiliation Code displayed, do not specify a color. To display the Affiliation Code, select a color and specify an order number from 1 - 9998. There are 18 available colors so if an institution has defined more than 18 Affiliation Codes, multiple Affiliation Codes will have the same Chartbar Color assigned. |
| Chartbar Color |
Select a display color for the Affiliation. You must select one of the 18 available colors if you want the Affiliation to be displayed. |
| Order |
Enter a unique number, up to 4 digits, to determine the order in which Affiliations are displayed on the chart. The default Order number is 9999. For an Affiliation to be displayed, you must specify an Order number between 1- 9998 and a Chartbar Color. No two Affiliations can have the same order number |