The Event Diagram shows the TTR events in graphical form. It is just another form of information shown in TTR Event panel.
Event Diagram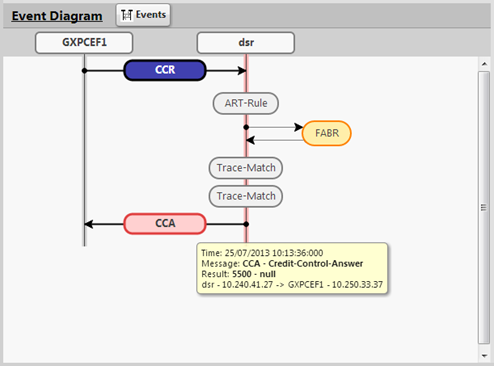
The user can hover or click on a bubble of the ladder diagram which may show information about that particular bubble in the Diameter Full Decoding Panel.
The user can also click Toggle Event Table in order to view events in tabular form, which also allows for a selected row to appear in the Diameter Full Decoding Panel.
The following table defines how the TTR events are visualized in the ladder diagram:
| Event Type | Event Scope | Event Diagram Visualization | Title | Tooltip |
|---|---|---|---|---|
| Request Message Sent/Received | IR, ER | Blue bubble with arrow from source node to destination node | Command Code short name (for example ULR for Update Location Request) | Time, Command Code |
| Answer Message Sent or Received with Success Result Code (RC< 3000) | IA, EA | Green bubble with arrow from source node to destination node | Command Code short name (for example ULA for Update Location Answer). | Time, Command Code, Result |
| Answer Message Sent or Received with Success Result Code (RC >= 3000) | IA, EA | Red bubble with arrow from source node to destination node | Command Code short name (for example ULA for Update Location Answer) | Time, Command Code, Result |
| Message Created | App Data | Gray bubble on DSR node | "Message-Created" | |
| App Invoked | App | Orange bubble next to DSR node with arrows from DSR to and from Application bubble | "<Name>" from Event Data | "Application: <Name>" (Event Data) |
| App Result | App Data | App Result appends a text to the corresponding Application's tooltip | "Result: <Event Data>" appended in previous Application's (App Invoked) tooltip | |
| App Invocation Failed | IR Data, IA Data | App Invocation Failed makes the corresponding Application bubble red and appends text to its tooltip. | Appends "Invocation Failed: <Event Data>" red text in previous Application's tooltip | |
| Trace Match | IR Data, ER Data, IA Data, EA Data | Gray bubble on DSR node | "Trace-Match" | "Matched Trace: <Event Data>" |
| Linked TTR | No visualization | |||
| ART Rule Match | IR Data | Gray bubble on DSR node | "ART-Rule" | "ART Rule: <Event Data>" |
| PRT Rule Match | IR Data | Gray bubble on DSR node | "PRT-Rule" | "PRT Rule: <Event Data>" |
| Unavailability Action | IR Data, IA Data | Unavailability Action makes the previous event bubble red. | Appends "Unavailability Action" red text in the previous bubble's tooltip | |
| Route List Selected | IR Data | Gray bubble on DSR node | "Route-List" | "Selected List: <Event Data>" |
| Dest-Host Routing | IR Data | Gray bubble on DSR node | "Dest-Host-Routing" | |
| Alternate Implicit Routing | Alternate Implicit Routing makes previous metadata bubble red and appends a text in its tooltip. | Appends "Alternate Implicit Routing" red text in the previous metadata bubble's tooltip | ||
| Route Group Selected | IR Data | Gray bubble on DSR node | "Route-Group" | "Route Group: <Event Data>">" (Event Data contains group name) |
| Mediation Rule Match | IR Data, ER Data, IA Data, EA Data | Gray bubble on DSR node | "Mediation-Rule" | "Matched Rule: <Event Data>" (Event Data contains rule name) |
| Request Rerouted | IR Data | Gray bubble on DSR node | "REQ-Rerouted" | "Attempts: #<Event Data>" (Event Data contains attempt #) |
| Answer Timeout | IA | Arrow from source node to destination node | "Answer Timeout" | No tooltip |
| Answer Matching Failed | IA Data | Red bubble on DSR node | "ANS-Match-Failed" | |
| Address Resolution Match | App Data | Address Resolution Match appends a text to the corresponding Application bubble. | "Address Resolution: <Event Data>" (Event Data formatted as a list) | |
| Routing Exception | App Data | Routing Exception appends a text to the corresponding Application bubble. | "Routing Exception: <Event Data>" | |
| DP Query Sent | App Data | DP Query Sent appends a text to the corresponding Application bubble. | "DP Query Sent: <Event Data>" (Event Data formatted as a list) | |
| DP Response Received | App Data | DP Response Received appends a text to the corresponding Application bubble. | "DP Response Received: <Event Data>" (Event Data formatted as a list) | |
| DP Query Failure | App Data | DP Query Failure appends a text to the corresponding Application bubble. | Appends red text "DP Query Failure: <Event Data>"(Event Data formatted as a list) | |
| DP Response Timeout | App Data | DP Response Timeout appends a text to the corresponding Application bubble. | Appends red text "DP Response Timeout: <Event Data>"(Event Data formatted as a list) | |
| SBR Query Sent | App Data | SBR Query Sent appends a text to the corresponding Application bubble. | "SBR Query Sent: <Event Data>" (Event Data formatted as a list) | |
| SBR Response Received | App Data | SBR Response Received appends a text to the corresponding Application bubble. | "SBR Response Received: <Event Data>" (Event Data formatted as a list) | |
| SBR Query Failure | App Data | SBR Query Failure appends a text to the corresponding Application bubble. | Appends red text "SBR Query Failure: <Event Data>" (Event Data formatted as a list) | |
| SBR Response Timeout | App Data | SBR Response Timeout appends a text to the corresponding Application bubble. | Appends red text "SBR Response Timeout: <Event Data>" (Event Data formatted as a list) | |
| Message Copied | IA | MSG-Copied bubble appears on DSR node | "MSG-Copied" | No tooltip |
| Copied Message | IG (Internally Generated) | Copied-MSG bubble appears on DSR node | "Copied-MSG" | Copied Message ID appears in the tooltip |
| Message Copy Triggered | IR, ER | MC-Triggered bubble appears on DSR node | "MC-Triggered" | No tooltip |