| Oracle® Communications Operations Monitor User's Guide Release 3.3.80 E57622-01 |
|
|
PDF · Mobi · ePub |
| Oracle® Communications Operations Monitor User's Guide Release 3.3.80 E57622-01 |
|
|
PDF · Mobi · ePub |
This chapter describes how to work with the Oracle Communications Operations Monitor graphical user interface.
This section provides an introduction to the web interface, requirements, and frequently used interface elements of Operations Monitor.
Operations Monitor runs in any major web browser without extra plug-ins or add-ons.
Note:
Operations Monitor does not require Flash, Java or Microsoft Silverlight.The following list contains the web browsers in which we regularly test the web interface:
Internet Explorer: version 8 or higher.
Firefox: 1.5 or higher running on any operating system (Windows, Mac, Oracle Linux).
Safari: any version, including Safari for the iPad.
Google Chrome: any version.
Opera: 9 or higher running on any operating system (Windows, Mac, Oracle Linux).
In order to use the web interface of Operations Monitor, you must enable Javascript. It is recommended that you enable HTTP cookies for features such as remembering login credentials and the state of tables.
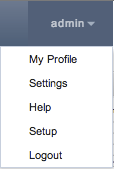
The left side of the Operations Monitor user interface is the main menu. This navigation bar allows access to many of the features of Operations Monitor. The upper-left region of the Operations Monitor user interface contains several interface traffic indicators. The upper-right corner displays the currently-logged in user and the following options (see Figure 3-1):
My Profile for user settings.
Settings for administrative features.
Help for the online manual.
Setup to access PSA.
Logout to sign-out.
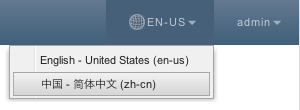
In the upper-right corner of the Operations Monitor user interface, the current code for the selected language code is shown. Clicking it will show a menu with the available languages, as shown in Figure 3-2.
When you click an element in the main menu, a panel appears in the center of the browser window. This panel is a user interface element that displays data.
Many panels can be added to your dashboard for at-a-glance viewing. For more information, see "Dashboard".
To collapse panels and display titles only, you can click the up-arrow in the upper-right hand corner.
Another common user interface element is the tab panel. An instance of this element is depicted in Figure 3-3.
In the title bar of each panel is a gray i-symbol. This is the information box. When you hover over the information box, a question mark symbol appears and a tooltip provides a brief description of the panel. When you click the information box, the corresponding section of the user manual appears in a new browser window or tab describing the panel and its functions.
Other user interface elements support tooltips. Hovering over an element with the mouse pointer often brings up a small box explaining the element underneath.
You may encounter modal windows overlaid on the user interface, similar to the windows of your desktop environment. These windows can be dragged by their title bar, and closed by clicking on the x-symbol or pressing the ESC key. These windows also contain Help and Close buttons at the bottom. The Help button opens the online Help in a new window, describing the current page and its functionality.
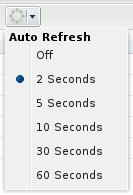
Some areas of the interface contain a Refresh button that controls the update interval for the content of the widget. It is identified by a circle of dots (flashing during refresh). Clicking the button once refreshes the corresponding content. It also contains a drop-down list on the side to set the interval for Automatic Refresh as illustrated in Figure 3-4.
The tables used in the Operations Monitor user interface offer some features to make the data most useful to you.
To adjust tables, hover above a column header. A down-arrow appears on the right side of the column header. To access the table menu, click the down arrow. The table menu options may differ depending on the data presented in the table.
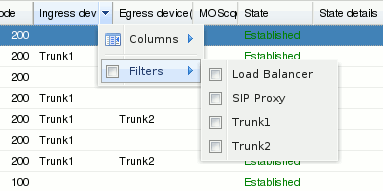
Some tables support filters. If a table column can be filtered, the column menu contains a Filter submenu as illustrated in Figure 3-5.
Below are possible options in the filters sub menu (depending on the column type):
String Filter
Filters the table to display rows that contain the entered value as a sub-string. The input value is not exclusive. This filter menu provides a text field for entering the string.
Numeric Comparison Filter
Restricts the table to rows where the comparison of the column value with the entered numeric results is 'true'. This filter menu provides three fields, one for each of the supported operators (>, <, =). The = field cannot be used simultaneously with any of the other fields.
Date Comparison Filter
Restricts the table to rows where the column value in the selected date range. This filter menu provides three items for choosing a date (Before, After, On). With Before and After you can select the rows where the timestamp of the column values lies before and/or after the chosen day. With On you can select the rows of only the chosen day.
List Filter
Restricts the table to rows where the column values contains the selected value. This filter menu provides a list of possible values, which you can choose by selecting or deselecting the corresponding check box.
You can choose to hide certain columns in each table. Every column drop-down menu contains a Columns submenu that lists all available columns for this table. Select or deselect the check box to the left of each entry to show or hide the corresponding column.
Note the paging toolbar at the bottom of tables as illustrated in Figure 3-6. The presence of this toolbar means that the table offers page-wise access to its data. The paging toolbar displays the total number of pages, and to the right, the total number of items in the table.
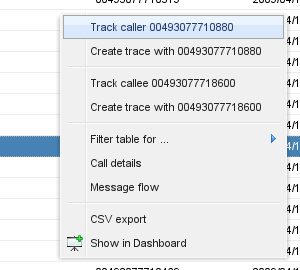
Tables such as Recent Calls, Registrations, and the user table in User Devices have context menu entries to quickly trace or track a user (see Figure 3-7). You can right-click on a table row to track or trace the user (in the Recent calls table, you can quickly inspect both the caller and the callee). For more information, see "Recent Calls", "Registrations" and "User Devices".
You may encounter metric charts that display values of a numeric property over a certain time span. Metric charts provide two important features:
Adjusting the temporal resolution.
Panning of the visible portion along the time line.
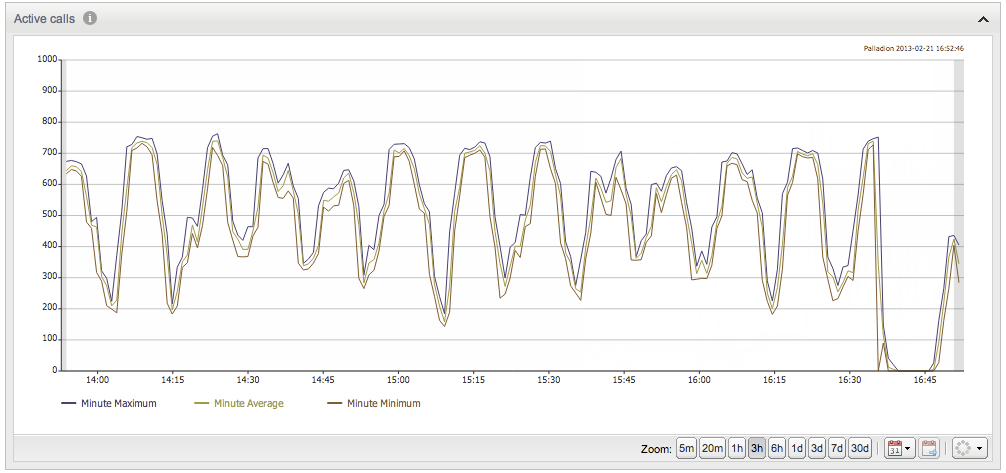
A basic metric chart is shown in Figure 3-8:
Adjusting the temporal resolution can be achieved using the Zoom buttons in the bottom-right corner of the chart. The buttons correspond to resolutions of five minutes to thirty days.
Operations Monitor's time-lined charts can be updated by clicking the Refresh button. This button also offers Automatic Refresh functionality from the button's drop-down list. For more information, see "Refreshers".
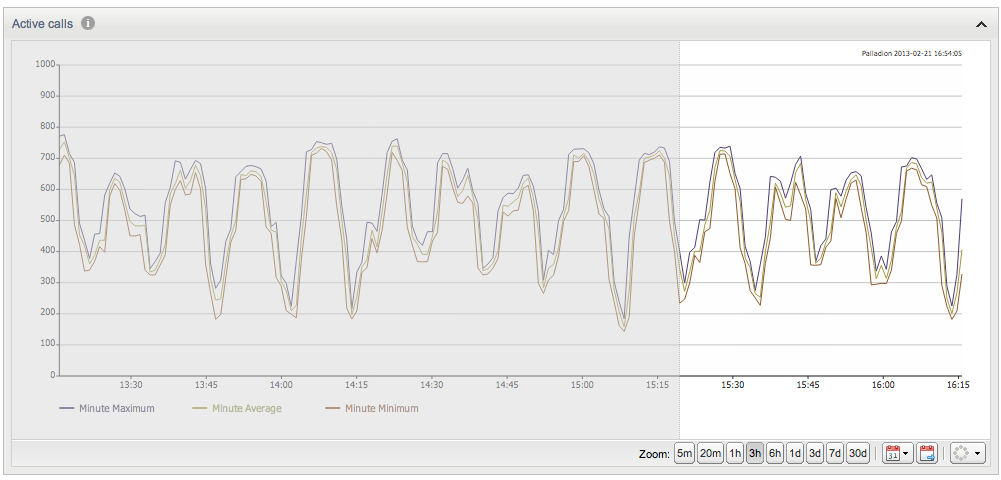
To pan the chart, click and drag the mouse pointer inside the chart itself. When you click the chart and drag it to the right, the visible area will be shifted further left (further in the past) on the time line. When you drag it to the left, the visible area is shifted further right (nearer to the present) on the time line. While dragging, a gray overlay indicates the direction of the chart, and how far on the spectrum you are dragging. Panning is shown in Figure 3-9.
Note:
Panning stops the automatic refresh of a chart. Automatic refresh is re-enabled after clicking on the Go to now button at the bottom of the chart.In Operations Monitor, a message flow is a sequence diagram of sniffed messages. You can create a message flow for calls and registration events. To create a message flow, right-click on a call table to open its context menu, and then click Message flow.
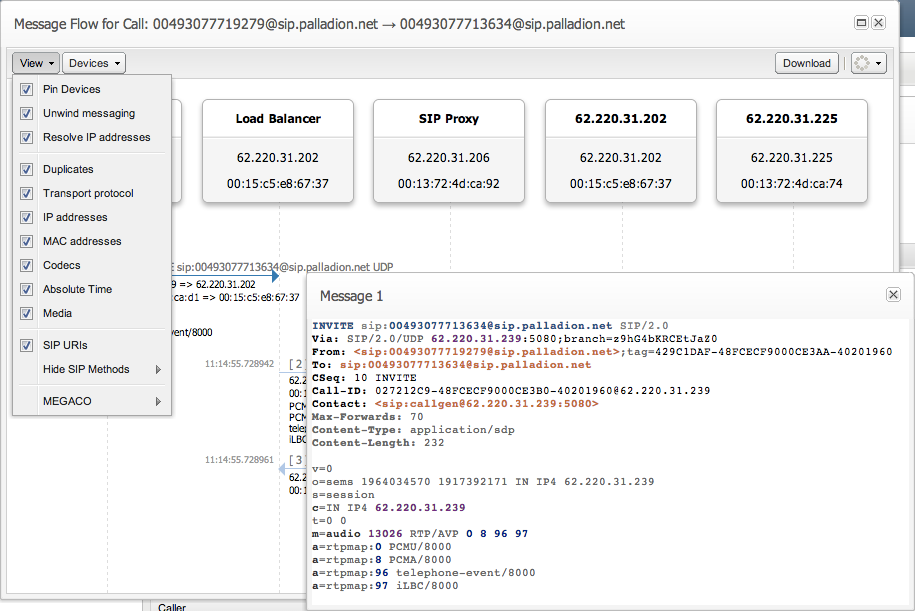
The message flow (see Figure 3-10) displays the protocol messages that have been exchanged between the platform devices. These hosts must be configured properly in "Platform Devices".
Figure 3-10 Message Flow Window for a Call
Message flow windows are movable in order to be compared to other message flows side-by-side. Usually the flow image is bigger than the window. To properly display a message flow:
Resize the window by dragging its borders, or click on the maximize icon in the window's title bar to view a larger portion of the message flow.
Move the message flow by using the window's scroll bars or the mouse wheel.
Drag the flow using the mouse.
Minimize the window using the minimize icon to keep several flows open at once.
Save the flow on your computer by clicking on the Download button.
Refresh the flow using the Refresh button in the right-hand corner.
To view individual protocol messages (for example SIP, RTP, Megaco), click on the protocol's corresponding arrow in the message flow. The protocol message appears in a window. You can drag the protocol message windows to rearrange them. You close an individual message by clicking the X box in the upper-right corner, or close all messages of a flow at once using the Hide messages icon in the message flow's toolbar.
Note:
The maximum number of messages for a flow is limited. You can change the limit value in System Settings. For more information, see "System Settings".To customize the message flow display, click the View drop-down menu from the window's toolbar and select one of the following options:
Pin Devices
When scrolling down a large message flow you can lose track of which message corresponds to a device. Pinning the devices ensures that they are always visible at the top of scrolling area.
Unwind Messaging
By default, each platform device appears only once and an arrow is drawn for each message that passes between these hosts. When several messages are exchanged between two particular devices, it becomes difficult to distinguish the call legs. When this option is selected, each call leg is drawn separately, resulting in a wider diagram. Hosts that appear multiple have a number suffix displaying the number of times the host appears (number).
Resolve IP Addresses
When enabled, it does a reverse DNS lookup on the IP addresses of devices.
Duplicates
In the case of retransmissions only one SIP message appears. To see retransmissions you can select this option and all duplicate messages will be displayed.
Transport Protocol
Displays the transport protocol (TCP or UDP).
IP Addresses
Shows the IP addresses for the source and destination of the message.
MAC Addresses
Selecting this option displays the MAC addresses for the source and destination of the message. In a scenario where one server is realized by several machines, this can be used to determine which machine was used to process the request.
Codecs
Displays the media codecs of the caller and the callee. After the INVITE is completed, the codecs are grouped when the codecs are the same for the caller and callee.
Absolute Times
By default, the information below a message arrow shows the time that has passed after the first message was seen. Check this option to show the time and date for each arrow.
Media
When enabled, protocol messages for media transport like RTP will be shown in addition to the signaling. For some protocols, the raw message is not available.
DTMF Events
When enabled, protocol messages for RTP events of type DTMF will be shown. The DTMF event will show the name of the tone as well as the code for it. For tones 0-9 the name and the code are the same.
Example
DTMF Event '2' (2)
DTMF Event '#' (11)
Requires the permission "View DTMF tones" to be visible.
SIP URIs
When selected, the message arrows display the recipient's URI.
Hide SIP Methods
This submenu allows you to hide certain types of SIP messages based on their method. For example selecting OPTIONS in this submenu will remove all SIP messages from the diagram that have the method OPTIONS.
MEGACO
Controls the visibility of various MEGACO message properties.
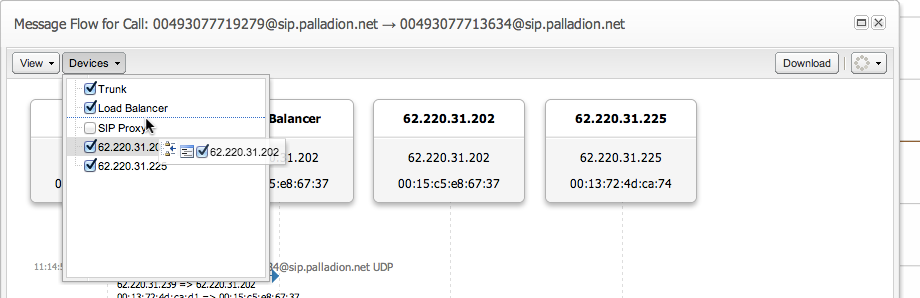
The visibility and position of a device can be changed in the Devices menu (see Figure 3-11). Check boxes control whether the device is displayed. Device position can be changed by dragging and dropping the device into a new position in the menu.
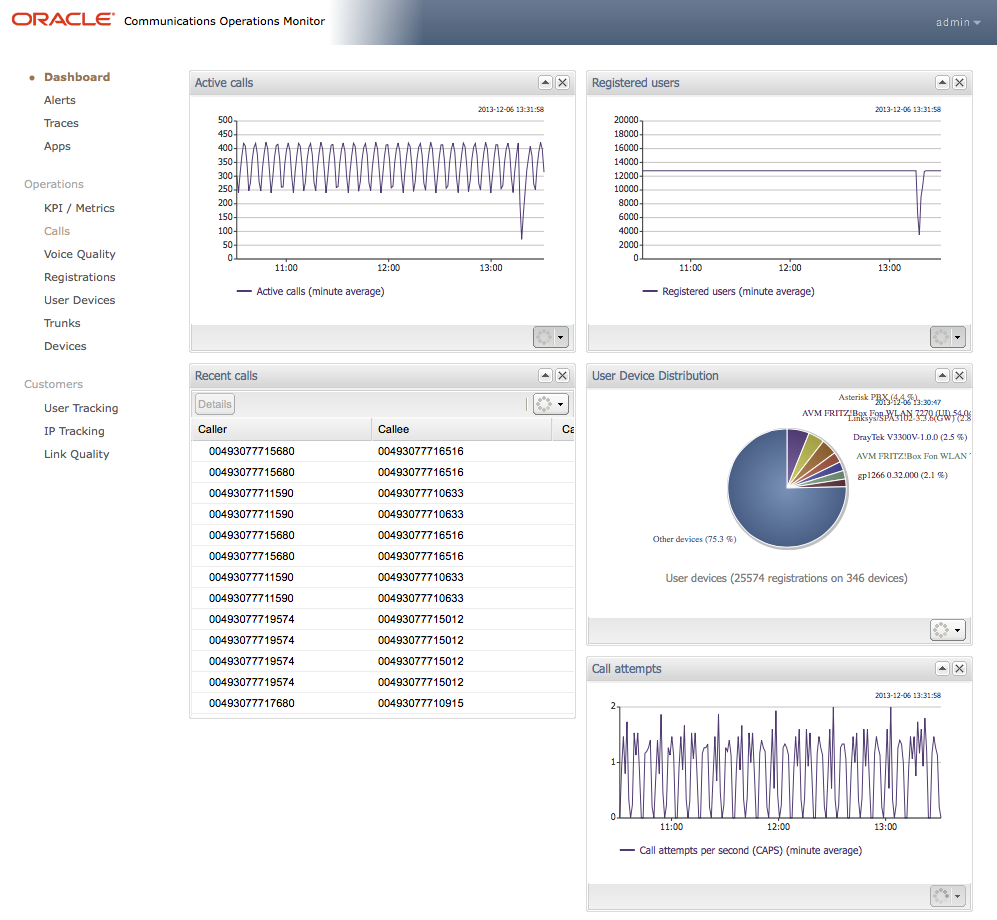
The Dashboard is Operations Monitor's flexible entry page (as illustrated in Figure 3-12). It allows you to view the information at a glance that is most important to you. Reduced panels are defined for many features of Operations Monitor, and can be displayed on the Dashboard.
Types of panels that may appear on your dashboard are:
Counter chart (see "KPI/Metrics")
Recent calls (see "Calls")
Registrations (see "Registrations")
User devices pie chart (see "User Devices")
Voice Quality (VQ) overview chart (see "Voice Quality")
Alerts (see "Alerts")
These panels come in variants. For example, you can display a Recent calls table only for calls passing through a certain platform device.
Each Operations Monitor user can define their own Dashboard layout. The default Dashboard layout contains four panels:
Registrations Counter
Active Calls Counter
Recent Calls table
User Devices Chart
Panels can be added, removed, and rearranged.
You can add Dashboard panels from the Dashboard page or from the Operations Monitor pages, which provide information that you would like to display on the Dashboard.
To add a panel directly from the Dashboard page, right-click on the Dashboard to get a context menu, and choose Add a panel.... A pop-up window appears that provides dashboard panel options.
To add a dashboard panel from another window in Operations Monitor, click the Show in Dashboard icon (shown in Figure 3-13). This button is located throughout the Operations Monitor web interface. For more information, please refer to the documentation sections referenced beside the dashboard panel types listed above.
Operations Monitor has a notification system to warn you of important events called alerts. You can prioritize alerts and configure them to trigger certain actions. The Alerts page displays all alerts that have been raised. The following alert types are supported:
Generic Metrics
Statistics metrics exceed or fall below certain thresholds.
Device/Tag Metrics
Statistics metrics exceed or fall below certain thresholds.
Metric Baseline Deviation
A metric deviates from the average by a certain factor.
User Devices
A certain user device is detected by the system.
Voice Quality
The quality for a percentage of calls falls beyond a MOS threshold.
Device Monitoring
A device is down.
Operations Monitor messages
Messages about error conditions in Operations Monitor.
Limits
An internal soft limit within Operations Monitor was passed.
Phone Number
A certain phone number placed or received a call.
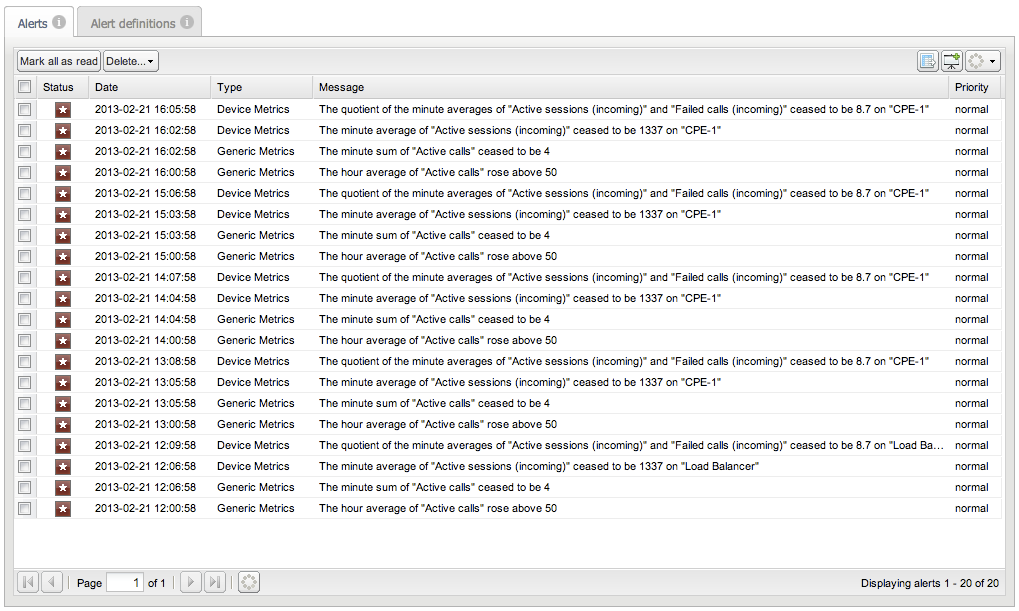
The Alerts table displays notifications. You can create or edit an alert definition in the Alert Definitions tab.
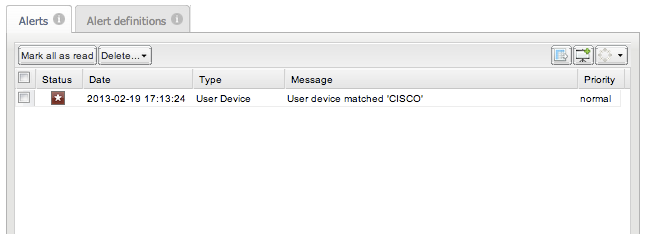
Click Alerts in the main menu to display the alerts panel, as shown in Figure 3-14.
Table 3-1 lists the Alerts panel table columns:
Table 3-1 Alerts Panel Columns
| Column | Description |
|---|---|
|
Status |
Unread alerts are marked with a red icon. Clicking on the icon toggles the status as read/unread. |
|
Date |
The date when the alert was raised. |
|
Type |
The type of the alert. This columns allows for easy filtering. |
|
Message |
The alert message explains why the alert was raised. |
|
Priority |
Setting priority ranks the alerts. The alert entries with high priority are highlighted by a red background. Low priority alerts are displayed in a lighter color. |
When you double-click an alert, a small window appears with an extended message and an offer to mark the alert as read.
The Mark all as read button respects table filters, and can be helpful when treating similar alerts. For example, to mark all statistic threshold alerts, enable Filters in the Type column and click Mark all as read. The Delete drop-down menu allows you to delete either:
Selected alerts (the check box in the first column is marked).
Alerts marked as read.
All alerts.
Upon initial installation of Operations Monitor, the only alerts raised are related to licenses. You must create Alert definitions to receive further notifications.
Note:
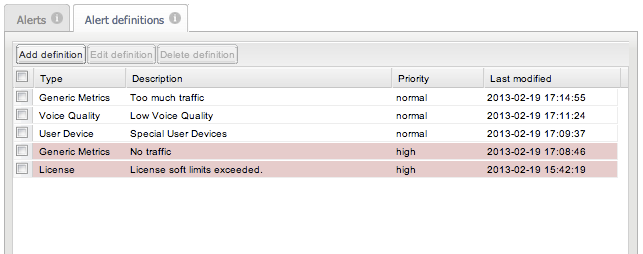
To avoid being inundated with alerts (for example Number of active calls exceeded 5000), Operations Monitor creates duplicate alerts only when the previous one has been deleted, marked as read, or when 1 day has passed (recurrence threshold adjustable via recurrent alerts threshold. For more information, see "Recurrent Alerts Threshold").Alert definitions establish which events on the system raise a notification. On the Alerts page, click the Alert Definitions tab to see a table of all definitions that have been created.
To create an alert definition:
Click Add definition, which starts the Alert Definition wizard.
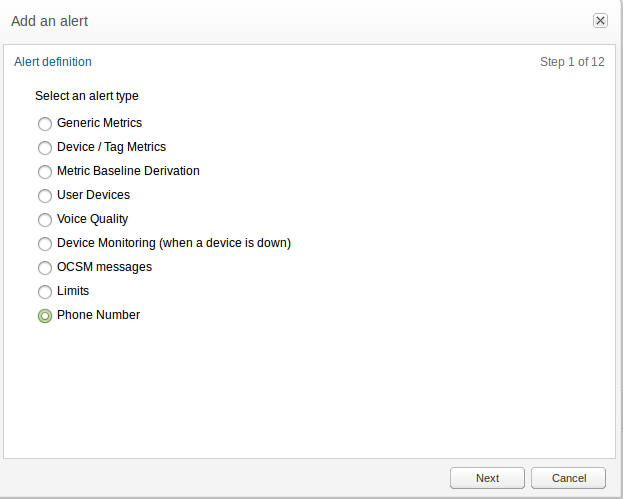
In the Add an alert page, select an alert type (see Figure 3-16). This also determines if parameters are required.
Optionally, parameters have to be provided that tell Operations Monitor when to raise an alert and of that type. Some alert types do not require parameters.
If desired, set actions to execute when the alert is raised, for example, to send an e-mail. For more information see, "Actions".
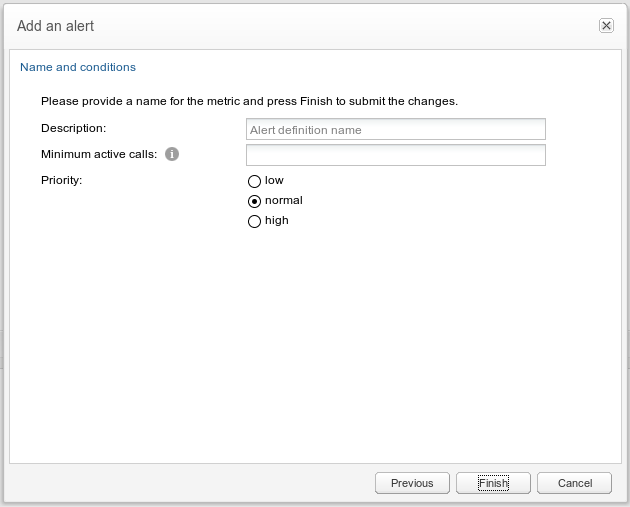
Assign an alert name and priority for the notifications raised according to this definition. For more information, see "Alert Name and Priority".
Click Finish to save the alert definition.
Operations Monitor raises an alert whenever the specified event occurs.
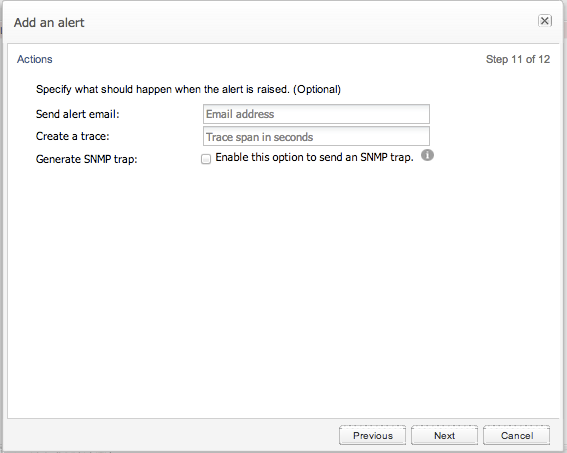
For all alerts additional actions can be configured (see Figure 3-17). All actions are optional and can be combined.
Send alert e-mail
Sends an e-mail about the alert to the specified address. An SMTP access needs to be configured before. Please check the PSA manual for more details about configuring SMTP.
Create a trace
Creates a trace of the current SIP traffic when the alert is raised. Enter an appropriate time span (in seconds) for packet capture to tell Operations Monitor how far back in time the trace should go.
Generate SNMP trap
Sends an SNMP trap to a configured SNMP target. When this is enabled, Operations Monitor alerts can be tracked and analyzed by an SNMP manager in the network. For more information, see "SNMP Options".
For all alerts a name and priority needs to be provided (see Figure 3-18). It is also possible to define a minimum number of active calls to trigger the alert.
To edit a definition, perform one of the following actions:
Select the entry and click Delete.
Double click the entry.
To delete a definition, select the entry and click Delete definition. Once an alert has been deleted, Operations Monitor no longer raises a notification for this definition.
The following sections describe the various parameters for each alert type.
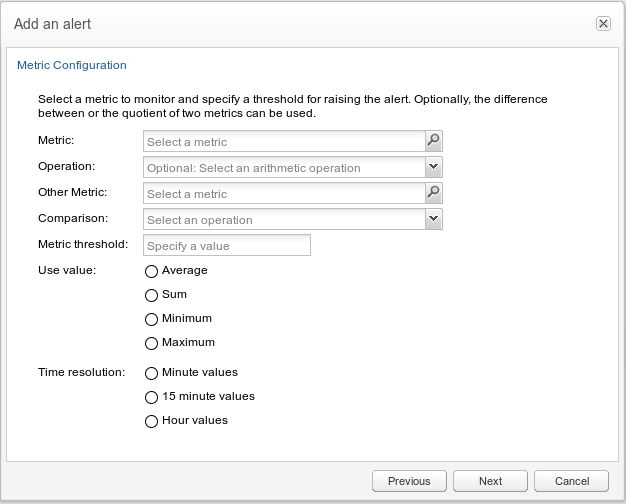
Alerts can be defined with either one or two metrics. The metrics are compared to a threshold value using a comparison operator (for example =, <, > or not).
When you input one metric, the alert is triggered if the metric exceeds or falls below the given threshold value, depending on the comparison operator provided. This is suited for alerts such as 'The number of registered users exceeds 20,000.' In this example, an alert is sent when the number of registered users exceeds 20,000. If you would like a second alert to notify you if the value falls below 20,000, you must create a second definition.
When you provide two metrics, Operations Monitor considers the difference of the two metric values to a given threshold value, and therefore allows for more sophisticated alerting scenarios. For example, a statistics metric value deviates too much from its average value.
The example in Figure 3-19 shows the metric configuration of the alert scenario 'The number of registered users fell by 1,000 in the last week'. For using this alert definition, you must set the regular value for the metric as well as its average metric. For more information, see "KPI/Metrics".
Figure 3-19 Defining Alerts Based on Metrics
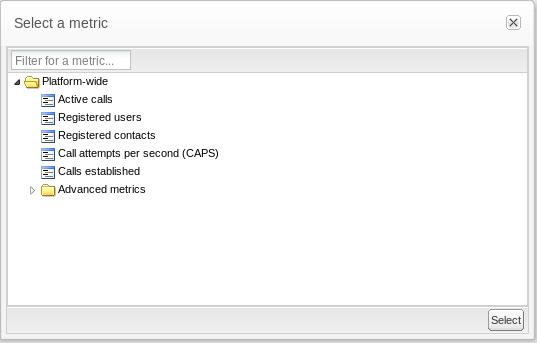
Clicking on the Choose button for a metric displays the metrics dialog box (see Figure 3-20), where you can choose a metric:
It is possible to define an alert that triggers when the value of a metric exceeds or falls below a given threshold on any trunk. You must select the alert type Device Metrics for All Trunks. The metric in question needs to be added to all trunks first. For more information, see "Adding Metrics to All Trunks".
If the metric exceeds or falls below the threshold on multiple trunks, the alert is triggered for each trunk and will thus have multiple independent entries on the alerts table.
Operations Monitor keeps track of all user devices that are registered on the platform and raises an alert depending on the desired option:
If a list of disapproved devices has been configured in User Devices, and Operations Monitor notices a user device from that list, an alert is sent. This option is recommended if User Devices is frequently updated so that the list can be centrally managed there. For more information, see "User Devices".
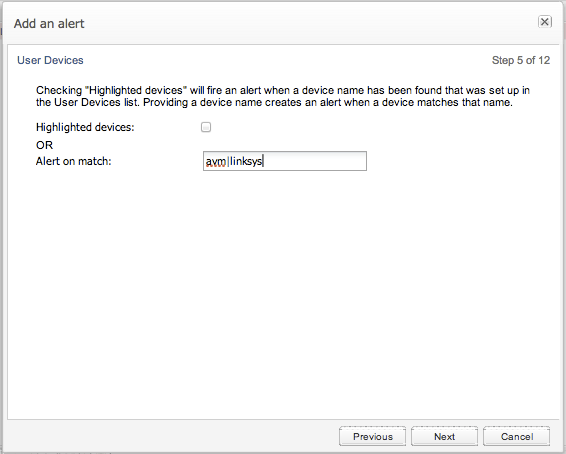
This option is intended for a more ad-hoc tracking of user devices. A regular expression can be entered to raise an alert when a matching user device is found. For every expression to track you need to add another alert definition.
Figure 3-21 shows an example configuration for detecting any AVM or Linksys devices.
Figure 3-21 Defining Alerts Based on Devices
This alert type refers to Device Monitoring and does not need additional parameters. Whenever a monitored device is down, an alert is raised. Only one alert definition of this type is needed. For more information, see "Device Monitoring".
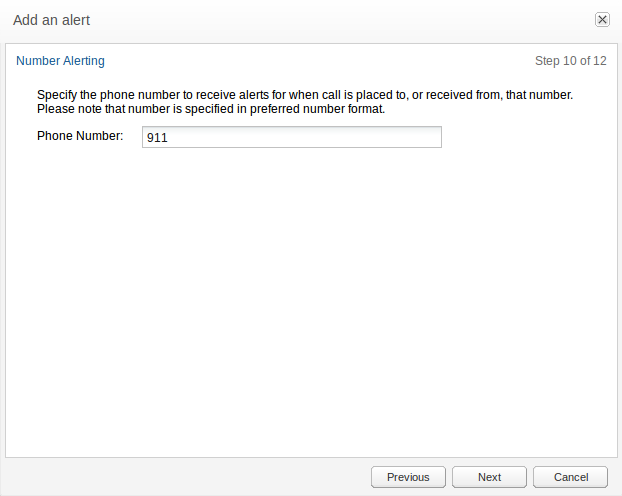
The Phone Number type provides the possibility to alert on a specific phone number. The alert will be triggered when a call to or from a configured number is detected. To use this alert type the user needs to have the Number Alerting permission (see Figure 3-22). Without this permission the Phone Number option will not be shown.
Phone numbers are configured in preferred number format. If the Use User Domains system setting is set to true then a phone number should be provided as a SIP user, that is, with a domain name: for example, 00403077811-call@example.com. If not, the phone number should be provided without domain (and without the @ sign). For more information, see "Use User Domains".
Note:
Only one number per alert can be defined. No wild cards are allowed.A good strategy for setting up a number alert is to place a phone call to the desired number and look in the calls grid for the callee to get the exact SIP address/phone number to use for the alert definition.
The search for predefined phone numbers happens two times per minute, with calls that are at least 10 seconds old (in the early stages of a call, not all information needed is available). This means that a call in best case is detected after 10 seconds, in worst case after 40 seconds.
Figure 3-22 Configuring the Phone Number for Alerts
The Traces page allows you to capture, store and download packet traces of the SIP traffic. Downloads are done in the industry-standard PCAP format, which contains the complete messages as monitored on the network.
The PCAP file format can be interpreted by most of the available protocol analyzers, including open source tools. Any stored message contains TCP/UDP headers, an IP header, and layer 2 headers, as well as the time stamp at which Operations Monitor received it. All messages are written to the disk before any processing is performed. The filter defining, which traffic the traces, can be set in the Signaling Protocols section in the Platform Setup Application.
Packets are captured from the moment a trace is started. With Operations Monitor, you can also trace events in the recent past. For more information, see "Packet Buffer".
You can restrict traces to a single SIP user or an IP.
Note:
If you restrict the traces to a SIP user, only UDP packets will be captured.In order to create traces with packets received prior to the current time, Operations Monitor keeps an in-memory, rotating raw packet buffer with all the messages captured. The default size of this buffer is 1 GB including the message overhead. The buffer size system option allows you to change the size of this buffer.
The Traces page contains three panels: the first shows information about the raw packet buffer, the second panel can be used for creating a new trace, and the third panel shows the currently running and finished traces.
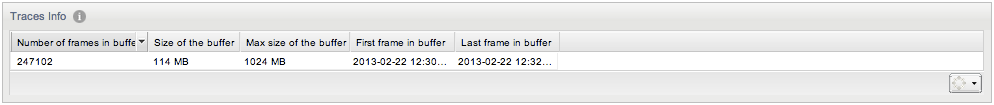
The Traces Info panel displays details about the state of the raw packet buffer:
Number of frames in buffer
The total number of frames that are currently in the in-memory buffer.
Size of the buffer
The total size in bytes of the raw packet buffer, including the overhead needed for indexing the messages.
Max size of the buffer
The maximum size in bytes to which the buffer can grow. When this limit is reached, old packets are discarded.
First frame in buffer
The timestamp of the oldest packet still in the buffer. Traces cannot capture messages before this point in time.
Last frame in buffer
The timestamp of the newest packet in the buffer. This information is provided in order to approximate the capacity of the buffer in seconds.
The Signaling Traffic Capture panel allows you to capture signaling traffic and save the data to a PCAP file. If you hit Start Capture immediately, a trace begins with default settings. This provides a trace for activity in the last five minutes including non-call related messages such as OPTIONS and PUBLISH.
This panel allows you to configure time ranges, and filter SIP traffic by user or IP.
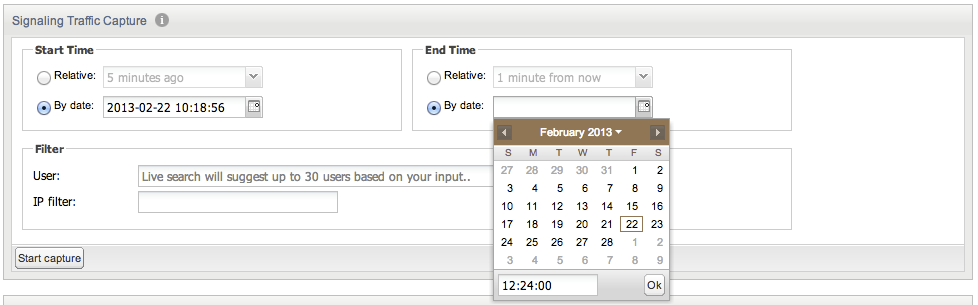
You can specify the Start time, End time, and the Filters used for a new trace in the Signaling Traffic Capture panel. Start and end times can either be set relative to the current time or by using absolute times. If the start time lies before the current time, the trace contains packets from the raw buffer. If the end time lies after the current time, the trace is started and write the packets received until the selected end time or until the user stops the trace.
A Filter restricts captured messages to a single user, a single Operations Monitor network port, an IP address, or a combination of these. The User field has a live auto-complete feature: while typing the first characters of a user name or number, Operations Monitor suggests user names and numbers containing those characters from the set of known users.
The number of traces running simultaneously is limited to 3 by default and are configurable depending on the license. If the limit is exceeded, an error message is displayed.
Figure 3-24 shows a new trace created for a past transaction using absolute times (from 10:18:56 to 12:24:00). No filter is selected: all messages received by Operations Monitor in the given time interval are included in the trace.
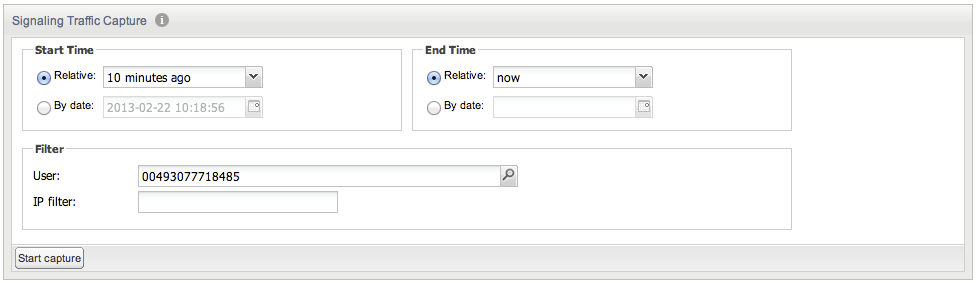
In Figure 3-25, a new trace is created for all messages from user '00493077718485' from the last 10 minutes. Here, we use a relative start and end time.
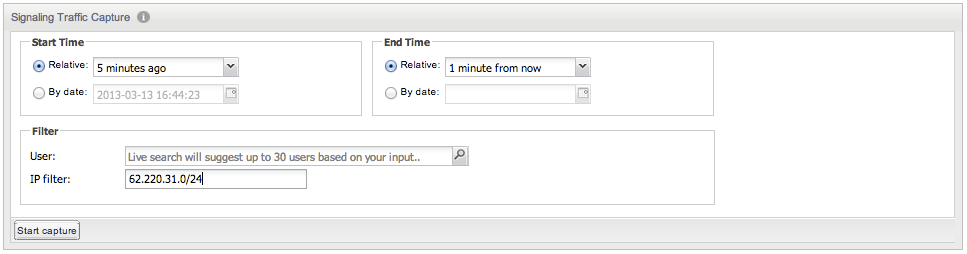
Figure 3-26 illustrates a trace created for all messages, which have either the source or destination IP address in the 62.220.32.0/24 network range. The IP filter field accepts both a host IP address in dotted format (a.b.c.d) or a sub-network address with the net mask appended(a.b.c.d/e).
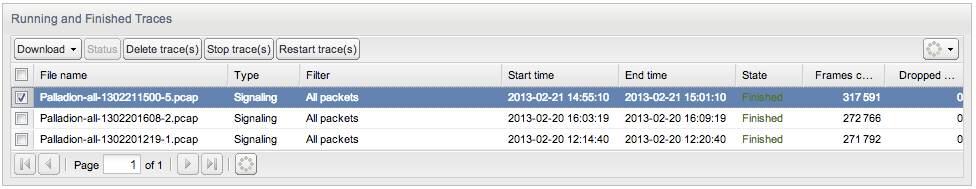
The last panel on the page lists all traces that are stored on the disk and offered for download. Traces that are currently in progress are also listed and may be stopped before their scheduled end time. Figure 3-27 illustrates the panel.
The following information is presented for every trace:
File name
The name of the PCAP file on disk. This will be also used as the proposed filename when downloading the trace.
Filter
Short description of the filter used for the trace.
Start time
The date and time the packet trace began. This can lie before the time at which the user has requested the trace.
End time
The date and time when the trace was stopped, or the time it is scheduled to stop in the case of running traces.
State
The current state of the trace is one of the following:
Running: Trace is in progress.
Finished: Trace has finished normally because its end time was reached.
Stopped: Trace was stopped by the user before its end time was reached.
Error: Trace failed to complete, possibly due to an internal error or an Operations Monitor core restart.
Frames captured
The number of packets stored in the trace. For running traces, this value is the number of packets written thus far.
Size
The size in bytes of the capture file.
All columns of in the Running and Finished Traces can be sorted. For example, you can click the Size column to sort the traces by size.
By default, the table is refreshed every five seconds, which can be changed using the Refresher's drop-down menu at the top right corner of the table.
When you select a trace from the list, the following actions are available from the toolbar above the table:
Download
Downloads the selected trace. This only works when selecting one trace at a time. Traces are compressed in a .gzip format in order to speed up the download.
Delete trace(s)
Deletes the selected traces from Operations Monitor storage.
Stop trace(s)
Stops the selected traces if they are currently running.
Restart trace(s)
Starts a trace with the same parameters as the selected trace, but with the time shifted to present. This only works for traces with relative start and end times.
Note:
The total size of storage space, which all traces can use is limited. When the space is full, the oldest trace is automatically deleted. The default value of this limit is set to 40 GB on a standard Operations Monitor server, with the traces being stored in a compressed form.The Packet Inspector page allows you to examine and download arbitrary network traffic captured on the probes. Downloads are done in the industry-standard PCAP format, which contains the complete messages as monitored on the network.
The PCAP file format can be interpreted by most of the available protocol analyzers, including open- source tools. Any stored message contains the full raw frame including IP and TCP/UDP headers, as well as the timestamp when the message was received.
The filter that determines which traffic is captured and available for searching can be set in the Signaling Protocols section in the Platform Setup Application. Packets are captured from the moment a probe is set up. It is important that this filter is somewhat strict, comparable to the default. In particular, RTP recording via the packet inspector is not supported.
The Packet Inspector page consists of a form where the search parameters are specified, and a panel listing the preview of the results of a search.
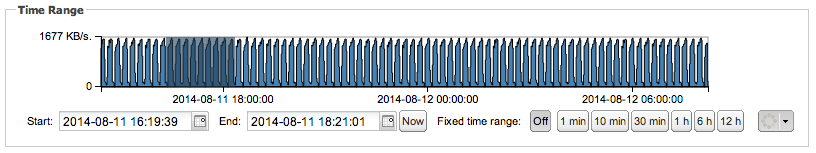
The main display chart shows the amount of traffic is received each second. It can be used for selecting a time range using the mouse. Operations Monitor will search the packets captured during the selected interval of time.
Search form options:
In order to select a time range you may either use the mouse to select, move or resize a selection in the graph or use the controls below to select a time range (see Figure 3-28). Please note that if you select a fixed time range and change the start- or enddate the respectively other field will be changed accordingly.
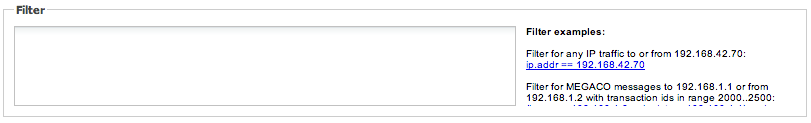
If you wish to further filter the result set you may enter filters into this text area. See Filter examples in Figure 3-29 and "Query Examples" for usage examples.
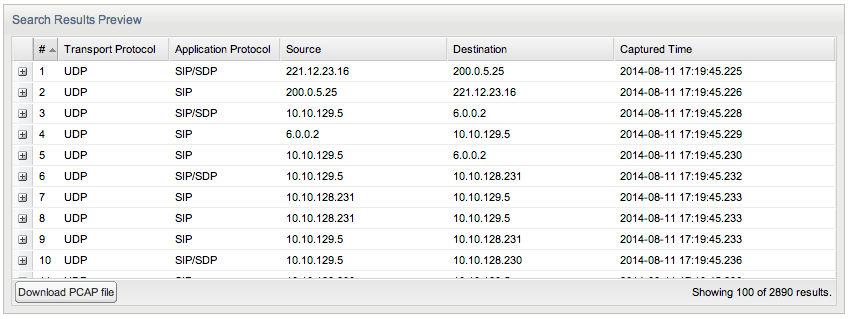
The results panel shows a preview of the search results (see Figure 3-30). The preview may be sorted using each column. Packet data details can be browsed expanding its corresponding row. In order to download the complete set of search results please use the Download PCAP file button on the bottom of the panel.
Query examples to be used in the filter field:
Filter for any IP traffic to or from 192.168.42.70:
ip.addr == 192.168.42.70
Filter for MEGACO messages to 192.168.1.1 or from 192.168.1.2 with transaction ids in range 2000..2500:
(ip.src == 192.168.1.2 or ip.dst == 192.168.1.1) and megaco.transid > "2000" and megaco.transid < "2500"
Filter for ISUP to the device with point-code 1111 calling number 1234567:
mtp3.dpc == 1111 and isup and e164.called_party_number.digits == "1234567"
Not all filter expressions work with fragmented packets. To get all packets, use an expression like:
sip.Call-ID == "910820420140505605616932@172.19.235.6" || ip.flags.mf==1
Note:
The total size of the storage space that Packet Inspector can use is limited. The default value of this limit is 90% of disk space for each configured probe. Furthermore, there is a limit of three concurrent queries for each |product| instance running.Apps allow you to extend Operations Monitor's reporting capability. You can upload an app to customize the queries and report information provided by Operations Monitor. Operations Monitor provides a number of default apps, which can be accessed on this page. For information on how to develop new extension apps for Operations Monitor, see "Implementing Apps".
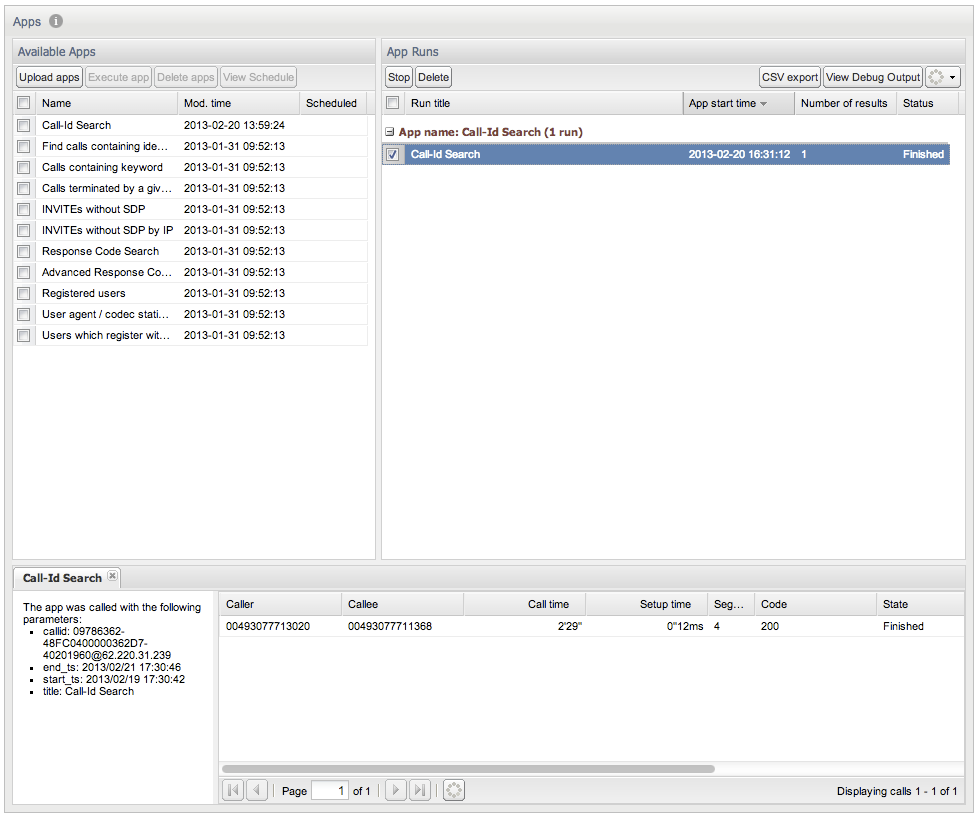
The Apps page (see Figure 3-31) is divided into three sections:
The upper-left area lists Available Apps.
The upper-right area displays outputs of previous App Runs.
The bottom area displays the results of the selected App Run. It is empty when you first access the page.
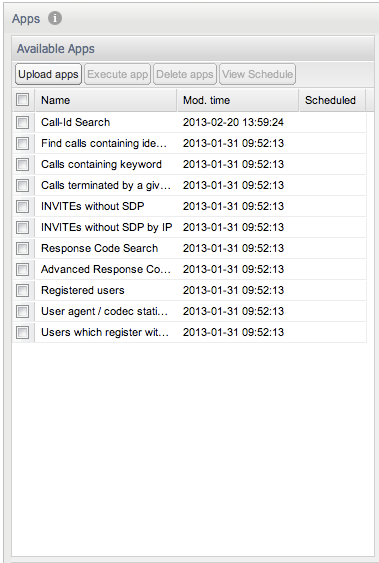
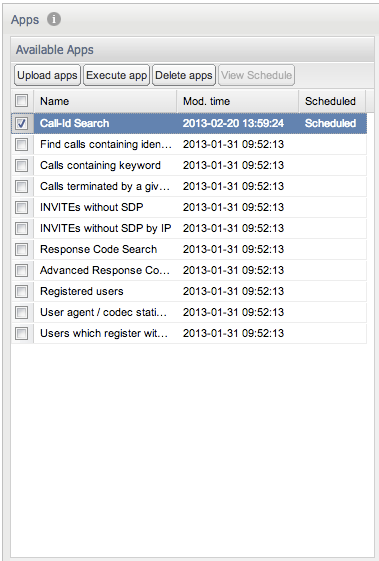
The Available Apps table (see Figure 3-32) contains the columns Name and Mod. time by default. The first column displays a name for each application, the second column displays each apps modification time. The Scheduled column marks apps that are scheduled to run at a certain point in time. Additionally, the Id column can be enabled, which displays a unique identifier for each app. This is useful when you want to access the application using the remote procedure call functionality described in section "Remote App Procedure Calls" of this manual.
You can upload new apps to Operations Monitor in the Available apps table. Click Upload app to open a dialog box to search for an app archive on your computer and upload it to Operations Monitor. The procedure for creating an archive is described in the section "Implementing Apps".
Note:
In order to protect the security and the performance of the system, you can only upload apps signed by Oracle. If you need a new app, please contact your Oracle representative for help.The Available apps section also allows you to start any app that is already present on the system. Starting an app requires you to enter any parameters that the app defines.
To start an app, select it in the table and click on the Execute app button. A dialog appears that allows you to enter the app parameters. Every app has a title parameter. The sole purpose of the title parameter is to distinguish between different app runs of the same app in the App runs table. Click Execute in the parameter entry dialog to go to the App runs table. Execution also starts when a user double-clicks one of the available apps.
There are limits for simultaneous execution of scripts and for the maximum debug output that an script can generate. They are defined by the Maximum Simultaneous Script Runs and the Maximum Script Output Size system settings. For more information, see "Maximum Simultaneous Script Runs" and "Maximum Script Output Size".
You can also schedule a repeated execution of a given app. For more information, see "Scheduling App Execution".
The table entitled Available apps allows you to delete apps from Operations Monitor. To do this, select the app you want to delete in the table and click the Delete app button. After confirmation, the selected app is deleted from the system.
The View Schedule button displays the scheduling configuration for a given app: the cron expression which determines when this app is triggered, the e-mail address to notify, and the option to attach the result as a csv file.
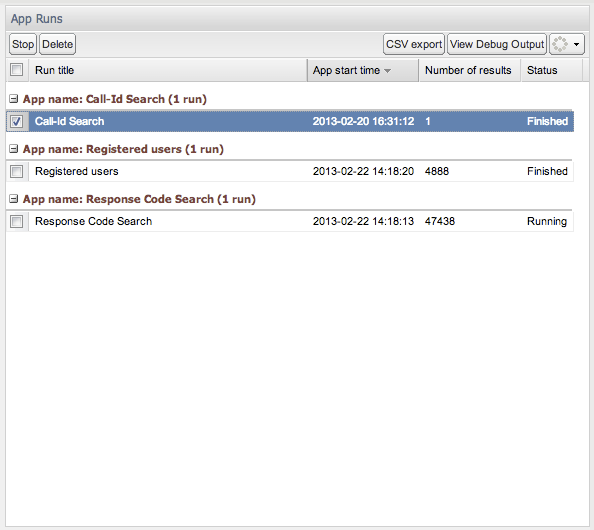
The App Runs table (see Figure 3-33) displays four columns by default:
The Run title column displays the Run title parameter that was entered when starting the app.
The App start time column displays the start time of the app.
The Number of results column displays the number of results that the app reported. This column updates as the app run proceeds.
The Status column displays either Starting, Running or Finished depending on whether the app run is still in progress or already finished.
Two other columns can be enabled: the Id column to display the ID of each app run, and App name to show the unaltered name of the app. The Id column is useful when you want to access the results of an app using the remote procedure call functionality. For more information, see "Remote App Procedure Calls".
Exporting the App Runs to CSV
The CSV export button lets you download the displayed items as a CSV file.
Debug App Run
The View output action opens a window in which the console output of the selected app is shown.
Stopping and Removing App Runs
The App Runs table allows you to stop an app run that is still active. To do this, select the app run you want to stop in the table and click the Stop button.
Note:
You can only stop an app run when it is in the Running state.The App Runs table can also be used to remove app runs from the system. Select an app run in the table and click the Delete... button. You can only delete app runs that are in a Finished state.
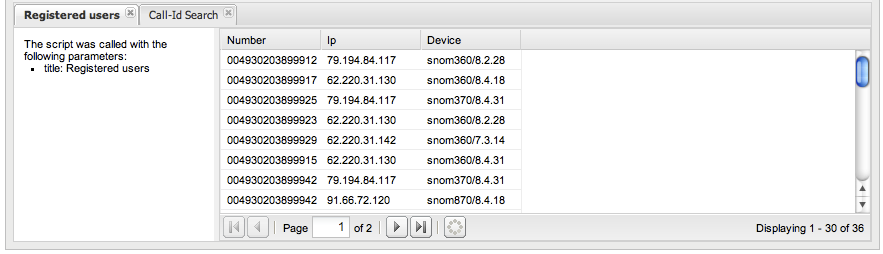
The lower portion of the Apps page displays result pages for app runs. The Apps page is empty when you first access it. When you double click an app run in the App Runs table, a new tab containing an app results view appears in the lower area.
App results view consists of a text display, which shows the parameters provided when starting the app, and a table containing the data rows reported by the app. The information in the table depends on the type of app that generated the results. Apps that search for calls use a similar results table to the calls table described in the section "Calls". Similar to the Recent calls table, you can double click on a row to get more detailed call information. This type of results table is shown in Figure 3-34.
The results page varies for each app. Multiple app results can be displayed simultaneously, and a new tab is opened in the lower portion for each.
Apps can be scheduled to run periodically.
To set up an app schedule:
Select the app from Available Apps and click the Execute App button.
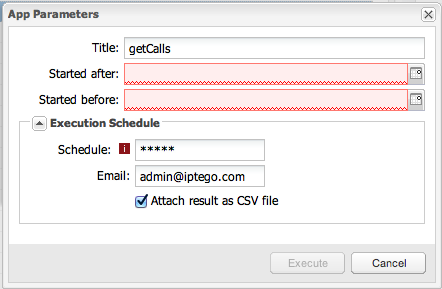
In the App Parameters dialog box, click on the Execution Schedule arrow to expand and show the scheduling options (see Figure 3-35):
The Schedule itself must be supplied as a cron expression. For more information, see "Cron Expressions".
Optionally, an email address can be provided for notification of app completion. The results of the execution may be attached to this email as a CSV file. Each execution of a scheduled app will also always appear in the View App Runs. For more information, see "View App Runs".
Multiple schedules can be defined for each app. To avoid schedules with a high frequency monopolizing resources, the system limits the number of stored app runs. This is defined by the Maximum Stored Script Runs system setting. For more information, see "Maximum Stored Script Runs".
Once a schedule has been set it can be deleted from the schedule list view. Select the app and click the Delete apps button in the Available Apps. Scheduled apps also have the string Scheduled visible in the Scheduled column of this table. For more information, see "Available Apps".
Operations Monitor supports cron expressions as a means of defining your app schedules. An expression consists of 5 fields separated by white space that represent a set of times. The first field represents minutes, followed by hours, the day of the month, month, and day of the week. For example:
To run an app every minute use this expression:
* * * * *
To run an app every 30 minutes (on the 0th and 30th minute of every hour):
0,30 * * * *
And below, every Monday (2nd day of the week) at 1am:
* 1 2 * *
Note:
App results that include data for calls (result type "calls") remain valid and accessible only as long as the calls are accessible in the system. Once the call(s) fall out of Operations Monitor's scope, the app results which reference them will no longer be available.
|
Copyright © 2015, Oracle and/or its affiliates. All rights reserved. Legal Notices |
|