5 Oracle Test Manager Tutorial
This tutorial walks you through the main features of Oracle Test Manager. It consists of the following examples.
-
Adding a Test Plan - describes how to add a test plan.
-
Adding a Requirement - describes how to add a requirement.
-
Adding Tests - describes how to add a both a manual and automated test and how to associate a requirement with a test.
-
Creating Test Sets and Running Tests - explains how to add test sets, run both a manual test and an automated test and how to view the results of the automated test.
-
Adding an Issue - describes how to find and issue, add an issue and associate it with a test.
-
Creating Reports - explains how to view reports and charts.
-
Using Dashboards - explains how to view default chart Dashboards and create custom Dashboards.
The tutorial is designed to be followed sequentially from beginning to end. Many of the examples are interrelated and build upon the steps in previous examples.
5.1 Starting Oracle Test Manager
Note:
This section uses the default login credentials from the Oracle Application Testing Suite installation.To start Oracle Test Manager:
-
Select Programs from the Start menu and then select Oracle Test Manager from the Oracle Application Testing Suite Start menu.
-
Enter administrator as the user name.
-
Enter the password specified during the Oracle Application Testing Suite installation process.
-
Make sure the Database is set to OATS_otm_DS.
-
Click Login.
5.2 Opening the Sample Project
A demonstration project is installed with Oracle Test Manager for testing the sample stock brokerage application Fitch & Mather. This application can be viewed at http://demo.fmstocks.com/fmstocks/. To open the sample project:
-
Start Oracle Test Manager and log in.
The default installation user names are administrator and default unless changed by an administrator. The password is the password specified during the installation procedure unless changed by an administrator.
-
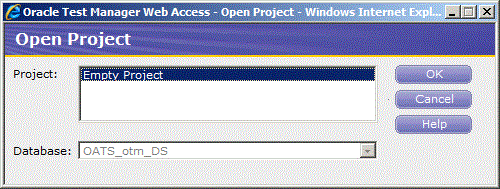
Click Open from the Project menu to display the Open Project dialog box.
-
Make sure the OAST_otm_DS database is selected. This is the database that was created when you installed Oracle Test Manager.
-
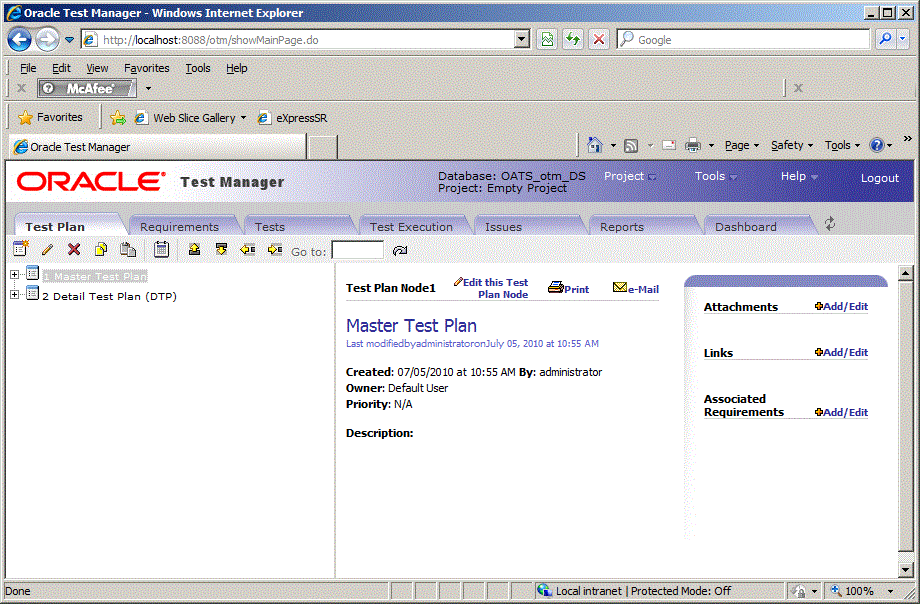
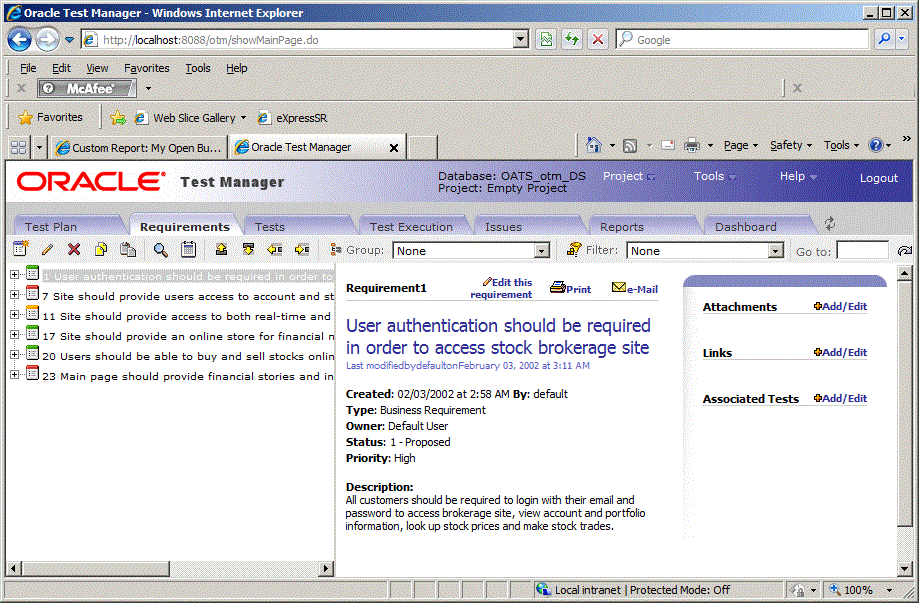
Click OK. The main window appears as follows:.
Figure 5-2 Oracle Test Manager Main Window
Description of "Figure 5-2 Oracle Test Manager Main Window"
The left pane contains tabs for the modules that comprise the application. They are test plans, requirements, tests, test execution, issues, reports, and dashboard. The detailed information for the selected item is displayed in the right pane. The information displayed may be different from the examples shown in this tutorial if your system administrator has customized the database to add new fields or disable default fields.
5.3 Example 1: Adding a Test Plan
This example explains how to add a Test Plan.
-
Click the Test Plan tab.
-
Select item 1. The test plan will be added for the Master Test Plan.
-
Click Add to display the Add Test Plan dialog box.
-
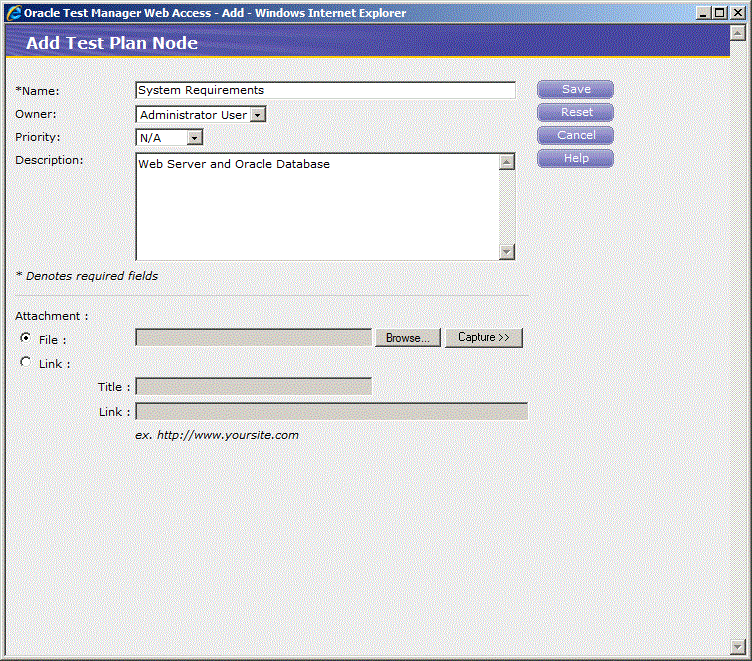
Enter "System Requirements" in the Name field.
-
Select an owner.
-
Select High from the Priority list.
-
Enter "Web Server and Oracle Database" in the Description field.
Figure 5-5 Add Test Plan Window with Sample Data
Description of "Figure 5-5 Add Test Plan Window with Sample Data"
-
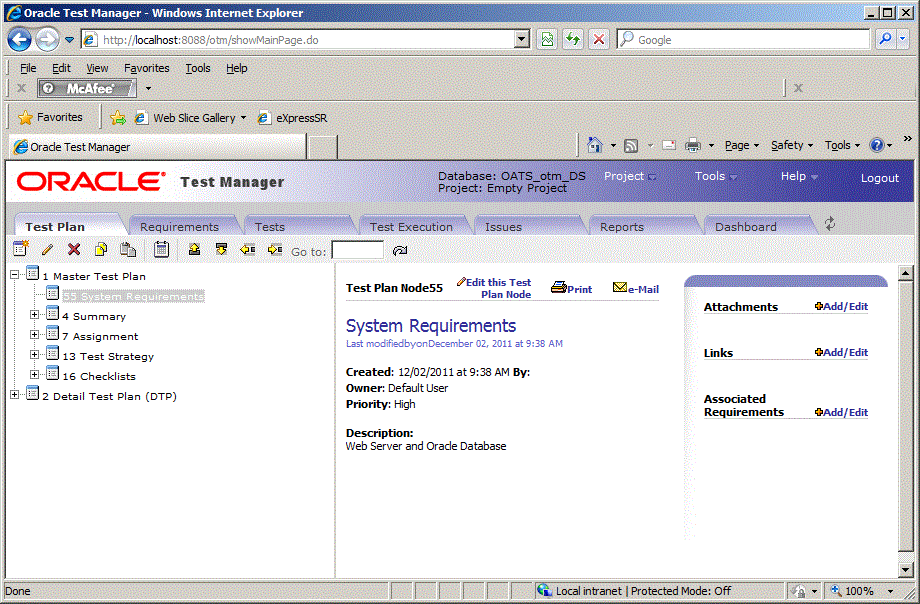
Click Save. The new test plan appears in the tree.
-
Select the System Requirements item to make it the selected item in the tree.
-
Click the Indent toolbar button so that the System Requirements node is moved below the item 1 Master Test Plan tree node.
Figure 5-6 Test Plan Tab with New Test Plan Added
Description of "Figure 5-6 Test Plan Tab with New Test Plan Added"
5.4 Example 2: Adding a Requirement
This example explains how to add a requirement.
-
Click the Requirements tab.
-
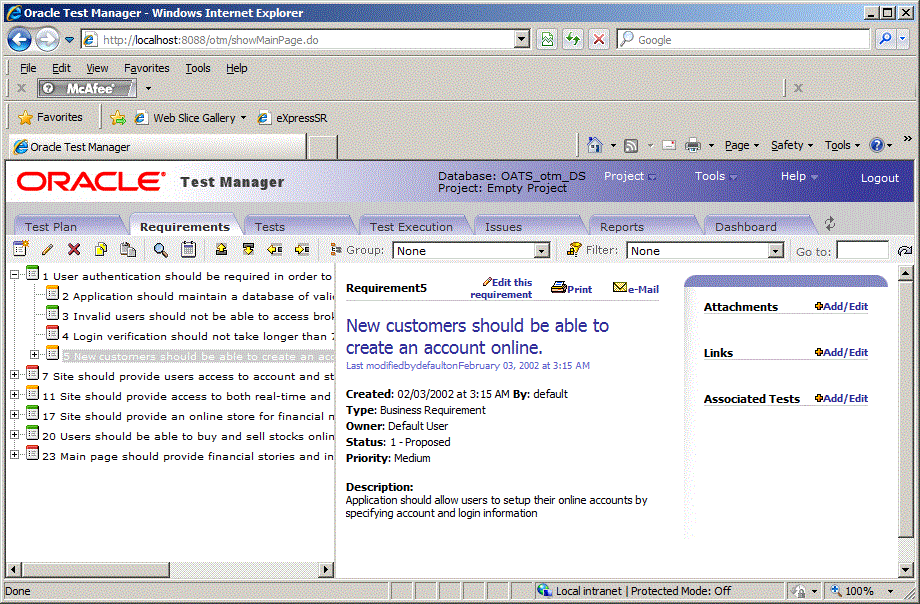
Expand item 1 "User authentication should be required in order to access stock brokerage site" and select item 5 "New customers should be able to create an account online". The new requirement will be added under item 1.
-
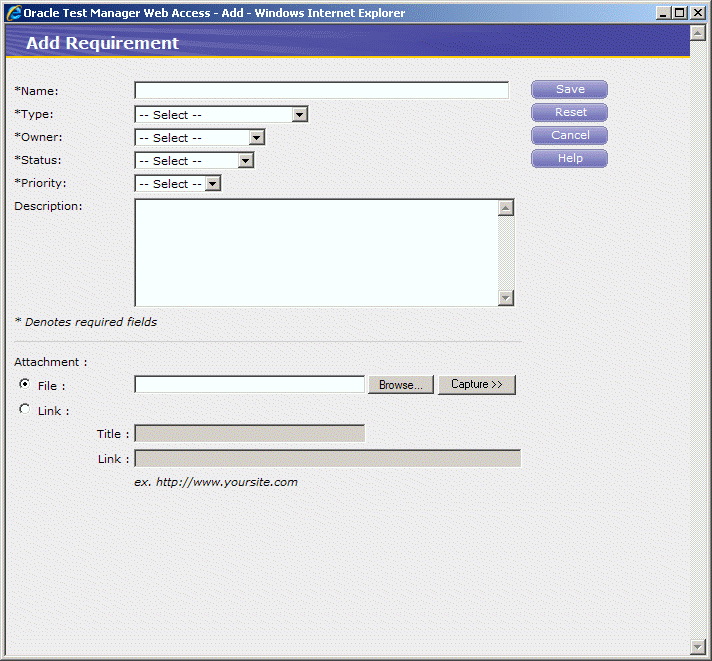
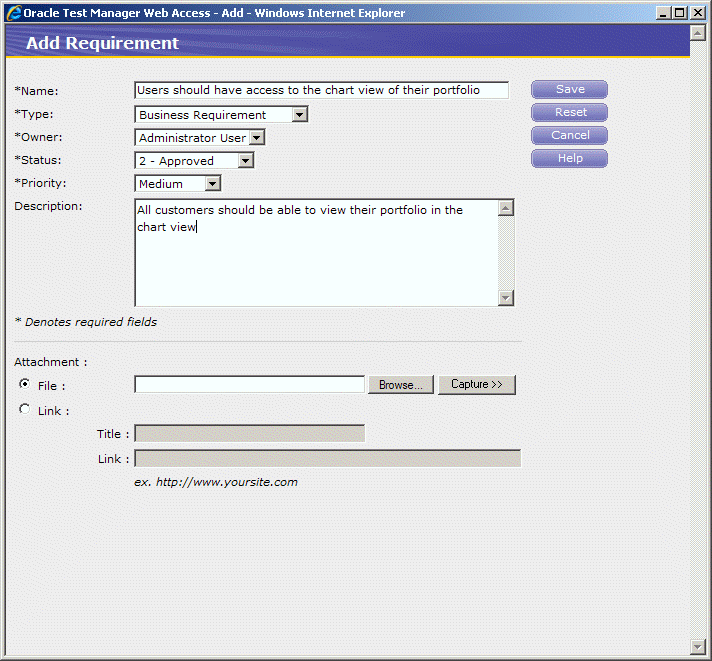
Click Add to display the Add Requirement dialog box.
-
Enter "Users should have access to the chart view of their portfolio" in the Name field.
-
Select a type, owner, and status.
-
Select Medium from the Priority list.
-
Enter "All customers should be able to view their portfolio in the chart view" in the Description field.
Figure 5-9 Add Requirement Window with Sample Data
Description of "Figure 5-9 Add Requirement Window with Sample Data"
-
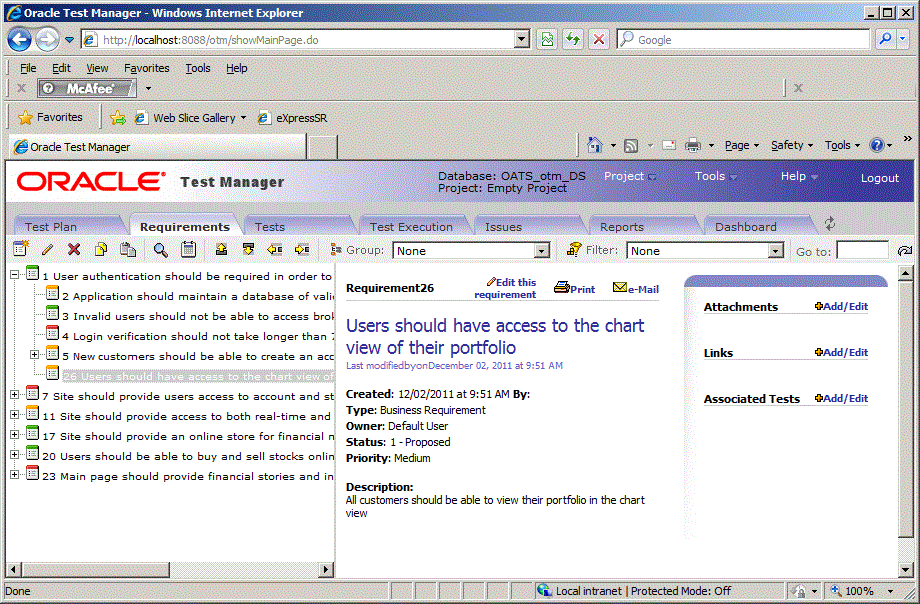
Click Save. The new requirement appears in the tree.
Figure 5-10 Requirements Tab with New Requirement Added
Description of "Figure 5-10 Requirements Tab with New Requirement Added"
5.5 Example 3: Adding Tests
You can add two types of test cases to Oracle Test Manager:
Manual tests - these are tests that allow you to organize your test cases. For each step in the test, you enter the action, expected result, and pertinent comments. When you run the test, the Oracle Test Manager Manual Test Wizard takes you step by step through the test, allowing you to manually execute each test and enter the result.
Automated tests - these are Oracle OpenScript tests that can be run automatically without manual intervention. You can run one test, an entire branch of tests, or all automatic tests in the project.
This example has two parts. The first part explains how to add a manual test. The second part explains how to create the same test using Oracle OpenScript and add it as an automated test.
5.5.1 Adding a Manual Test
This example explains how to add a manual test.
-
Click the Tests tab.
-
Expand item 2, Customer Account Tests.
-
Select
-
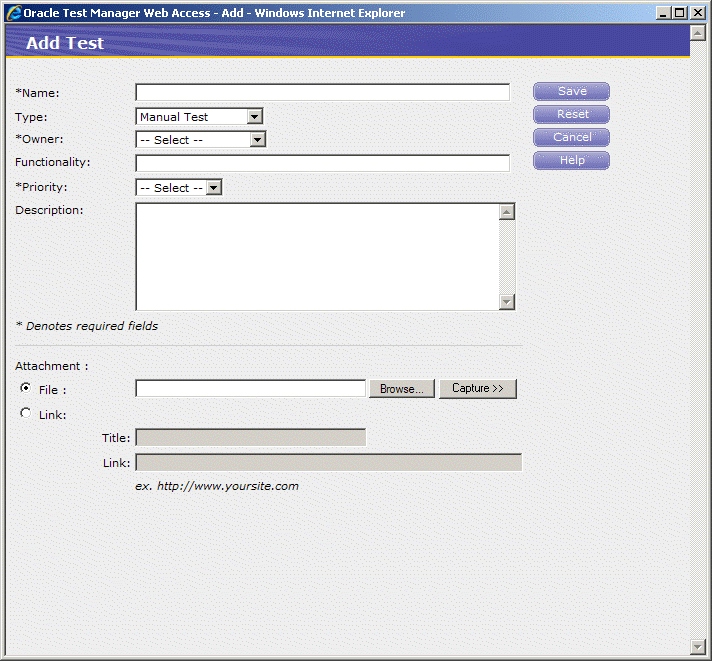
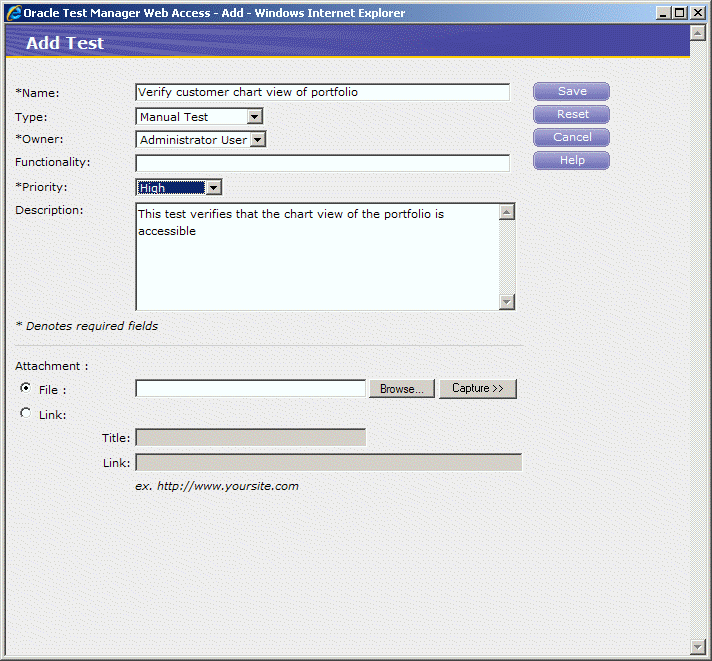
Click Add to display the Add Test dialog box.
-
Enter "Verify customer chart view of portfolio" in the Name field.
-
Select Manual Test in the Type field.
-
Enter "This test verifies that the chart view of the portfolio is accessible" in the Description field.
-
Select an owner and priority.
Figure 5-12 Add Test Window with Sample Data
Description of "Figure 5-12 Add Test Window with Sample Data"
-
Click Save. The test is added to the tree.
-
Select the newly added node in the tree and click the Indent toolbar button to move the new item below item 2 "Customer Account Tests". You are now ready to add test steps.
-
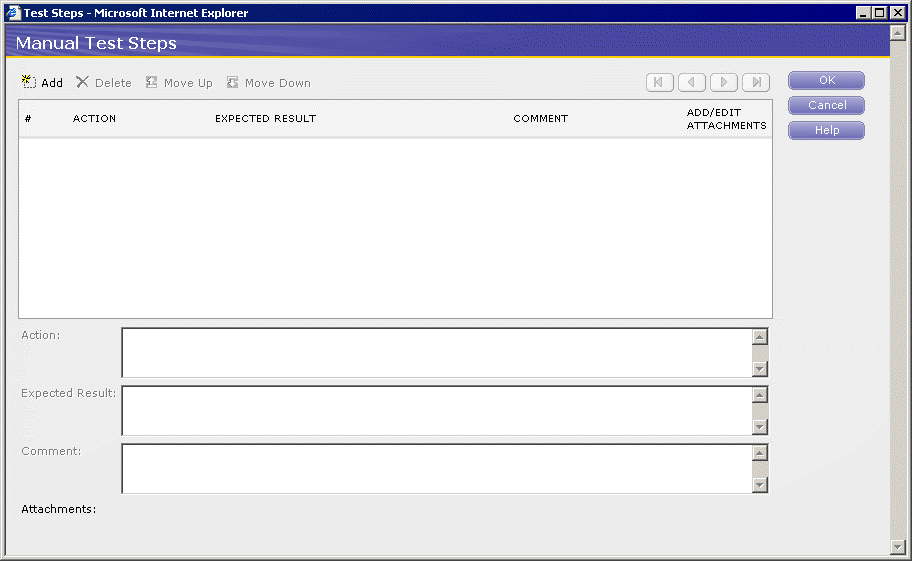
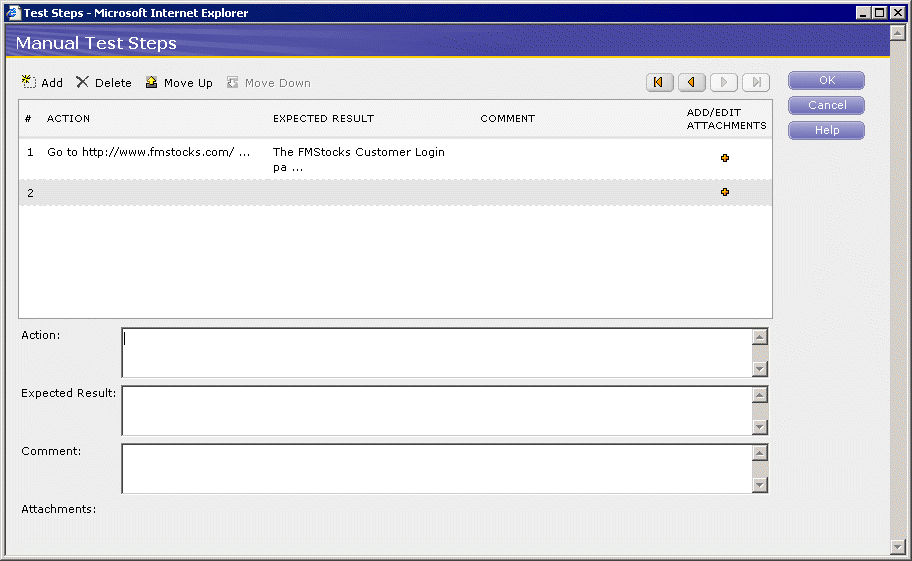
Make sure the new test is selected in the tree and click Add/Edit in the Test Steps section of the right-hand pane to display the Test Steps dialog box.
-
Click Add.
-
Enter, "Go to http://www.fmstocks.com/fmstocks" in the Action field.
-
Enter, "The FMStocks Customer Login page should be displayed" in the Expected Results field.
-
Click Add to update the top of the dialog box and to go to the next step.
Figure 5-14 Manual Test Steps Window with Sample Data
Description of "Figure 5-14 Manual Test Steps Window with Sample Data"
-
Enter the following steps, clicking Add to start each step:
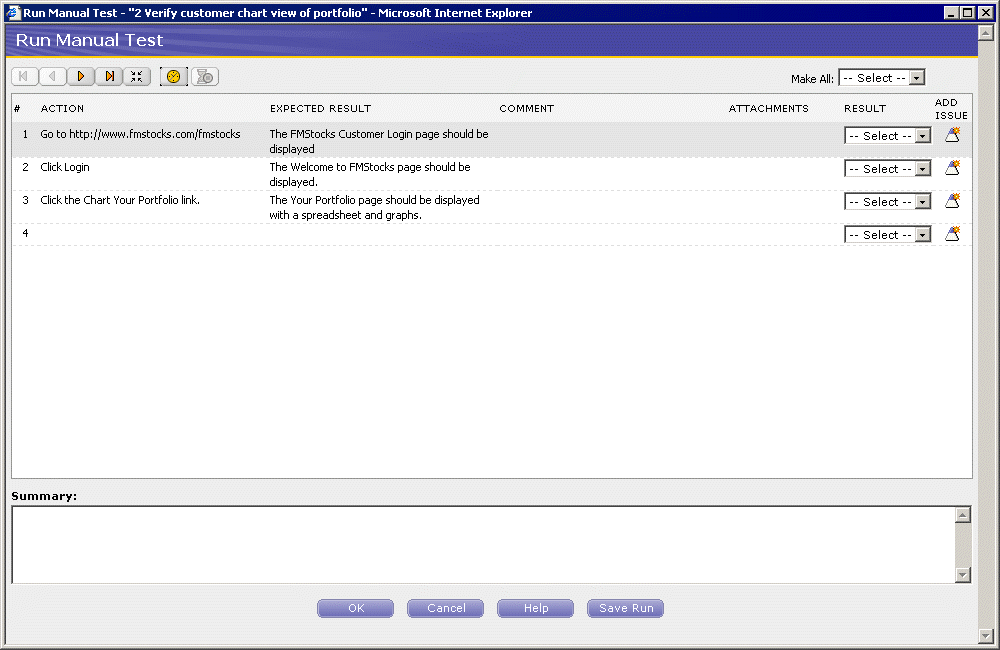
Step Action Expected Result 2 Click Login. The Welcome to FMStocks page should be displayed. 3 Click the Chart Your Portfolio link The Your Portfolio page should be displayed with a spreadsheet and graphs. The Manual Test Steps dialog box shows the entries as entered.
-
Click OK.
5.5.2 Adding an Automated Test
Oracle Test Manager can run Oracle OpenScript functional test scripts as automated tests. This example explains how to add a script created in Oracle OpenScript to the Tests in Oracle Test Manager and associate it with the requirement just added.
-
Select Programs from the Start menu and then select OpenScript from the Oracle Application Testing Suite menu.
-
Select New from the File menu.
-
Expand the Functional Testing (Browser/GUI Automation) folder.
-
Select "Web" and click Next.
-
Select the default repository.
-
Enter
ChartPortfolioas the name of the script and click Finish.OpenScript creates the script project and adds the Initialize, Run, and Finish sections to the script tree.
-
Select Record from the Script menu or click the toolbar button. A new browser window opens.
-
Go to
http://www.fmstocks.com/fmstocks. -
Click Login.
-
Click the Chart Your Portfolio link.
-
Select Stop from the Script menu or click the toolbar button.
-
Select Save from the File menu.
-
Select Playback from the Script menu or click the toolbar button and verify that the script plays back correctly and passes. You can view the results in the OpenScript Results view or the Details view.
-
Select Exit from the File menu to exit Oracle OpenScript and return to Oracle Test Manager.
-
Click the Tests tab.
-
Expand Customer Account Tests and select Verify customer stock portfolio.
-
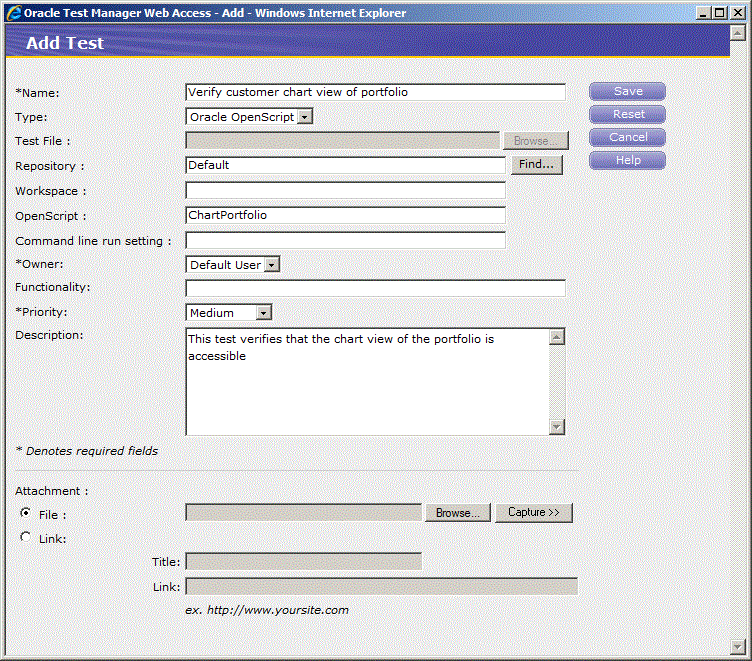
Click Add to display the Add Test dialog box.
-
Enter "Verify customer chart view of portfolio" in the Name field.
-
Select Oracle OpenScript in the Type field.
-
Click Find in the Repository field.
-
Expand the Default repository, select the ChartPortfolio script, and click OK.
-
Select an owner and priority.
-
Enter "This test verifies that the chart view of the portfolio is accessible" in the Description field.
Figure 5-15 Add Test Window with Sample Automated Test
Description of "Figure 5-15 Add Test Window with Sample Automated Test"
-
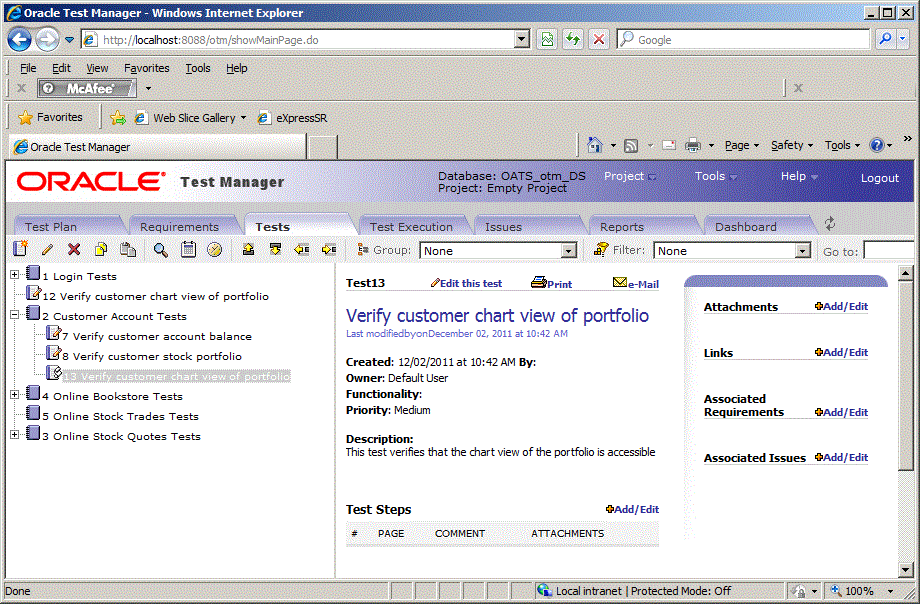
Click Save.
-
The test is added to the tree.
Figure 5-16 Tests Tab with New Test Added
Description of "Figure 5-16 Tests Tab with New Test Added"
-
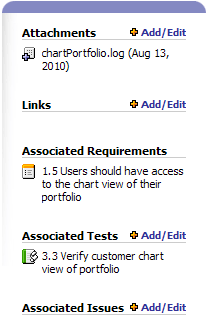
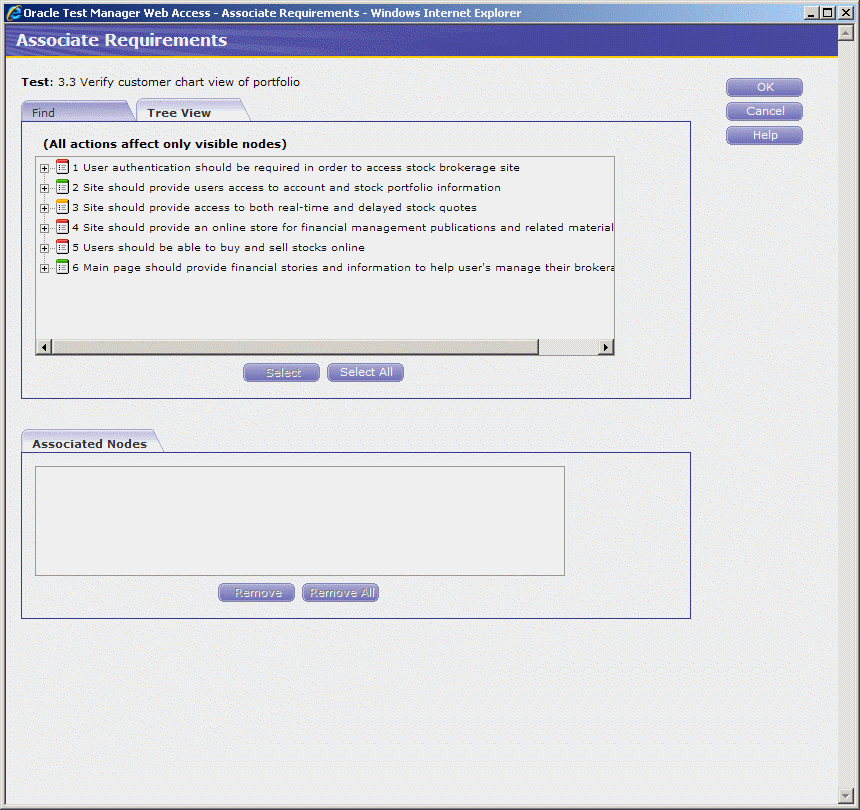
Click Add/Edit next to Associated Requirements in the right pane, to display the Associate Requirement dialog box.
-
Click the Tree View tab.
Figure 5-17 Associate Requirements Window
Description of "Figure 5-17 Associate Requirements Window"
-
Expand item 1 and select "Users should have access to the chart view of their portfolio".
-
Click Select.
-
Click OK. The test is now linked to the requirement and is listed on the right-hand side of the screen. The test is also listed in the Associated Tests section of the requirement.
Figure 5-18 Test Associated with Requirement
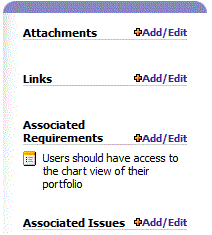
Description of "Figure 5-18 Test Associated with Requirement"
5.6 Example 4: Creating Test Sets and Running Tests
Tests are run using the Test Execution tab. The Test Execution tab is where you define Test Set Folders and Test Sets. Test Set Folders can be used to group test sets. Test Sets specify the tests to execute.
This example has three parts. The first part explains how to create a Test Set and add tests to the test set. The second part explains how to run the manual test created in the previous example. The third part explains how to run the automated test created in the previous example, then how to view the detailed Results Report.
5.6.1 Creating a Test Set
This example explains how to create a Test Set and add tests to the test set.
-
Click the Test Execution tab.
-
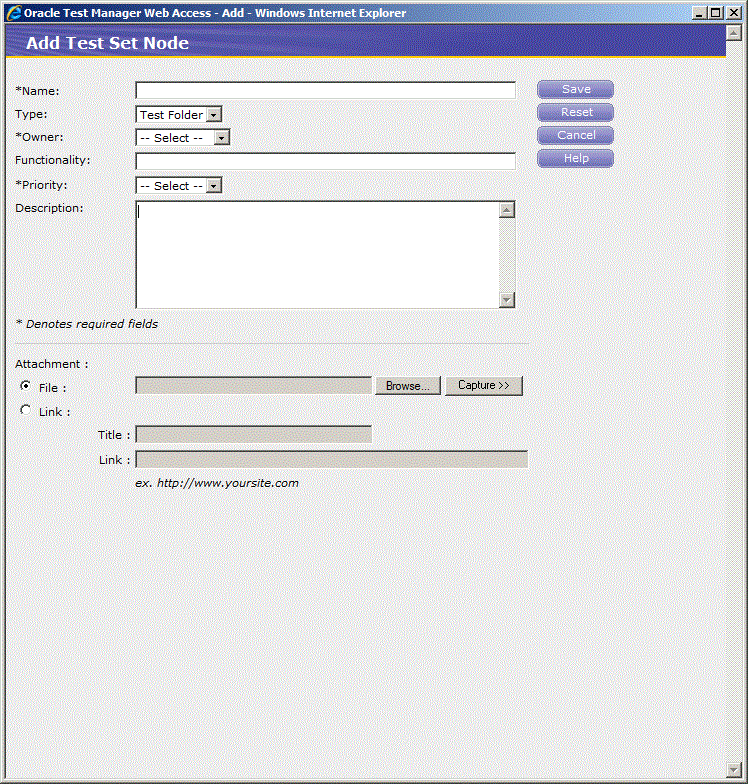
Click Add to display the Add Test Set Node dialog box.
-
Enter "Chart portfolio tests" as the test set name.
-
Select Test Set as the Type.
-
Select an owner.
-
Enter "Run Chart portfolio tests" as the Description.
Figure 5-20 Add Test Set Node Window with Sample Data
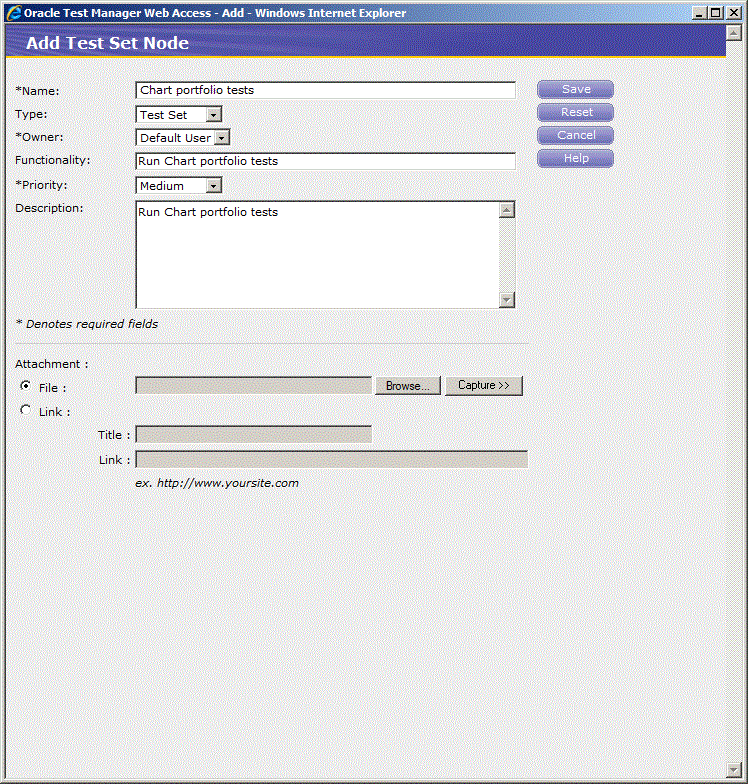
Description of "Figure 5-20 Add Test Set Node Window with Sample Data"
-
Click Save. The new Test Set is added to the tree.
5.6.2 Adding Tests to a Test Set
This example explains how to add tests to the Test Set created in the in the previous example.
-
Select "Chart portfolio tests" in the tree.
-
Click Add/Edit next to Test List in the right pane, to display the Add/Edit test in group dialog box.
-
Click the Tree View tab.
-
Select "Verify customer view of chart portfilio" and click Select. The test is added to the Selected List.
Figure 5-21 Add/Edit test in group dialog box with Test Selected
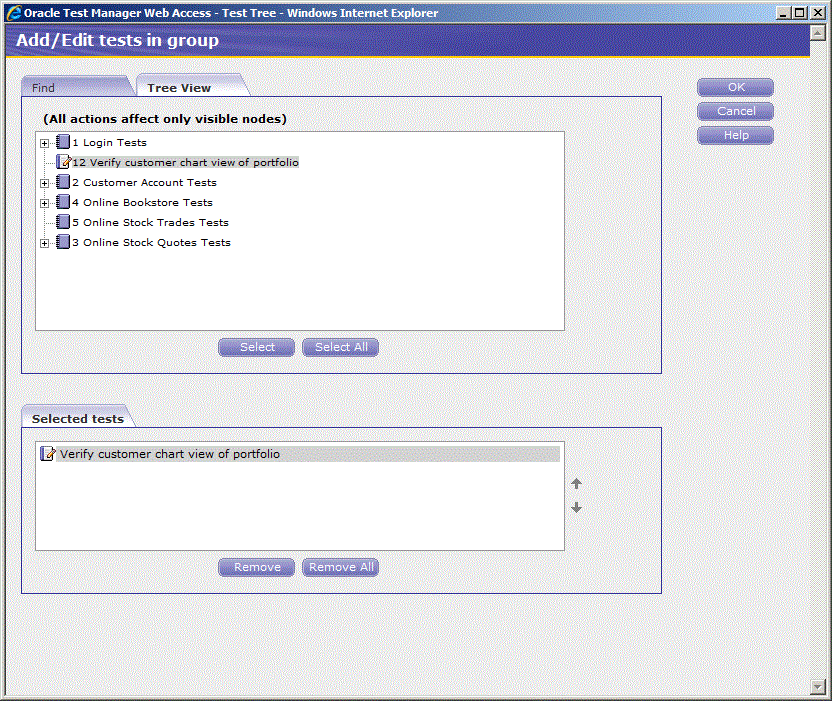
Description of "Figure 5-21 Add/Edit test in group dialog box with Test Selected"
-
Expand item 2 Customer Account Tests.
-
Select "Verify customer view of chart portfilio" and click Select to add the automated OpenScript test to the list. The test is added to the Selected List.
-
Click OK. The test is added to the Test List in the right-hand pane.
Figure 5-22 Test Execution Tab with Test Added to Test Set
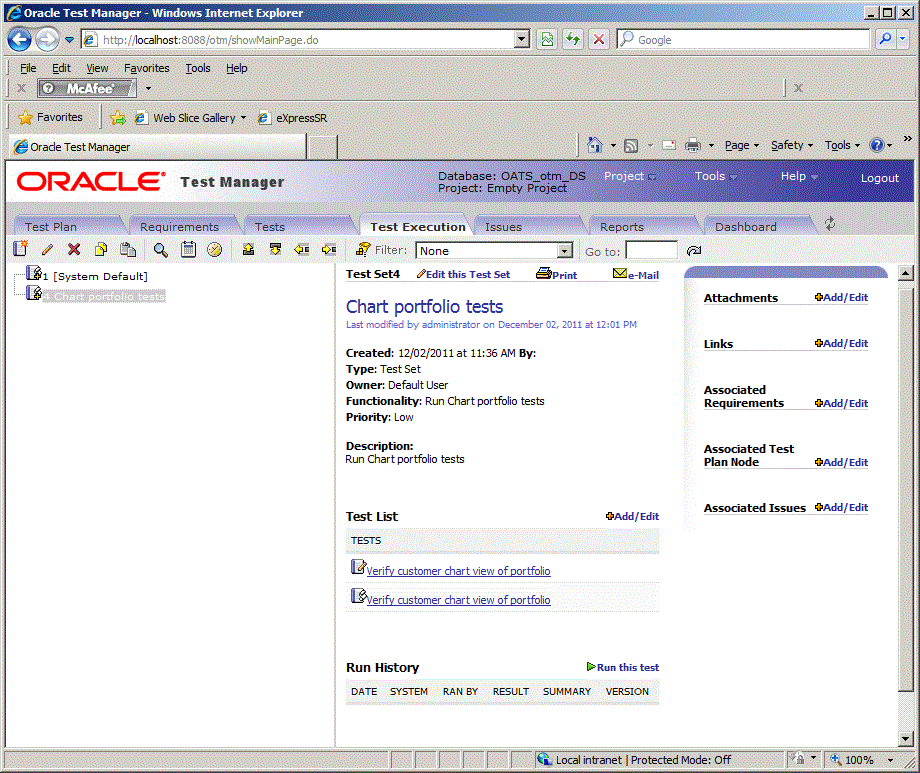
Description of "Figure 5-22 Test Execution Tab with Test Added to Test Set"
-
If necessary, scroll down to view the Run History section in the right-hand pane
5.6.3 Running a Manual Test
This example explains how to run the manual test entered in the previous example.
-
Click the Tests Execution tab and select Chart Portfolio tests in the tree.
-
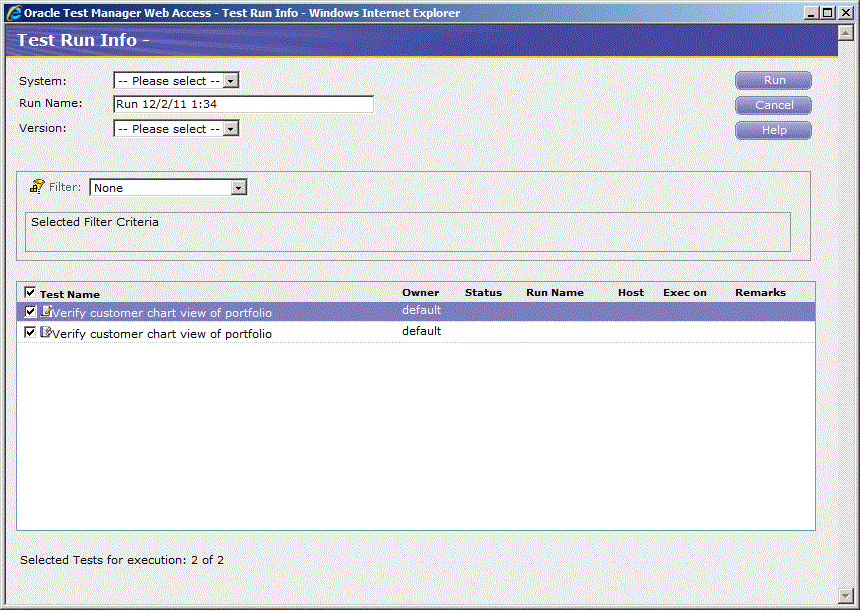
Click Run this test in the Run History section of the right-hand pane.
-
Select the "Verify customer view of chart portfilio" with the pencil (manual test) icon.
-
Make sure the check box is selected. You can use the check boxes for each test to enable or disable specific tests within the Run Test window.
-
Select OTM Server in the System field.
-
Leave the current date and time in the Run Name field.
-
Select 1.0 in the Version field. This is the version number of the application you are testing.
-
Select the "Verify customer view of chart portfilio" with the scroll (automated test) icon.
-
Make sure the check box is cleared.
-
Select OTM Server in the System field.
-
Leave the current date and time in the Run Name field
-
Select 1.0 in the Version field. This is the version number of the application you are testing.
-
Click Run. For manual tests, the Run Manual Test window opens.
-
This dialog box tells you the action to take and the expected result. Open your browser and perform the first action. Select the result Passed. Enter comments, when needed, in the Summary field.
-
Repeat for steps 2 and 3.
-
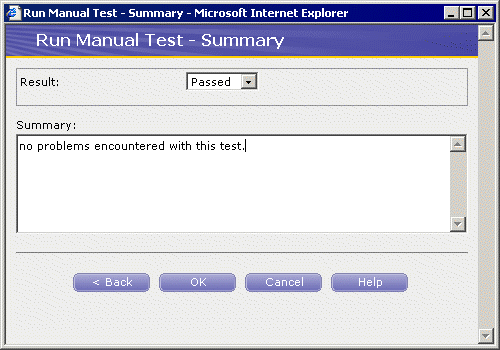
Click OK to display the Run Manual Test - Summary window.
Figure 5-25 Run Manual Test Summary Window
Description of "Figure 5-25 Run Manual Test Summary Window"
-
Select Passed.
-
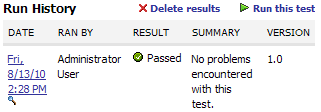
Enter, "No problems encountered with this test." in the Summary field.
-
Click OK.
The Run History and Result Detail are displayed in the right pane.
5.6.4 Running an Automated Test
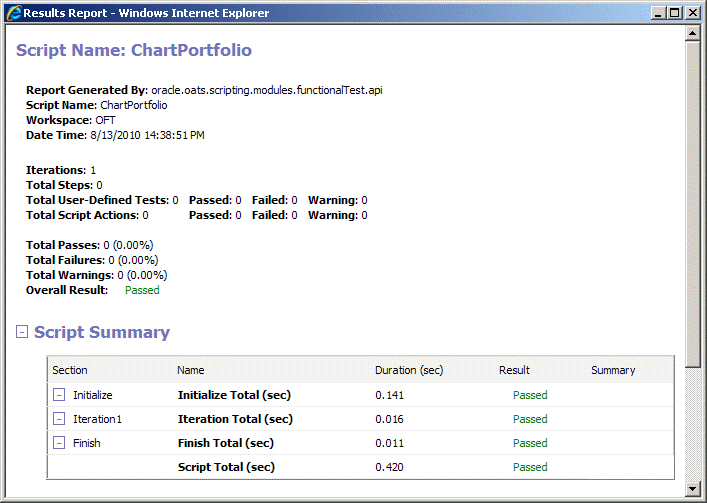
This example explains how to run an the automated test created in the previous example and how to view the results detail and the detailed Oracle OpenScript Results Report.
-
Click the Tests Execution tab and select Chart Portfolio tests in the tree..
-
Click Run this Test in the Run History section of the right-hand pane to display the Test run Info dialog box.
-
Select the "Verify customer view of chart portfilio" with the pencil (manual test) icon.
-
Make sure the check box is cleared.
-
Select OTM Server in the System field.
-
Leave the current date and time in the Run Name field.
-
Select 1.0 in the Version field. This is the version number of the application you are testing.
-
Select the "Verify customer view of chart portfilio" with the scroll (automated test) icon.
-
Make sure the check box is selected.
-
Select OTM Server in the System field.
-
Leave the current date and time in the Run Name field
-
Select 1.0 in the Version field. This is the version number of the application you are testing.
-
Click Run. Oracle OpenScript executes the script (this may take a few moments).
-
Click the Refresh arrows next to the Script Name in the right pane to update the Run History. Oracle Test Manager displays the Result Detail Summary when the test is finished.
Figure 5-27 Run History of Automated Test

Description of "Figure 5-27 Run History of Automated Test"
-
Click the date of the test in the Run History section of the right pane.
-
Click View Report in the Result Summary to display the detailed Oracle OpenScript Results Report in a separate browser window.
-
Review the report and close the Result Report window when finished.
5.7 Example 5: Adding an Issue
This example explains how to search through issues, add an issue, associate it with a test, and add an attachment with additional information. For the purposes of this example, we will assume that the script run in example 3 failed.
To search through issues to see if an issue already exists for this topic, or to find related issues:
-
Click the Issues tab.
-
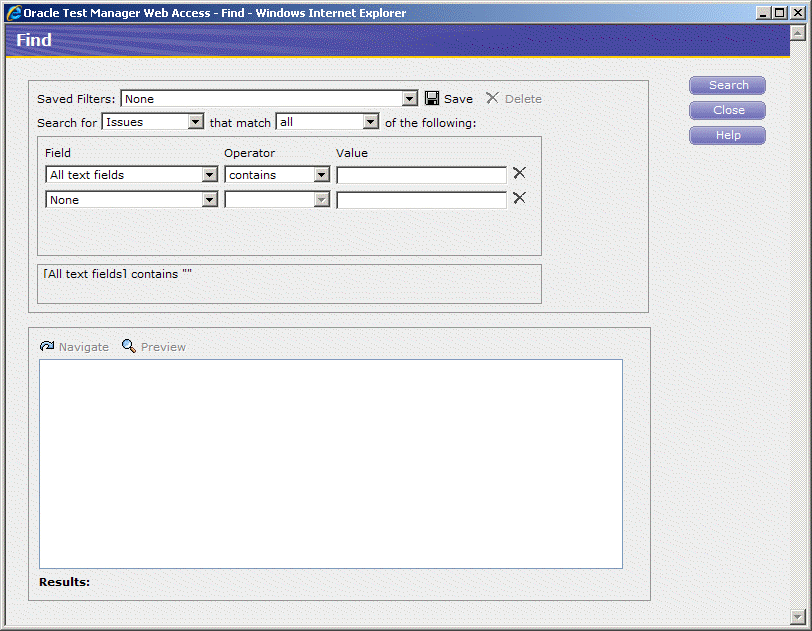
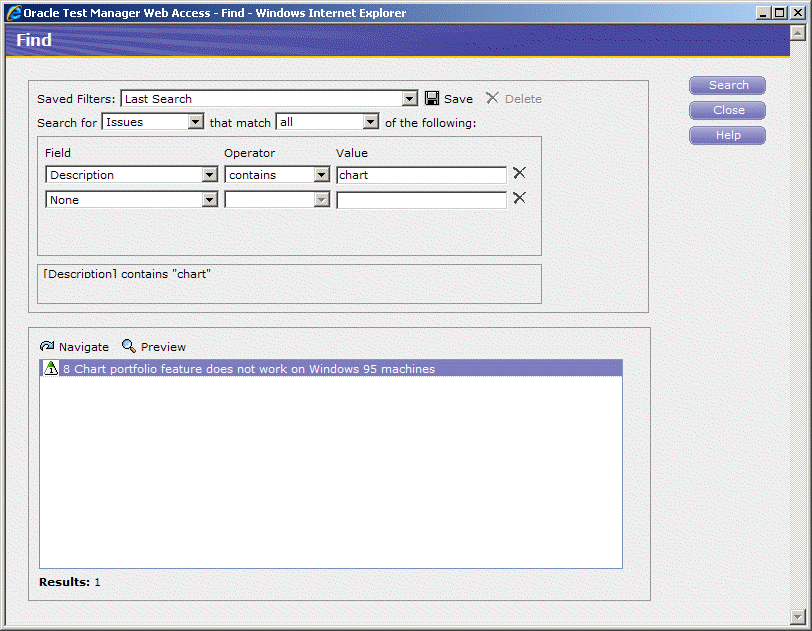
Click the Find icon (magnifying glass) to display the Find dialog box.
-
Select Description for the field to search.
-
Enter "chart" in the Value field.
-
Make sure that Issues is selected in the Search for field and that all is selected in the that match field. This will search all of the issue descriptions for the word, "chart."
-
Click Search. If there are any matches, they are displayed in the Results portion of the window.
Figure 5-30 Find Window with Search Results
Description of "Figure 5-30 Find Window with Search Results"
One match was found. You can click Navigate in the Results list to display it in Oracle Test Manager or click Preview to view the issue in a separate preview window. We will assume that our failure is different enough to warrant creating a new issue.
-
Click Close to close the Find dialog box.
To create an issue.
-
Click the Issues tab.
-
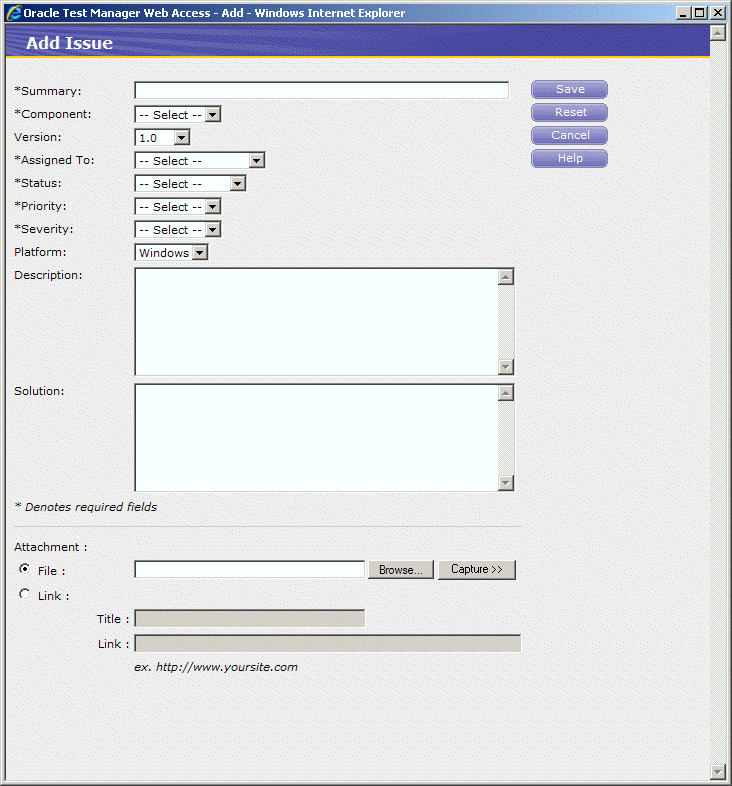
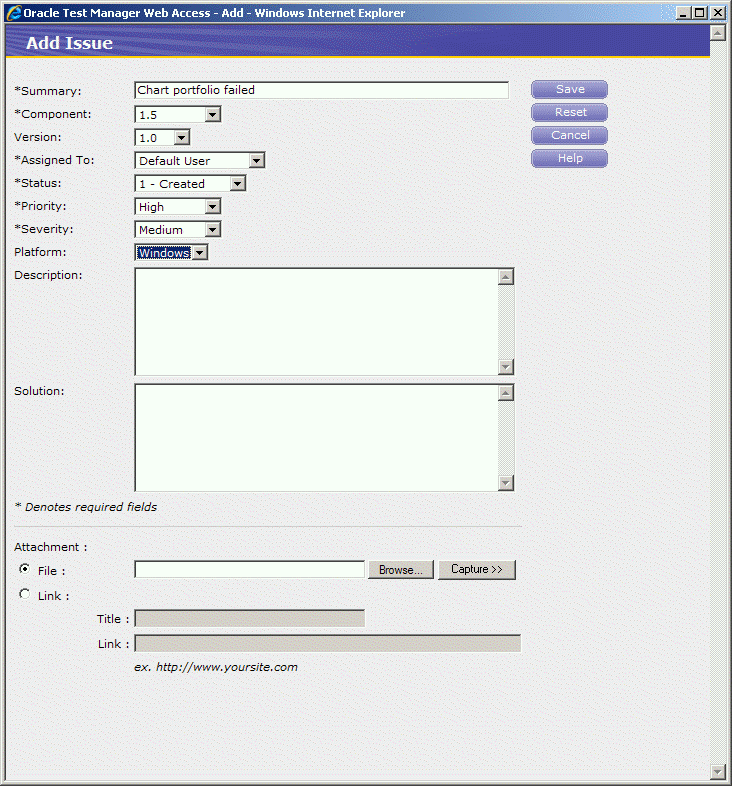
Click Add to display the Add Issue dialog box.
-
Enter "Chart portfolio failed" in the Summary field.
-
Select the default component.
-
Select 1.0 for the version.
-
Assign the issue to Default User.
-
Set the status to Created.
-
Change the Priority to Medium.
-
Change the Severity to Medium.
-
Select the Windows platform.
Figure 5-32 Add Issue Window with Sample Data
Description of "Figure 5-32 Add Issue Window with Sample Data"
-
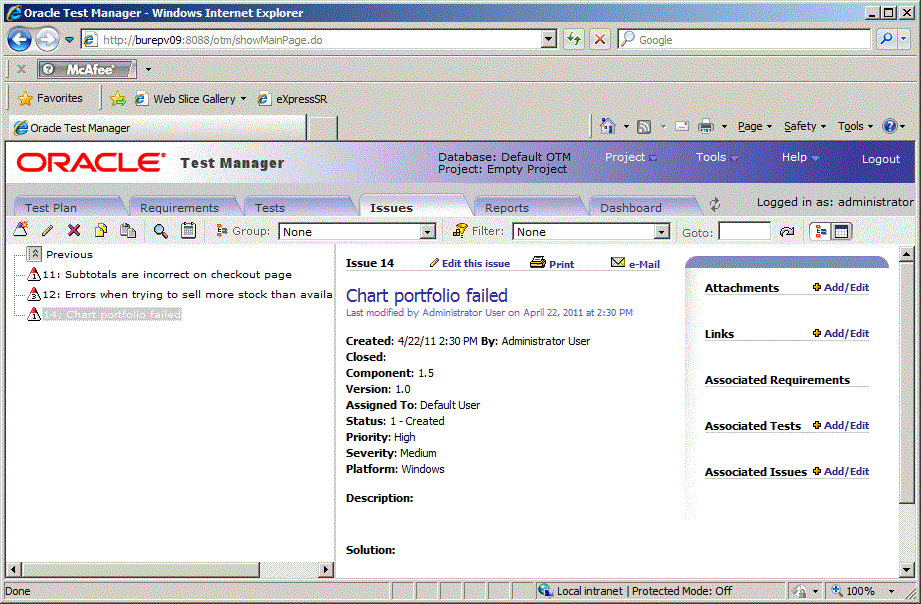
Click Save. The issue is assigned the next available number and added to the bottom of the list.
Figure 5-33 Issues Tab with New Issue Added
Description of "Figure 5-33 Issues Tab with New Issue Added"
-
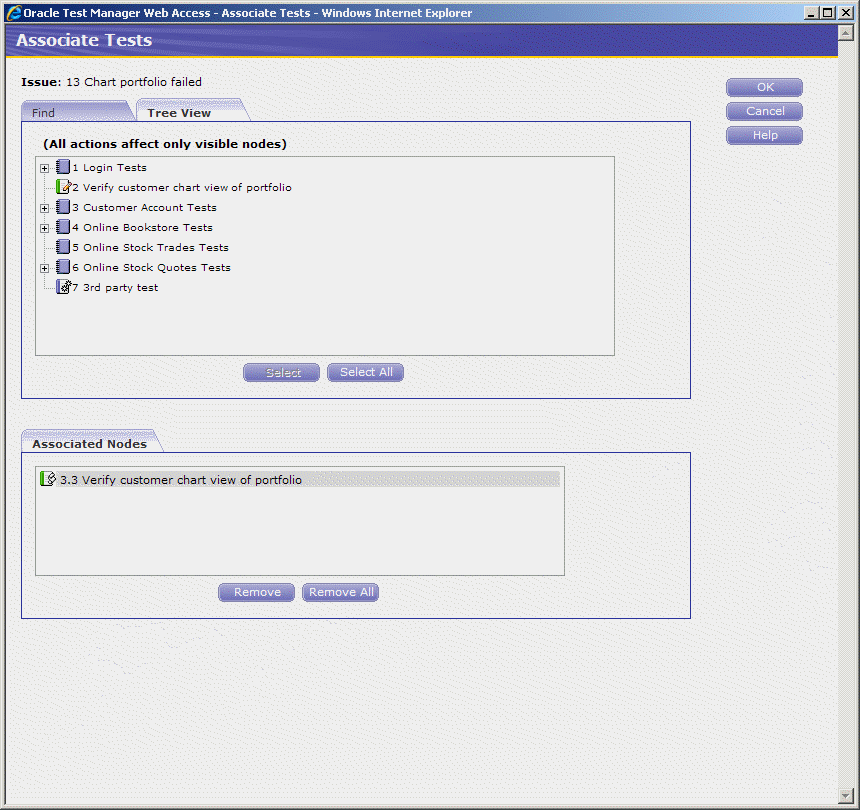
Click Add/Edit next to Associated Tests in the right pane to display the Associate Test dialog box.
-
Click the Tree View tab.
-
Expand the Customer Account Tests folder and select "Verify customer chart view of portfolio".
-
Click Select.
Figure 5-34 Associate Test Window with Issue Selected
Description of "Figure 5-34 Associate Test Window with Issue Selected"
-
Click OK. The test is listed in the Associated Tests list.
-
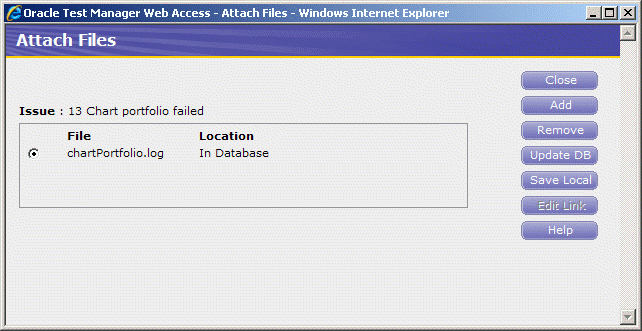
Select Add/Edit in the Attachments section to display the Attach Files dialog box.
-
Click Add.
-
Click Browse.
-
Select a file to attach and click Open.
-
Click Upload.
Figure 5-35 Attach Files Window with File Selected
Description of "Figure 5-35 Attach Files Window with File Selected"
-
Click Close. The attachment is listed in the Attachments list in the right pane. Click on the attachment to open it in the appropriate application.
5.8 Example 6: Creating Reports
Oracle Test Manager comes with a standard set of reports. In addition, you can create and optionally save custom reports. Reports can be either public, that is, available to all users, or private, available only to you. This example explains how to view standard reports and how to create a custom report and save it.
-
Click the Reports tab.
-
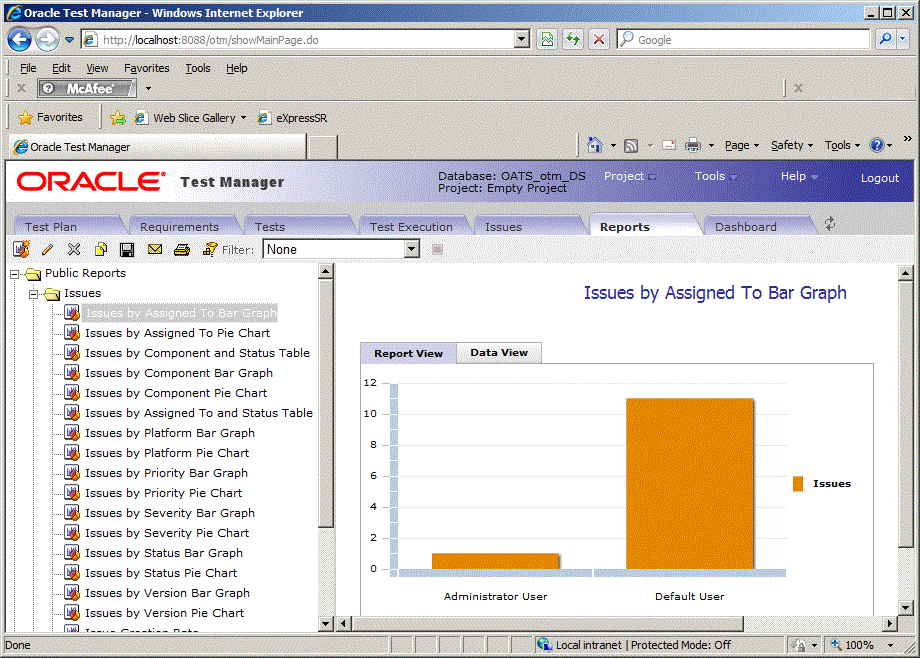
Expand the Public Reports node, then the Issues node.
-
Select Issues by Assigned to Bar Graph to display the graph in the right pane.
Figure 5-37 Reports Tab with Bar Graph Report
Description of "Figure 5-37 Reports Tab with Bar Graph Report"
-
Click once on the graph area then mouse over the bars to view the actual values. Click Data View to view just the data.
-
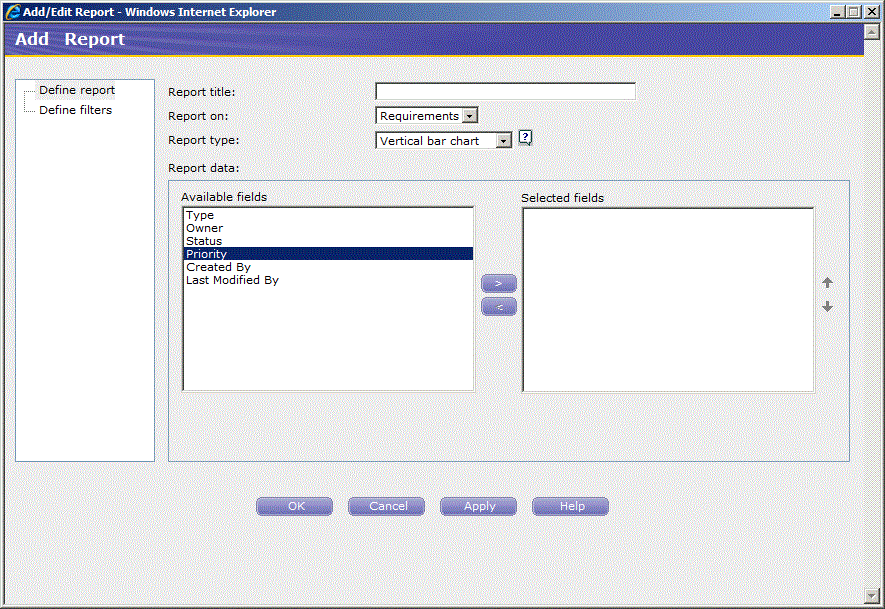
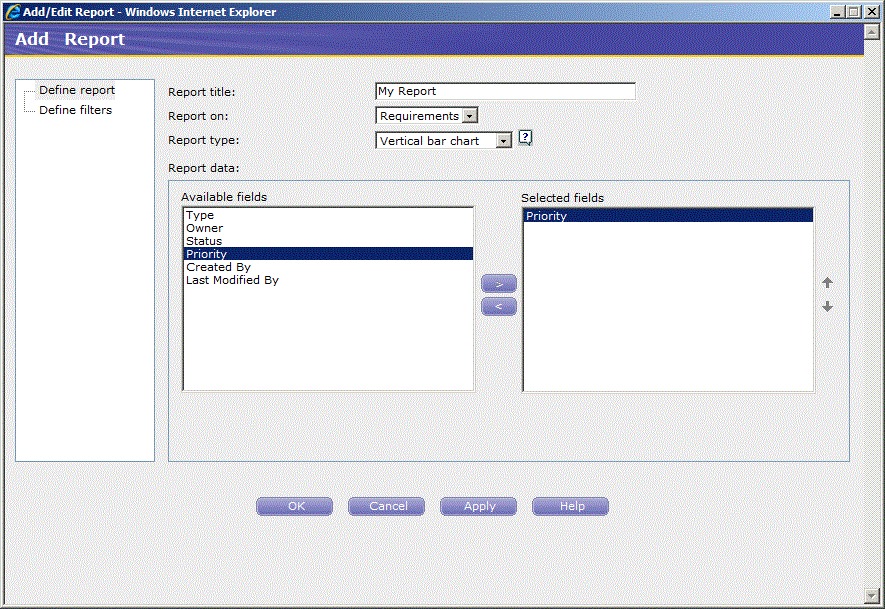
To create a custom report click Add.
-
Enter a name for the report.
-
Select Vertical bar chart for the report type.
-
Select Priority from the Available fields and click the right arrow to add it to the Selected fields list.
Figure 5-39 Add Report Window with Selected Fields
Description of "Figure 5-39 Add Report Window with Selected Fields"
-
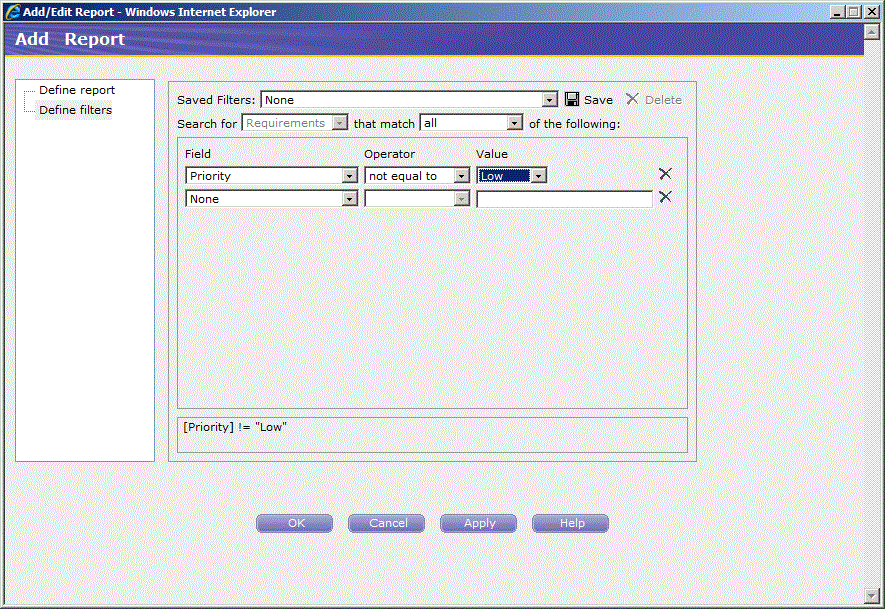
Click Define filters.
-
Select Priority as the field, not equal to in the Operator field, and Low for the Value. This means that the report will only display information for Medium and High priority requirements.
-
Click OK to display the report.
-
Click Save to save this report.
-
Enter Requirements Medium and High for the report name. The name will be displayed in the report tree.
-
Select My Reports as the Report Category.
-
Click OK. The new report is added under the My Reports folder.
Figure 5-41 Reports Tab with Custom Reports
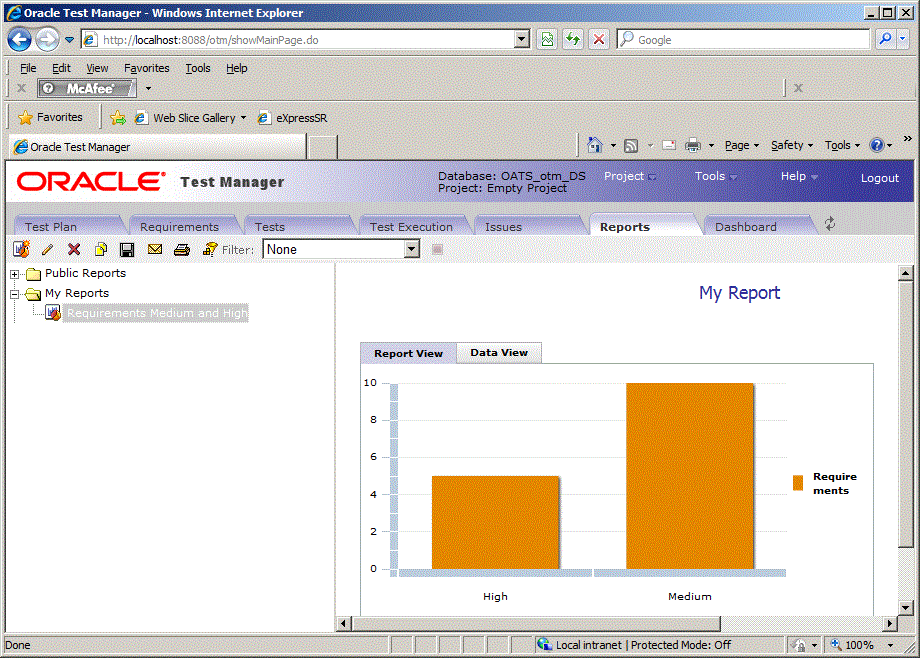
Description of "Figure 5-41 Reports Tab with Custom Reports"
5.9 Example 7: Using Dashboards
The Oracle Test Manager Web Dashboard tab is where you can create and view multi-report dashboards. These dashboards allow you to select the key reports of interest and save them in a single integrated view. This allows you to create report dashboards that are tailored to the needs of specific users. Each new dashboard can also be saved as either a public dashboard which will be viewable by all users who log into this project or a private dashboard that is only viewable by your account.
-
Click the Dashboard tab.
-
Select the Test Cases Dashboard from the select list.
-
Select Two Column from the Layout list.
Figure 5-42 Dashboard Tab with Test Cases Dashboard
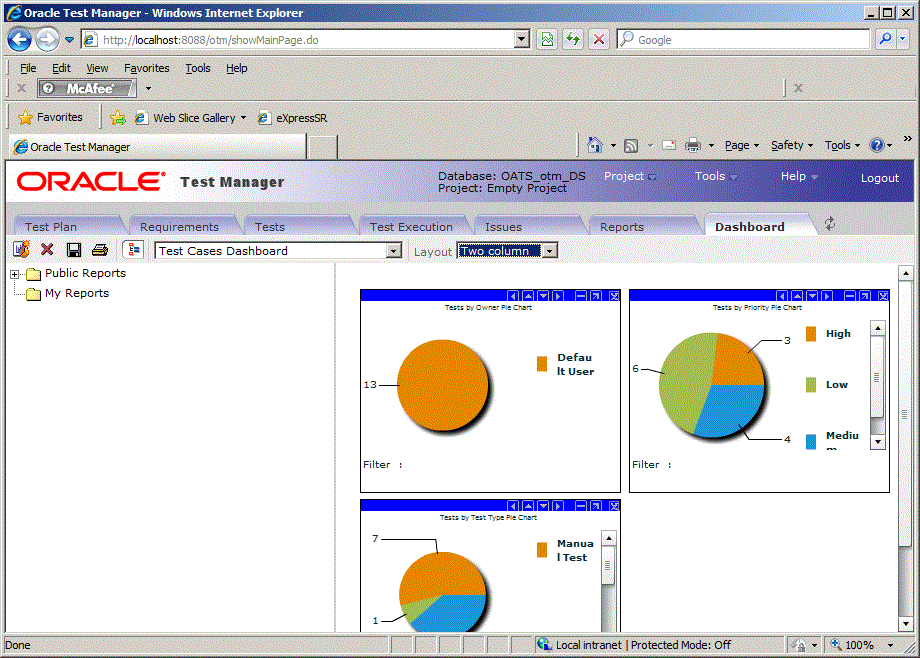
Description of "Figure 5-42 Dashboard Tab with Test Cases Dashboard"
Each graph in the Dashboard has a toolbar for moving, sizing, and closing individual graphs in the Dashboard.
-
Click New Dashboard on the main toolbar.
-
Expand the My Reports node.
-
Double-click the Requirements Medium and High report created previously in this example.
-
Expand the Public Reports node then the Requirements node.
-
Double-click the Requirements by Owner Bar Graph report. The second graph is added to the Dashboard.
Figure 5-44 New Dashboard with Selected Graphs Added
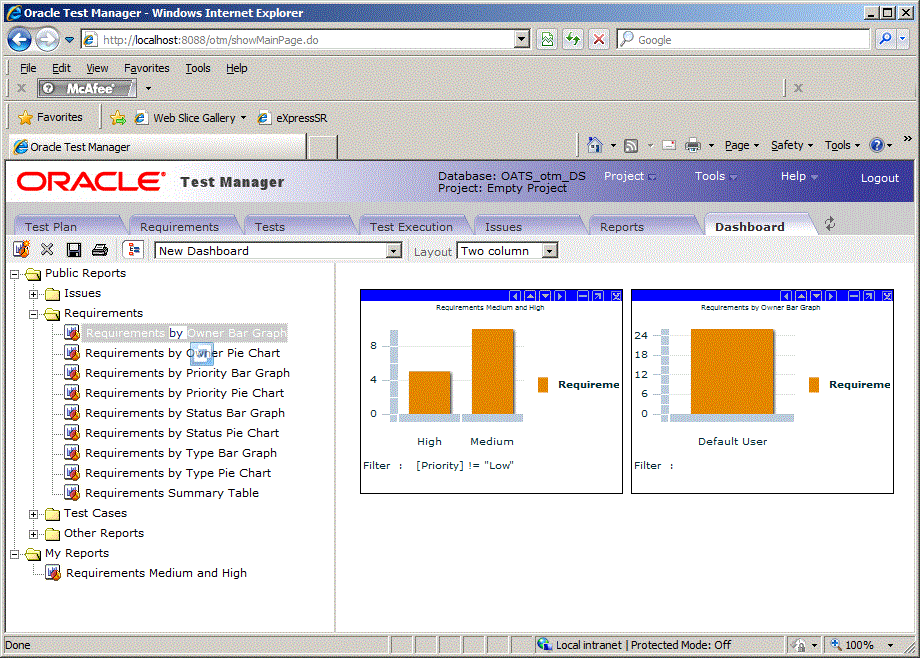
Description of "Figure 5-44 New Dashboard with Selected Graphs Added"
-
Click the left arrow [<] in the second graph's toolbar to move it to the left.
-
Click the minimize [-] button in a graph's toolbar to minimize the graph. Click the restore [+] button in a graph's toolbar to restore the graph.
-
Click Save.
-
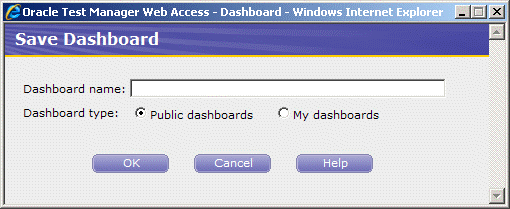
Enter My Custom Dashboard as the name for the custom Dashboard.
-
Select My Dashboards and click OK. The new dashboard is added to the Dashboard sector list.
Figure 5-46 Dashboard Tab with a Custom Dashboard Added
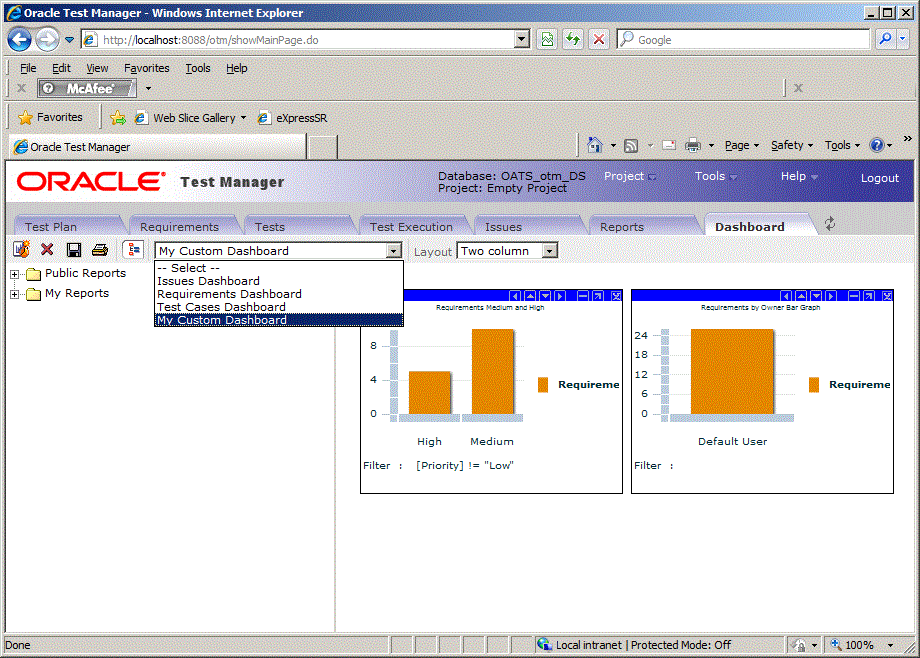
Description of "Figure 5-46 Dashboard Tab with a Custom Dashboard Added"
-
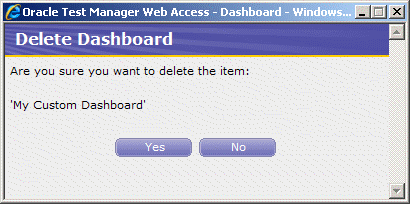
Make sure My Custom Dashboard is selected and click Delete.
-
Click Yes to delete the custom Dashboard.
This completes the Oracle Test Manager tutorial. Click Logout to exit the application.
