Data Quality Groups facilitates you to logically group the defined DQ definitions and schedule for execution. DQ definitions can be executed either through Data Quality Groups Summary window of Data Management Tools framework or in Batch Execution window of Operations module.
The roles mapped to DQ Group are as follows:
§ DQ Group Access
§ DQ Group Advanced
§ DQ Group Authorize
§ DQ Group Phantom
§ DQ Group Ready
§ DQ Group Write
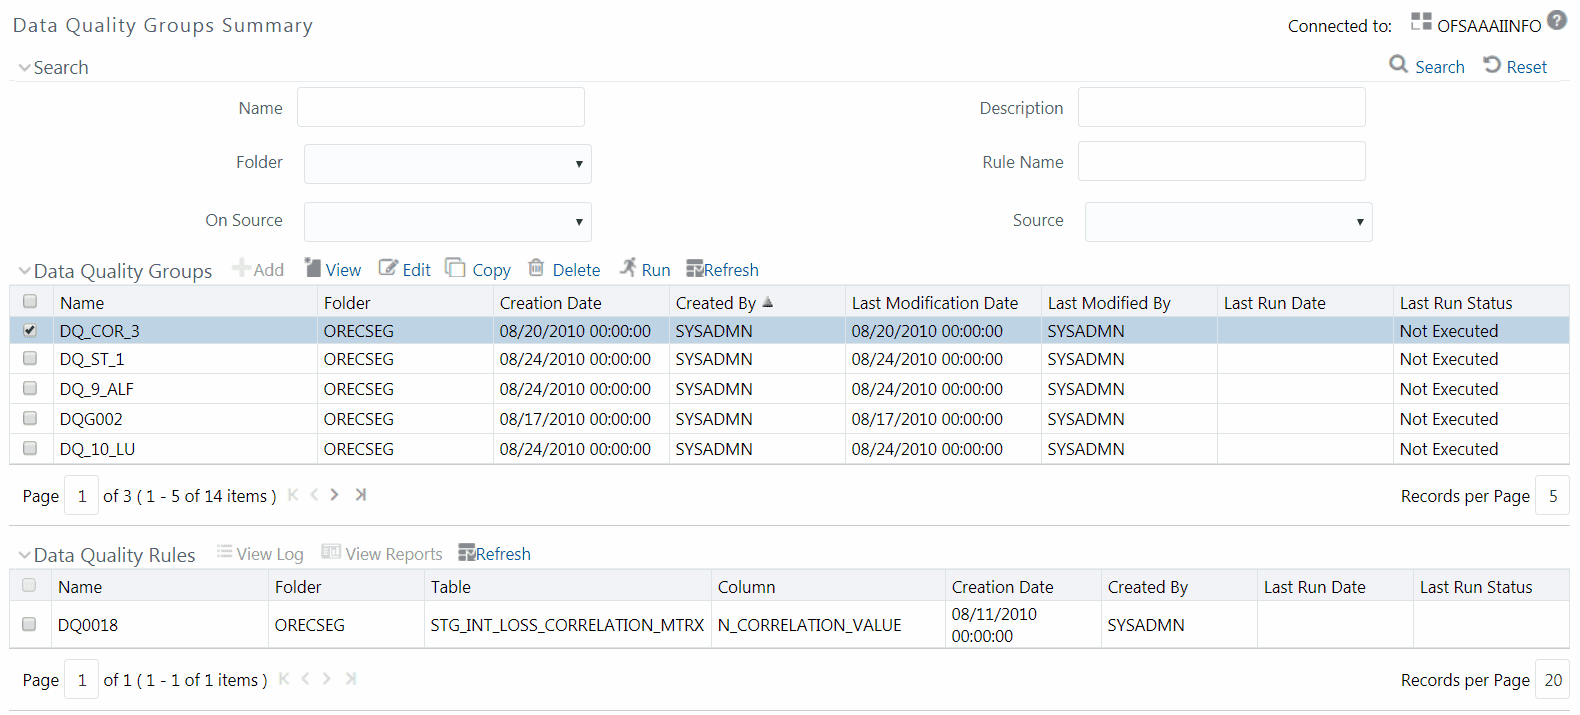
The Data Quality Groups Summary window displays the list of pre-defined Data Quality Groups with the other details such as Name, Folder, Creation Date, Created By, Last Modification Date, Last Modified By, Last Run Date, and Last Run Status. You can create and execute DQ Group definitions and view, modify, copy, refresh, or delete DQ Group definitions within the Data Quality Groups Summary window.
NOTE |
· The “Last Run Status” column in the Data Quality Groups Summary grid displays the Group execution status as Not Executed, Ongoing, Interrupted, Successful, and Failed. · Those Data Quality groups created in Operations module with the execution status as Held, Excluded, or Cancelled are displayed as Not Executed in the Data Quality Groups Summary grid. However, the same can be viewed in Operations > Batch Monitor window. · The “Last Run Status” column in Data Quality Rules summary grid displays the Rule execution status as Ongoing, Successful, or Failed. You can click on the status to view additional details in View Log window. |
You can also search for a DQ Group definition based on Name, Description, Folder, Rule Name, On Source, or Source.
· Executing Data Quality Group
· Modifying Data Quality Group
· Viewing Data Quality Group Summary Log
You can create a DQ Group definition by defining the DQ Definition details and mapping the required DQ Rules which are authorized and approved within the system. The DQ Group definition is flexible and purpose driven. Groups can be created for different subject areas such as Credit and Market or it can be application specific like Basel II, Economic capital.
To create DQ Group in the Data Quality Groups Summary window:
1. From the Data Quality Groups
Summary window, click  Add button in the Data Quality Groups tool bar.
Add button is disabled if you have selected
any checkbox in the grid. The Data Quality Group
Definition window is displayed.
Add button in the Data Quality Groups tool bar.
Add button is disabled if you have selected
any checkbox in the grid. The Data Quality Group
Definition window is displayed.
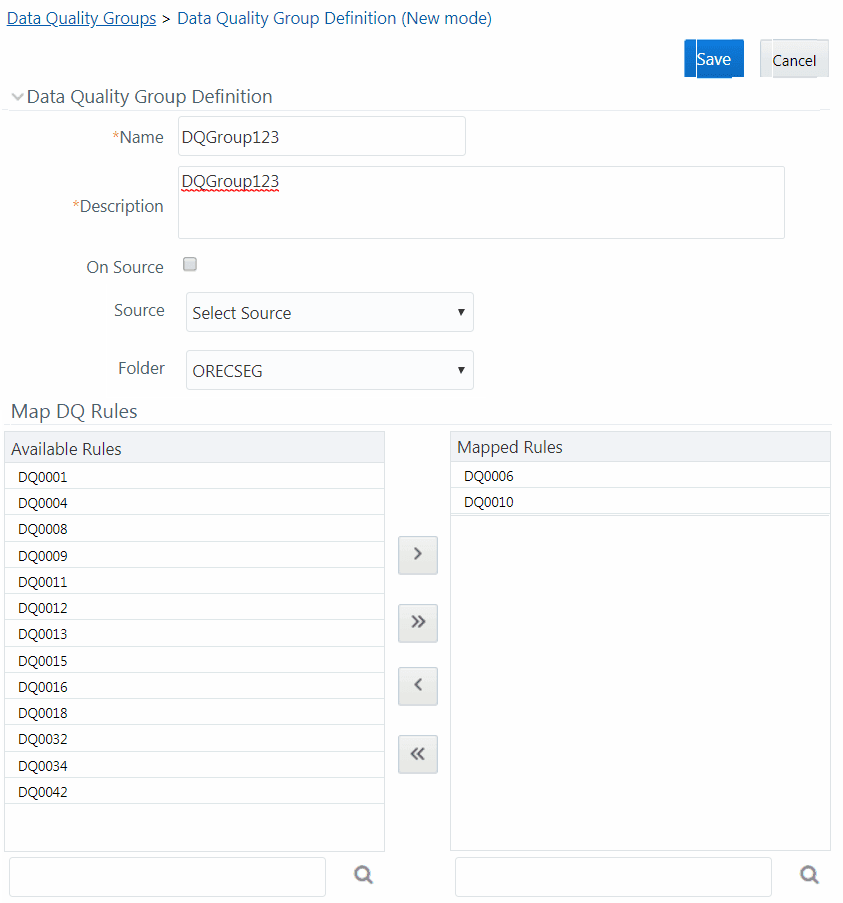
2. In the Data Quality Group Definition section, do the following:
§ Enter the Name by which you can identify the DQ Group.
§ Enter a description or related information about the DQ Group.
§ Select the On DI Source checkbox if you want to group DQ Rules defined on DI Sources.
§ Select the Source from the drop-down list. The Source drop-down list displays sources created on Oracle DB and Hive DB if it is RDBMS Information Domain or sources created on Hive DB if it is Hive Information Domain.
NOTE |
DQ rule defined on a particular application- source mapping cannot be grouped together with DQ rules defined on another application- source mapping. |
§ Select the Folder (available for selected Information Domain) from the drop-down list.
3. In the Map DQ Rules section, do the following:
§ Select the required DQ Rule from the Available
Rules list and click  . You
can also search to select a specific DQ Rule by entering the required
keyword and clicking
. You
can also search to select a specific DQ Rule by entering the required
keyword and clicking  button.
NOTE |
If a DQ group has interdependent rules, such rules would not give the expected result. |
§ To select all the listed DQ Rules, click  .
.
You can also deselect a DQ Rule by selecting from the
Mapped Rules list and clicking  or
deselect all the mapped rules by clicking
or
deselect all the mapped rules by clicking  . You can
search to deselect a specific DQ Rule by entering the keyword and clicking
button.
. You can
search to deselect a specific DQ Rule by entering the keyword and clicking
button.
4. Click Save. The defined DQ group is listed in the Data Quality Rule Summary window and can be executed for processing. For more information, see Executing Data Quality Group.
You can execute a defined DQ Group Definitions along with the mapped Rules and validation checks in the Data Quality Group Summary window. This in turn creates a Batch in Operations module. You can also create and execute a DQ Group in the Batch Execution window of Operations module. When a Data Quality Group is executed for processing, the execution details can be viewed in View Data Quality Group Summary Log.
NOTE |
Ensure Allow Correction on DI Source checkbox is selected in the System Configuration> Configuration > Others tab if you want to do the Data Quality check and correction simultaneously through DCDQ framework. |
Note that the results of execution of Data Quality Rules are stored in the table DQ_RESULT_DETL_MASTER of respective METADOM schema. During OFSAAI installation ensure the Oracle database tablespace in which this table resides is configured to AUTOEXTEND ON. Otherwise, the DQ Rule executions might result in error due to insufficient storage space available (ORA-01653 - Unable to extend tablespace by 1024). To mitigate this error, ensure sufficient storage for the tablespace has been allocated. For a single check (DQ) on a row of data, the table DQ_RESULT_DETL_MASTER stores the results in 1 row. Thus, for 2 checks on a row, the table would store results in 2 rows and so on.
A provision to run DQ Rules in a DQ Group in parallel is introduced. There are two parameters DQ_ENABLE_PARALLEL_EXEC and DQ_MAX_NO_OF_EXEC_THREADS added in the CONFIGURATION table. If DQ_ENABLE_PARALLEL_EXEC parameter is set to 'Y', DQ rules within the group are executed in parallel. DQ_MAX_NO_OF_EXEC_THREADS can be used to specify the number of rules which should be run simultaneously.
If DQ_ENABLE_PARALLEL_EXEC parameter is set to 'N' or is not present, rules within the group are executed sequentially.
NOTE |
'Fail if threshold breaches' flag will not be considered for parallel execution. |
To execute a DQ Group in the Data Quality Group Summary window:
1. From the Data Quality Groups Summary window, select the checkbox adjacent to the required DQ Group Name.
2. Click  Run button from the Data Quality Groups tool bar.
The Run button is disabled if you have selected
multiple checkboxes. The Group Execution
window is displayed.
Run button from the Data Quality Groups tool bar.
The Run button is disabled if you have selected
multiple checkboxes. The Group Execution
window is displayed.
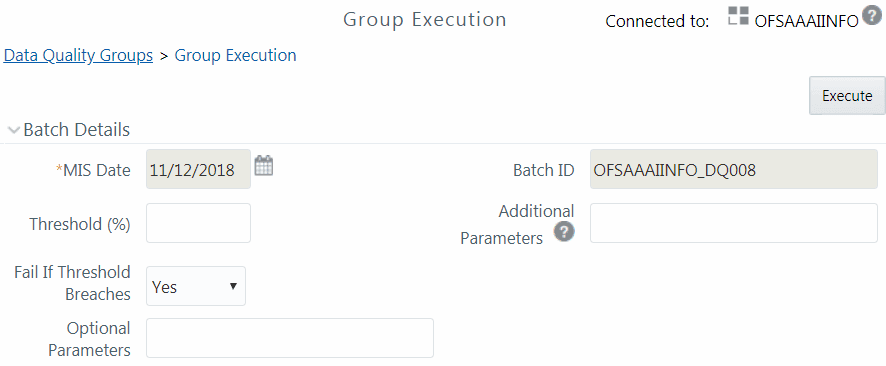
3. In the Batch details section, do the following:
1 Select the MIS Date using the Calendar. MIS Date is mandatory and refers to the date with which the data for the execution would be filtered. In case the specified MIS date is not present in the target table, execution completes with the message “No Records found” in View Log window.
NOTE |
If there is an As_Of_Date column in the table,
it looks for As_Of_Date matching the specified MIS Date. |
§ Specify the percentage of Threshold (%) limit in numeric value. This refers to the maximum percentage of records that can be rejected in a job. If the percentage of failed records exceeds the Rejection Threshold, the job will fail. If the field is left blank, the default value is set to 100%.
§ Specify the Additional Parameters as filtering criteria for execution in the pattern Key#Data type#Value; Key#Data type#Value; and so on.
Here the Datatype of the value should be “V” for Varchar/Char, or “D”’ for Date with “MM/DD/YYYY” format, or “N” for numeric data. For example, if you want to filter some specific region codes, you can specify the Additional Parameters value as $REGION_CODE#V#US;$CREATION_DATE#D#07/06/1983;$ACCOUNT_BAL#N#10000.50;
You can mouse-over  for more
information.
for more
information.
NOTE |
In case the Additional Parameters are not specified, the default value is taken as NULL. Except the standard place holders $MISDATE and $RUNSKEY, all additional parameters for DQ execution should be mentioned in single quotes. For example, STG_EMPLOYEE.EMP_CODE = '$EMPCODE'. |
§ Select Yes or No from the Fail if Threshold Breaches drop-down list. If Yes is selected, execution of the task fails if the threshold value is breached. If No is selected, execution of the task continues.
NOTE |
For Custom Check type DQ Rules in Hive Infodoms, the execution of the task will not fail even if the threshold is breached. This is a limitation. |
§ For executing DQ rules on Spark, specify ‘EXECUTION_VENUE=Spark’ in the Optional Parameters field. Before execution, you should have registered a cluster from DMT Configurations > Register Cluster window with the following details:
2 Name- Enter name of the Hive information domain.
3 Description- Enter a description for the cluster.
4 Livy Service URL- Enter the Livy Service URL used to connect to Spark from OFSAA.
4. Click Execute. A confirmation message is displayed and the DQ Group is scheduled for execution.
Once the DQ Group is executed, you can view the details of the execution along with the log information in the View Log window. For more information, see Viewing Data Quality Group Summary Log.
You can view individual Data Quality Group definition details at any given point.
To view the existing DQ Group definition in the Data Quality Group Summary window:
1. From the Data Quality Groups Summary window, select the checkbox adjacent to the required DQ Group Name. The mapped DQ Rules are displayed in the Data Quality Rules grid.
2. Click  View button from the Data Quality Groups tool
bar.
View button from the Data Quality Groups tool
bar.
The Data Quality Group Definition window displays the DQ Group definition details and the mapped DQ rules.
You can update the existing DQ Group definition details except for the Group Name. To update the required DQ Group definition details in the Data Quality Groups Summary window:
1. From the Data Quality Groups Summary window, select the checkbox adjacent to the required Group Name.
2. Click  Edit button from the Data Quality Groups tool
bar. The Edit - DQ Group - DQ Definition Mapping
window is displayed.
Edit button from the Data Quality Groups tool
bar. The Edit - DQ Group - DQ Definition Mapping
window is displayed.
3. Update the details as required. For more information, see Creating` Data Quality Group.
4. Click Save and update the changes.
You can copy the existing DQ Group details to quickly create a new DQ definition based on the existing details or by updating the required parameters. To copy an existing DQ Group definition in the Data Quality Groups Summary window:
1. From the Data Quality Groups Summary window, select the checkbox adjacent to the required Group Name in the list whose details are to be duplicated.
2. Click  Copy button from the toolbar. Copy
button is disabled if you have selected multiple checkboxes. The Copy - DQ Group - DQ Definition Mapping window
is displayed.
Copy button from the toolbar. Copy
button is disabled if you have selected multiple checkboxes. The Copy - DQ Group - DQ Definition Mapping window
is displayed.
3. Edit the DQ Group Name and other details as required. For more information, see Create Data Quality Group.
4. Click Save. The new DQ Group definition is displayed in the Data Quality Groups Summary window.
You can view the execution log details of Data Quality Rules in the View Log window. The View Log window displays the details such as Check Name, Log Message, Message Date, Message Time, Total Rows, Rows Impacted, Assignment Type, Assignment Severity, and Severity Message of the executed Data Quality Rules.
To view the Data Quality Rule execution log details in the Data Quality Groups Summary window:
1. From the Data Quality Groups Summary window, select the DQ Group Name whose execution log you want to view.
The Data Quality Rules associated with the selected Group are displayed in the Data Quality Rules grid.
2. Click the link in Last Run Status column corresponding
to the required Data Quality Rule.
Or
Select the required Data Quality Rule and click  View Log from the Data Quality Rules toolbar.
The View Log window is displayed with the latest execution data pertaining to Data Quality Rule selected.
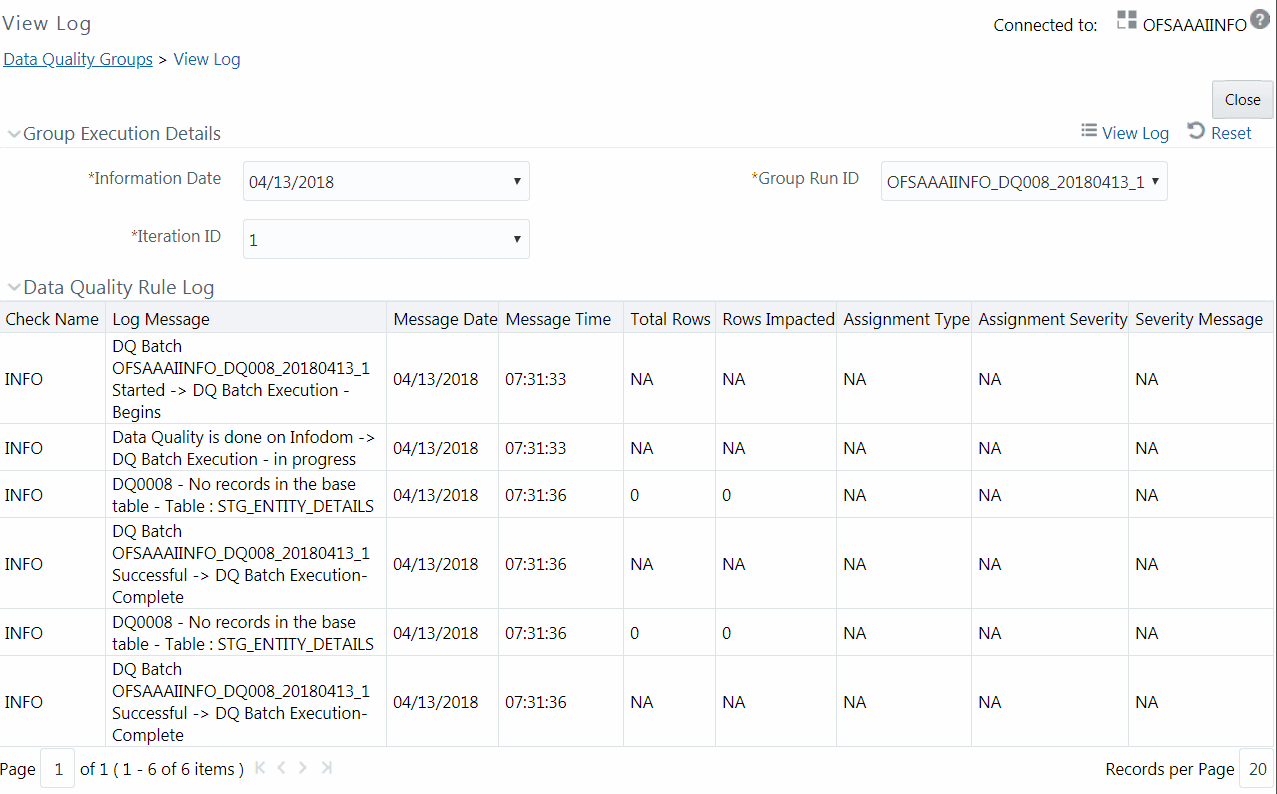
§ Select the Information Date from the drop-down list. Based on selection, you can select the Group Run ID and Iteration ID from the corresponding drop-down lists.
§ Click View Log button from the Group Execution Details
toolbar. The Data Quality Rule Log grid displays the execution details
of the selected Data Quality Rule. You can also click  Reset button in the Group Execution Details toolbar
to reset the selection.
Reset button in the Group Execution Details toolbar
to reset the selection.
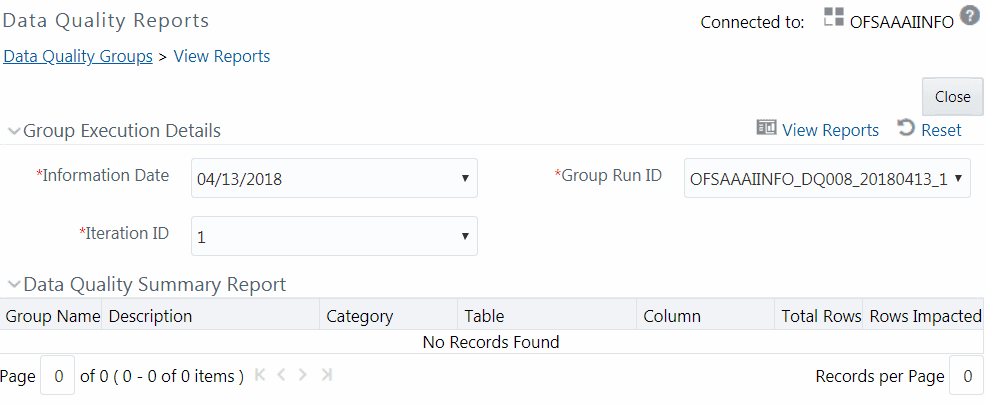
You can view the execution summary report of Data Quality Rules in the Data Quality Reports window. The Data Quality Summary Report grid displays the details such as Group Name, Description, Category, Table, Column, Total Rows, and Rows Impacted. By clicking the corresponding DQ check link under Category, you can view the Data Quality Detailed Report grid, which displays details of the record which has a data correction such as Primary Key Columns, Error Value, and Assignment value.
NOTE |
If you have opted to run T2T with data correction, then the data quality checking is done in the source and the Data Quality Report generated is only a preview report of the actual execution. That is, though the execution may have failed, you can view Data Quality report. |
To view the Data Quality Reports window:
1. From the Data Quality Groups Summary window, select the DQ Group Name whose DQ Report you want to view.
The Data Quality Rules associated with the selected Group are displayed in the Data Quality Rules grid.
2. Select the checkbox corresponding to the DQ rule
and click  View
Reports button in the Data Quality Rules grid. The Data
Quality Reports window is displayed.
View
Reports button in the Data Quality Rules grid. The Data
Quality Reports window is displayed.
3. Select the Information Date from the drop-down list. Based on selection, you can select the Group Run ID and Iteration ID from the corresponding drop-down lists.
4. Click  button from the Group
Execution Details toolbar. The Data Quality Summary Report grid is displayed.
button from the Group
Execution Details toolbar. The Data Quality Summary Report grid is displayed.
5. Click the DQ check link under the Category column. The Data Quality Detailed Report grid is displayed.
For Control Total Check type, the Data Quality Detailed Report displays Subject Reference Value, Operator, Aggregate Reference Value, Group By columns, Aggregate Row Status and Rows Impacted.
You can remove the DQ Group definition(s) which are created by you and which are no longer required in the system by deleting from Data Quality Groups Summary window.
1. From the Data Quality Groups Summary window, select the checkbox adjacent to the required Group Name whose details are to be removed.
2. Click  Delete button from the Data Quality Groups tool
bar.
Delete button from the Data Quality Groups tool
bar.
3. Click OK in the information dialog to confirm deletion.